• 概要
  • レビュー
  • コメント

Cumulated Volume Analyzer

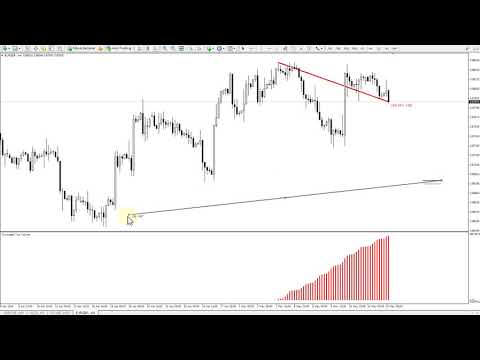
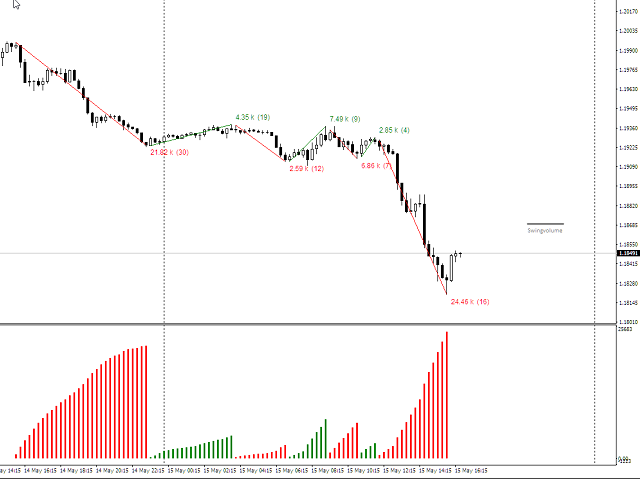
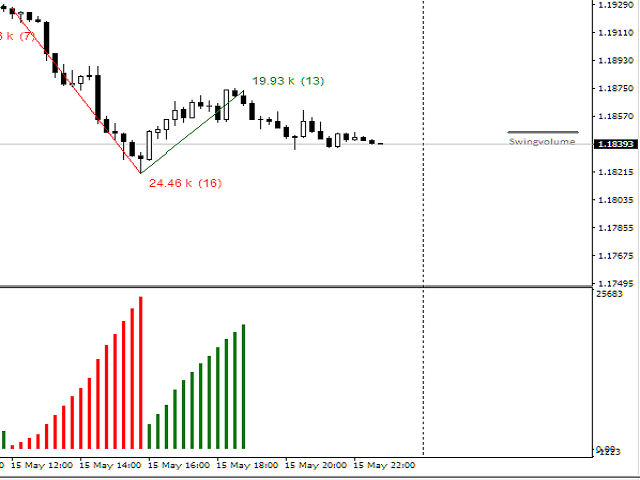
The indicator enables measurement and analysis of accumulated volume (tick), in any chosen swing. The user's task is to mark individual measuring sections with the help of a "crayon's". The indicator automatically sums the volumes of individual candles. Volume analysis is a basic element of the VSA (volume spread analysis) technique.

A method of using an indicator is shown on the film.


Parameters description

  • Anchor_mode - If true, one end of the measuring line is always hooked on the current candle
  • AutoDivider - if true, the value of the displayed volume is divided by 1000 and suffix "k" is added
  • Swing_width - tickness of measuring line
  • Color_Swing_UP - color of rising measuring line
  • Color_Swing_DN - color of falling measuring line
おすすめのプロダクト
Reversal Monster Mini
Abdulfattah Yahya Mohammed Alhazmi
The Most advanced and comprehensive EA to trade Trend Reversals/Pullbacks It is a very profitable EA, to trade trends breakout, and manage trades, takeprofit, stoploss, move to breakeven, and trailing stop. The   “Reversal Monster EA”   trades Reversal/Pullbacks when the current price of the pair pullback to a predefined horizontal level or trendline on the currency chart. The opening of the position can be immediate after pullback to the drawn trendline or after closing the candle below/abov
FREE
Market Profile 3
Hussien Abdeltwab Hussien Ryad
3 (2)
Market Profile 3 MetaTrader 4 indicator  — is a classic Market Profile implementation that can show the price density over time, outlining the most important price levels, value area, and control value of a given trading session. This indicator can be attached to timeframes between M1 and D1 and will show the Market Profile for daily, weekly, monthly, or even intraday sessions. Lower timeframes offer higher precision. Higher timeframes are recommended for better visibility. It is also possible t
FREE
Waterfront - A unique trending indicator. The new system adapts to the market, eliminates additional conditions and copes with its task. A revolutionary new way to detect the beginning of a trend early. Trend indicator, shows signals, can be used with an optimal risk ratio. It uses reliable algorithms in calculations. It shows favorable moments for entering the market with arrows, that is, using the indicator is quite simple. Trend indicators make it possible to classify the direction of pric
OTRX Fimathe Backtest is a tool for the Trader or Enthusiast who uses the Fimathe technique created by Trader Marcelo Ferreira to carry out his training and validate if he can obtain profitability. In this tool you will be able to: 1. Define whether you are looking for a buy or sell entry. (Trend). 2. Define by clicking twice on the horizontal lines where your Reference Zone and your Neutral Zone will be. 3. Monitor the entry, subcycle and exit of the trade. 4. Trading Summary, Daily,
FREE
Утилита  TSim   позволяет симулировать ручную торговлю в Тестере Стратегий MetaTrader 4. В панеле можно устанавливать размеры лота, тейпрофита и стоплосса. Панель имеет кнопки Sell   и Buy для выставления рыночных ордеров, а также кнопки CloseSell, CloseBuy и CloseAll для быстрого закрытия ордеров. Под панелью отображается список открытых ордеров. Внимание. Панель работает только в Визуальном режиме Тестера Стратегий MetaTrader 4.
FREE
Description: Please tick "Show object descriptions" in chart properties to enable hrays views That utility converts a trendline into a horizontal ray known as tool for drawing supply and demand zones. Simply create a trendline on a chart and once selected, it will get converted. Ray remains horizontal while dragging.  Quick ray plot: press "R" key to create horizontal ray. It will be snapped to the nearest OHLC value Further versions will be improved. For feature request please post new c
「Turbo Helper for scalping」(スキャルピング用ターボヘルパー)は完全なトレーディングシステムです。チャート上に矢印を表示して、トレーダーに注文を開くタイミングと方向を示します。また、四角形のシンボルでトレーダーに取引を終了するタイミングを示します。その後、このインジケーターは取引における予想されるポイント数をチャート上に表示します。この値は実際のスプレッドの大きさやブローカーのスワップを考慮していないため、若干異なる場合があります。ただし、より正確な計算をするためには、インジケーターの設定で「平均デイリースプレッド」というパラメーターでスプレッドのサイズを指定できます。計算時には、システムはこのパラメーターの値を考慮します。このトレーディングシステムは、トレーダーの代わりに市場分析を行い、具体的なアドバイスを提供します。また、「Turbo Helper for scalping」はメールと電話でシグナルを送信します。 システムの利点: 完全なトレーディングシステム M5、M15、M30の時間枠でスキャルピングをするために設計されています 値を再描画しません 市
What is Trading Session Time indicator for MetaTrader? Trading Session Time indicator for MetaTrader is a tool designed to save your time and efforts. At the same time, it is also helpful to spot possible trading opportunities. The human brain is very efficient in finding visual patterns. Trading Session Time indicator helps highlight areas on the chart to find these patterns. Once you specify a time or an interval, the indicator will scan the chart and draw the areas of interest for you. The in
Real-time spread tracking and monitoring software Displays spread values in form of histograms on current timeframe of chart Convenient for analyzing spread changes, as well as for comparing trading conditions of different brokers By placing on desired chart, the spread changes at different trading times are displayed Additionally Fully customizable Works on any instrument Works with any broker
FREE
Free automatic Fibonacci is an indicator that automatically plots a Fibonacci retracement based on the number of bars you select on the BarsToScan setting in the indicator. The Fibonacci is automatically updated in real time as new highest and lowest values appears amongst the selected bars. You can select which level values to be displayed in the indicator settings. You can also select the color of the levels thus enabling the trader to be able to attach the indicator several times with differe
FREE
The indicator allows you to trade binary options. The recommended time frame is М1 and the expiration time is 1,2,3 minutes. The indicator suitable for auto and manual trading. A possible signal is specified as a arrows above/under a candle. You should wait until the candle closes! Arrows are not re-painted Trade sessions: TOKYO section (Half-end) Currency pairs: USD/JPY Working time frame: M1 Expiration time: 1,2,3 minutes. The indicator also shows good results when using the martingale strateg
FREE
Rainbow MT4 is a technical indicator based on Moving average with period 34 and very easy to use. When price crosses above MA and MA changes color to green, it’s a signal to buy. When price crosses below MA and MA changes color to red, it’s a signal to sell. The Expert advisor ( Rainbow EA MT4) based on Rainbow MT4 indicator, as you can see in the short video below is now available here .
FREE
The indicator analyzes the volume scale and splits it into two components - seller volumes and buyer volumes, and also calculates the delta and cumulative delta. The indicator does not flicker or redraw, its calculation and plotting are performed fairly quickly, while using the data from the smaller (relative to the current) periods. The indicator operation modes can be switched using the Mode input variable: Buy - display only the buyer volumes. Sell - display only the seller volumes. BuySell -
FREE
Features: 1- Get OB/OS Levels from Golden MA Levels 2- Wait for Buy/Sell Start Level Cross 3- Optional: Should price cross Mid Level in earlier bars 4- Optional: Crossing bar High/Medium Volume 5- Optional: MA Stacked to check up/down trend for current TF 6- Optional: NRTR higher timeframes aligned Check Detailed blog post explained: https://www.mql5.com/en/blogs/post/758457 Levels with Buffers available here: Golden MA Levels Indicator: https://www.mql5.com/en/market/product/119515
FREE
Symbol Manager
Taras Slobodyanik
5 (4)
Symbol Manager or Grid Manager, designed to group orders into one position (by symbol and by direction). This utility will be useful to multi-currency traders, who can have multiple orders on several pairs. You will be able to see the total number of lots, the total profit, and set virtual stop loss and virtual take profit. To set a real TP (or SL), you must first set the virtual value, and then enter the command in this cell: "set". If you want to set real TP/SL for all orders at once, then en
Lib4 EAPadPRO for MT4
Vladislav Andruschenko
5 (2)
MetaTrader4のエキスパートアドバイザーに情報パネルを追加するためのライブラリ。 プログラムの情報とインターフェースが取引で利益をもたらすことを保証することはできませんが、プログラムの最も単純なインターフェースでさえ第一印象を強めることができると断言できます。 エキスパートアドバイザーに パネルを追加するための詳細な説明と手順は、ブログにあります:   LIB-EAPADPROステップバイステップの説明 パネルの詳細な説明と EAPADPROの使用手順 MetaTrader5ライブラリバージョン 追加のプロセスは 10のステップで 構成されており、それらについては記事で詳しく説明しています。 ライブラリのインストール このサイトからライブラリをインストールします。 エキスパートアドバイザーを開きます。 コードをインストールするためのサンプルとステップバイステップガイド、ファイル Exp-EAPADPRO LIBRARY TEST(ブログにあります)を開き ます。 推奨事項に記載されているように各ステップを実行するか、サイトからのステップバイステップの説明を使用してください
FREE
The Arrow Scalper
Fawwaz Abdulmantaser Salim Albaker
1 (2)
Dear Friend..  I share with you this simple Expert Adviser .. it is full automatic  this Expert Adviser following the trend of the pair you install on or any stocks or indices , it is works like that: - when the trend on H4 chart show a start of up trend the expert will wait till the 15M & 1H charts show an up trend the EA will open a buy order directly , and do the same for down trend and open a sell order the buy or sell  order lot size and take profit and stop loss will measured manually  by
FREE
Stay updated with Multicurrency Overview!! The algorithm of this EA releases an average of the movement percentage of all the Forex currencies linked to a single currency, isolating it, letting us to comprehend its real and specific trend. Above on the left, a panel show us efficiently the trend of the currency, in the timeframe actually used. The second panel will keep you updated on macroeconomic news. P.N.:The news time is based on your pc clock time, this way you won't have any problem r
作業ロジック ストップアウトユーティリティは、ストップアウトレベルまで残っているポイント数を示すシンプルですが非常に便利なインジケーターです。 その利点は、多くのトレーダーが利益を追求して取引する際のリスクを故意に過大評価し、利用可能な証拠金を最大限に使用するという事実にあります。この場合、ブローカーがあなたのポジションを強制的に閉じることができる場所を知ることは非常に重要です。 チャートにインジケーターを配置するだけで、買いまたは売りのオープンポジションに応じて、チャート上にこの取引の価格の境界マークが表示されます。 ポジションを開くまで、ラインはチャートに表示されません。 おすすめのロボットスキャルパー-       https://www.mql5.com/en/market/product/77108 変数 フォントサイズ-ラベルのフォントサイズ エッジインデント-エッジからインデントします 線の色-線の色 テキストの色-テキストの色
FREE
Please note: This demo will work only on EURUSD live chart. It will not run in the strategy tester. ChartTrader is a professional trading tool that every trader needs in their toolbox. It has been developed to work with the MetaTrader 4 platform. ChartTrader offers a number of options to make placing orders in the Forex market quick and easy. The GUI sits on the chart window, so there is no need to navigate to separate windows when placing orders. The program allows you to set pending and insta
FREE
TrendPlus
Sivakumar Subbaiya
4.08 (12)
Trend Plus   Trendplus  Indicator   Time Frame: Suitable for any time frame.  Purpose: Trend Prediction. Blue and red candle indicate the buy and sell call respectively. Buy: When the blue candle is formed buy call is initiated. close the buy trades when the next red candle will formed.   Sell: When the Red candle is formed Sell call is initiated. close the Sell trades when the next blue candle will formed.   Happy trade!!
FREE
FREE UNTIL FEBRUARY 14, 2023 SPEND MORE TIME WITH YOUR FAMILY. ENJOY LIFE… DO NOTHING. This version is only auto set of Takeprofit and StopLoss Main Version  of  TropangFX:   MT4 Version  |  MT5 Version Recommended timeframe:   H1 Supported currency pairs:  GBPUSD, EURUSD, EURCHF ,   USDCAD, USDCHF ,  AUDCAD, EURCAD, EURAUD and many more... Requirements The EA requires good brokerage conditions:   low spread   and   slippage   during the rollover time. I advise using a really   good ECN
FREE
The Saz_Timer indicator belongs to the Saz_Forex suite of professional indicators designed by Traders, for Traders. This indicator will show minutes and seconds of real time on the chart window. The indicator uses the OnTimer() event so it can update even while no ticks received on the chart. The text is shown toward the bottom right of the chart, encircled red in the screenshot. Inputs: Text Colour, allows selection of the colour for the text.
FREE
Fastest way to change the period. Suitable for traders who use many charts and timeframes. Size, shape and color can be customized. Inputs Parameters Corner — Choose corner placement Standart is "Right lower chart corner" Color — Background color of the button ColorText — Text color of the button ColorOn — Background color of the button for the current period ColorOnText — Text color of the button for the current period Font — Arial, Verdana... FontSize — Size of the font in pixels DistanceX —
FREE
Virtual Assistant MINI   VIRTUALL ASSISTANT = MAKE YOUR TP AND SL VIRTUAL!   Tool meant to control your stop loss and take profit by converting them to virtual SL/TP (with support for TRAILING) Convert all SL and TP to virtual so your exits on trades are hidden from your broker! Run this EA on any graph, choose 1MIN timeframe (VA is autosaving data only on new bar detected, so graph TF equals to VA autosave period) !!! When using virtual trade exits, stable connection is needed for order execut
FREE
The indicator shows the potential trend direction by cyclical-wave dependence. Thus, all the rays of the intersection will be optimal rays, in the direction of which the price is expected to move, taking into account the indicator period. Rays can be used as a direction for potential market movement. But we must not forget that the approach must be comprehensive, the indicator signals require additional information to enter the market.
トレンドキャッチャー: アラートインジケーター付きのトレンドキャッチャーストラテジーは、市場トレンドやポテンシャルなエントリーポイントやエグジットポイントを特定するのに役立つ多目的な技術分析ツールです。動的なトレンドキャッチャーストラテジーを備えており、市場状況に適応してトレンドの方向を明確に視覚化します。トレーダーは、自身の好みやリスク許容度に合わせてパラメーターをカスタマイズできます。このインジケーターはトレンドの識別を支援し、ポテンシャルなリバーサルをシグナルし、トレイリングストップのメカニズムとして機能し、市場への迅速な対応のためのリアルタイムアラートを提供します。 特徴: - トレンドの識別:上昇トレンドと下降トレンドをシグナルします。 - トレンドのリバーサル:ローソク足の色が上昇から下降に変わった場合やその逆の場合に、ポテンシャルなリバーサルを警告します。 - リアルタイムアラート:新しいトレンドの識別に対するアラートを生成します。 推奨事項: - 通貨ペア:EURUSD、AUDUSD、XAUUSDなど... - タイムフレーム:H1。 - アカウン
FREE
The script changes the timeframe of all open charts on the MetaTrader platform in a simple click without having to do it manually by going through all the open charts and changing them one by one, it is handy when there are many open charts. The script lets you choose which timeframe to apply to the open charts. The timeframes available in the dropdown menu are the ones already available on the MetaTrader platform : M1, M5, M15, M30, H1, H4, D1, W1, MN1.
FREE
Pips 外国為替はすぐに使える取引システムです。 このインジケーターは、いつ、どの方向で注文をオープンする必要があるかをチャート上の矢印で示します。 矢印が緑の場合は買い取引をオープンし、矢印が赤の場合は売り取引をオープンします。 すべてが非常にシンプルで非常に効果的です。 テイクプロフィットは15~25ポイントを設定。 ストップロスはポイントレベルで設定されます。 ドットが移動すると、すぐに StopLoss をオーバーライドします。 M1 と M5 の取引に推奨される時間枠。 これはスキャルピング戦略であり、最小の時間枠で最も効果的です。 通貨ペアは任意です。 推奨される通貨のうち、GBPUSD、EURUSD、XAUUSD、USDCHF を提供できます。 設定はデフォルトのままにすることができます。 この戦略を使用すると、毎日 10 ~ 20 件の取引を開始できます。 Pips 外国為替インジケーターの利点: これは、あらゆる通貨ペアに対応する既成の取引戦略です。 これは最小の時間枠 M1 および M5 で取引するためのスキャルピング取引戦略です。 この戦略は非常にシンプル
PatternVol EA
Alexandr Gribanov
4.5 (2)
PatternVol EAは、市場の独自の観察に基づいて作成され、パターン、ローソク足分析、ローソク足ボリュームの分析で構成され、EAにはインジケーターが含まれていません。現時点では、アドバイザーは私の非インジケーター戦略の小さなコンストラクターです。各戦略を個別に無効化および有効化するか、複数の戦略からアセンブリを作成できます。アドバイザーの作業は今日まで続いており、新しい戦略が追加され、アルゴリズムが改善されています。将来的には、誰もが独自の取引戦略を組み立てることができる、非指標戦略の大規模なアグリゲーター(コンストラクター)になるでしょう。 * Expert Advisorは、ECNアカウント(5桁)およびH1タイムフレームのEURUSDペアでの使用をお勧めします。 Expert Advisorは、厳密なSLおよびTP設定を使用します。 Test DEMO: https://www.mql5.com/ru/signals/978514 エキスパートアドバイザーのパラメーター Slippage...     -すべりの最大レベル OnOf
FREE
このプロダクトを購入した人は以下も購入しています
Gann Made Easy は、ミスター・ギャンの理論を使用した取引の最良の原則に基づいた、プロフェッショナルで使いやすい外国為替取引システムです。 W・D・ガン。このインジケーターは、ストップロスとテイクプロフィットレベルを含む正確な買いと売りのシグナルを提供します。 PUSH通知を利用して外出先でも取引可能です。 購入後はご連絡ください!私の取引のヒントと素晴らしいボーナスインジケーターを無料で共有します! おそらく、ギャンの取引手法についてはすでに何度も聞いたことがあるでしょう。通常、ギャンの理論は初心者のトレーダーだけでなく、すでにある程度の取引経験がある人にとっても非常に複雑なものです。なぜなら、ギャンの取引手法は理論的にはそれほど簡単に適用できるものではないからです。私はその知識を磨き、最良の原則を私の外国為替インジケーターに組み込むために数年を費やしました。 このインジケーターは非常に簡単に適用できます。必要なのは、それをチャートに添付し、簡単な取引推奨事項に従うだけです。このインジケーターは常に市場分析の仕事を行い、取引の機会を探します。適切なエントリーポイントを検出
最初のパルスレベルを反転 (RFI)     指示する     ロシア     -        utilizar con   el indicador の ESP 推奨事項 -   TPSpro トレンド プロフェッショナル版 -   MT5のバージョン 最も重要なことは、将来においても最も重要なことです。 機能のプリンシパル: ゾーンのほとんどは、ベンダーとコンプラドールによってアクティブ化されます。 状況を直感的に把握できるよう、初期の衝動を修正します。 LOGIC AI: MUESTRA zonas (círculos) parabuscar puntos de entrada cuando se activa una plantilla 視覚的に優れた視覚効果があり、最も重要な機能がすべて揃っていることに注意してください。 優れたニベレス/ゾーンの視覚化 (modo MTF) 世界で最も人気のある場所/ゾーンです。これを使用するのに最適な方法です (   TPSproTREND PRO   )。 アルゴリズム プロフェッショナル セパラド パソ ア パソ パラ オペラ それは
まず第一に、この取引インジケーターは再描画されず、再描画されず、遅延しないことを強調する価値があります。これにより、手動取引とロボット取引の両方に理想的なものになります。 ユーザーマニュアル:設定、入力、戦略。 アトミックアナリストは、価格の強さとモメンタムを利用して市場でより良いエッジを見つけるためのPA価格アクションインジケーターです。ノイズや誤ったシグナルを除去し、取引ポテンシャルを高めるための高度なフィルターを備えています。複雑なインジケーターの複数のレイヤーを使用して、アトミックアナリストはチャートをスキャンし、複雑な数学的計算をシンプルなシグナルと色に変換します。これにより、どのような初心者トレーダーでも理解して使用し、一貫した取引の決定を行うことができます。 「アトミックアナリスト」は、新規および経験豊富なトレーダー向けにカスタマイズされた包括的な取引ソリューションです。プレミアムインジケーターとトップノッチの機能を1つの取引戦略に組み合わせ、すべてのタイプのトレーダーにとって汎用性のある選択肢にします。 デイリートレーディングとスキャルピング戦略:高
Gold Stuff
Vasiliy Strukov
4.89 (238)
Gold Stuff は、金専用に設計されたトレンド指標であり、あらゆる金融商品にも使用できます。 インジケーターは再描画せず、遅れません。 推奨時間枠 H1. それインディケータでフルオートExpert Advisor EA Gold Stuffが動作します。 あなたは私のプロフィールでそれを見つけることができます. 設定と個人的なボーナスを得るために、購入後すぐに私に連絡してください! トレンド スキャナーの強力なサポートを利用して、無料のインジケーターを入手し、プライバシーを守ります。あーみー!   設定 矢印を描く - オンオフ。 チャートに矢印を描く。 アラート - 可聴アラートのオンオフ。 メール通知 - オンオフ。 電子メール通知。 プチ通知 - オンオフ。 プッシュ通知。 次に、色域を調整します。 Gold Stuff は、金専用に設計されたトレンド指標であり、あらゆる金融商品にも使用できます。 インジケーターは再描画せず、遅れません。 推奨時間枠 H1. それインディケータでフルオートExpert Advisor EA Gold Stuff
Trend Punch
Mohamed Hassan
4.95 (19)
This indicator is unstoppable when combined with our other indicator called  Support & Resistance . After purchase, send us a message and you will get it   for  FREE as a BONUS! Introducing Trend Punch , the revolutionary forex trend indicator that will transform the way you trade! Trend Punch is uniquely designed to provide precise buy and sell arrows during strong market trends, making your trading decisions clearer and more confident. Whether you're trading major currency pairs or exotic sym
An exclusive indicator that utilizes an innovative algorithm to swiftly and accurately determine the market trend. The indicator automatically calculates opening, closing, and profit levels, providing detailed trading statistics. With these features, you can choose the most appropriate trading instrument for the current market conditions. Additionally, you can easily integrate your own arrow indicators into Scalper Inside Pro to quickly evaluate their statistics and profitability. Scalper Inside
TPSpro TREND PRO は 、市場を自動的に分析し、トレンドとその各変化に関する情報を提供し、再描画せずに取引に参加するためのシグナルを提供するトレンド指標です。 インディケータは各ローソク足を使用し、個別に分析します。さまざまなインパルス(アップまたはダウンインパルス)を指します。通貨、仮想通貨、金属、株、指数の取引への正確なエントリーポイント! バージョンMT5                   インジケーターの完全な説明   インジケーター -   RFI LEVELS と併用することをお勧めします。 主な機能: レンダリングなしで正確な入力信号! シグナルが表示された場合、それは関連性を維持します。これは、シグナルを提供してからそれを変更する可能性があり、入金時の資金の損失につながる可能性があるリドローインジケーターとの重要な違いです。より高い確率と精度で市場に参入できるようになりました。矢印が表示された後、ターゲットに達する (利益確定) か反転シグナルが表示されるまで、ローソク足を色付けする機能もあります。 STOP LOSS / TAKE PROFIT
mql5と Telegramの モーニング・ブリーフィングで、詳細とスクリーンショットを含む毎日のマーケット・アップデートをご覧 ください! FX Power MT4 NGは 、長年の人気を誇る通貨強度計FX Powerの次世代モデルです。 この次世代ストレングスメーターは何を提供するのでしょうか?初代FXパワーの魅力すべて プラス GOLD/XAUの強さ分析 より正確な計算結果 個別に設定可能な分析期間 カスタマイズ可能な計算上限値により、さらに優れたパフォーマンスを実現 もっと見たい人のための特別なマルチインスタンス設定 すべてのチャートでお好みの色を無限に設定可能 数え切れないほどの通知オプションにより、重要なことを見逃すことはありません。 Windows 11とmacOSのスタイルで角を丸くした新しいデザイン 魔法のように動くインジケーターパネル FXパワーの主な機能 すべての主要通貨の強さの完全な履歴 すべての時間枠における通貨の強さの履歴 すべてのブローカーとチャートで同一の計算結果 100%信頼できるリアルタイム計算 -> リペイントなし ドロップダウン・リストから
現在20%OFF! 初心者やエキスパートトレーダーのためのベストソリューション! このダッシュボードソフトウェアは、28の通貨ペアで動作しています。それは私達の主要な指標(高度な通貨の強さ28と高度な通貨インパルス)の2に基づいています。それは全体の外国為替市場の大きい概観を与えます。それは、すべての(9)時間枠で28の外国為替ペアのための高度な通貨の強さの値、通貨の動きの速度と信号を示しています。チャート上で1つのインディケータを使用して市場全体を観察し、トレンドやスキャルピングの機会をピンポイントで見つけることができたら、あなたのトレードがどのように改善されるか想像してみてください。 このインディケータには、強い通貨と弱い通貨の識別、潜在的な取引の識別と確認がより簡単になるような機能が搭載されています。このインディケータは、通貨の強さや弱さが増加しているか減少しているか、また、すべての時間枠でどのように機能しているかをグラフィカルに表示します。 新機能として、現在の市場環境の変化に適応するダイナミックなマーケットフィボナッチレベルが追加され、すでに当社のAdvan
Trend Screener
STE S.S.COMPANY
4.8 (87)
トレンドインジケーター、1つのツールに組み込まれたすべての重要なトレンド機能を備えたトレンドトレーディングとフィルタリングのための画期的なユニークなソリューション! これは、すべてのシンボル/商品(外国為替、商品、暗号通貨、インデックス、株式)で使用できる100%再描画されていないマルチタイムフレームおよびマルチ通貨インジケーターです。 期間限定オファー: サポートおよびレジスタンス スクリーナー インジケーターは、たった 50 ドルで永久的にご利用いただけます。(元の価格 250 ドル) (オファー延長) トレンドスクリーナーは、チャート内のドットで矢印トレンドシグナルを提供するインジケーターに続く効率的なインジケーターです。 トレンド分析インジケーターで使用できる機能: 1.トレンドスキャナー。 2.最大利益分析を備えたトレンドライン。 3.トレンド通貨強度メーター。 4.アラート付きのトレンド反転ドット。 5.アラート付きの強いトレンドドット。 6.トレンド矢印 毎日の分析例、毎日のシグナルパフォーマンス...など、トレンドスクリーナーインジケーターを使用して、ここで見つけること
FX Volume
Daniel Stein
4.58 (33)
mql5と Telegramの モーニング・ブリーフィングで、詳細とスクリーンショットを含む毎日のマーケット・アップデートをご覧 ください! FX Volumeは、ブローカーの視点から市場のセンチメントをリアルに洞察する、最初で唯一の出来高インジケーターです。 ブローカーのような機関投資家が外国為替市場でどのようなポジションをとっているか、COTレポートよりもはるかに速く、素晴らしい洞察を提供します。 この情報をチャート上で直接見ることは、あなたの取引にとって真のゲームチェンジャーであり、画期的なソリューションです。 以下のようなユニークなマーケットデータ洞察から利益を得てください。 比率は 、通貨のロングポジションとショートポジションの比率をパーセントで表示します。 比率の変化は 、選択した期間内のロング比率とその変化率を表示します。 Volumes Totalは 、通貨の取引量(ロングとショート)の合計をロット単位で表示します。 Volumes Long :全通貨のロングポジションの取引量を表示します。 Volumes(ショート )は、全通貨のショートポジションの取引量を表示
- Real price is 80$ - 40% Discount ( It is 49$ now ) Contact me for instruction, add group and any questions! Related EA Product: Bitcoin Expert Introduction The breakout and retest strategy is traded support and resistance levels. it involves price breaking through a previous level.  The break and retest strategy is designed to help traders do two main things, the first is to avoid false breakouts. Many false breakouts start with a candlestick that breaks out of a level but ends with an immedi
現在31%オフ! 初心者やエキスパートトレーダーに最適なソリューション! このインジケータは、独自の機能と秘密の数式を組み込んだ、ユニークで高品質かつ手頃な価格のトレーディングツールです。たった1枚のチャートで28の通貨ペアのアラートを表示します。新しいトレンドやスキャルピングチャンスの引き金となるポイントを正確に把握することができるので、あなたのトレードがどのように改善されるか想像してみてください! 新しい基本的なアルゴリズムに基づいて構築されているため、潜在的な取引の特定と確認がより簡単になります。これは、通貨の強さや弱さが加速しているかどうかをグラフィカルに表示し、その加速のスピードを測定するためです。加速すると物事は明らかに速く進みますが、これはFX市場でも同じです。つまり、反対方向に加速している通貨をペアにすれば、利益を生む可能性のある取引を特定することができるのです。 通貨の勢いを示す縦の線と矢印は、あなたの取引の指針となるでしょう。 ダイナミックマーケットフィボナッチ23レベルはアラートトリガーとして使用され、市場の動きに適応します。もしインパルスが黄色
Enigmera
Ivan Stefanov
5 (3)
エニグメラ:市場の中核 https://www.enigmera.com はじめに このインディケータと取引システムは、金融市場に対する驚くべきアプローチです。ENIGMERAは、フラクタルサイクルを使用して、サポートとレジスタンスレベルを正確に計算します。本格的な蓄積局面を示し、方向性と目標を示します。 トレンド中でも調整中でも機能するシステムです。 どのように作動するのか? ENIGMERAは、支持線・抵抗線、目標線、乖離線の3つのラインで構成されています。このシステムは、過去のデータを現在と未来に外挿する典型的な市場指標とは異なり、現在の完全な画像を提供します。支持線上にある場合、それは本当の支持を意味し、抵抗線上にある場合、それは本当の抵抗を意味する。ある水準が破られた場合、それはトレンドの変化を意味する。再描画はしない。 市場は常に進化しているため、ENIGMERAはその評価ツールを適応させ、定期的に戦略を修正しています。  これにより、すべてのシナリオが徹底的に評価されることが保証されます。この市場指標の独自性は、その能力を見れば明らかです。  ENIGM
トレンドカッターは、M1 や M5 などの下位時間枠を含むあらゆる時間枠で使用できるトレンド指標です。このインジケーターは日中取引を好むトレーダーにとって理想的であり、長期取引を好むトレーダーにも役立ちます。このインジケーターは、取引システムの基礎として、またはスタンドアロンの取引ソリューションとして使用できます。 このインジケーターは、PUSH 通知を含むあらゆるタイプのアラートを提供します。 インジケーターの使い方はとても簡単です。信号に従えばいいだけです。また、このインジケーターのすべてのユーザーに、このメソッドをできるだけ効率的に使用するのに役立つ追加のインジケーターも無料で提供します。 取引のヒントと素晴らしいボーナスを入手するには、購入後にご連絡ください。
PRO Renko Systemは、特別にRENKOチャートを取引するために設計された高精度の取引システムです。 これは、様々な取引商品に適用することができる普遍的なシステムです。 システムは効果的に正確な逆転信号へのアクセスを与えるいわゆる市場の騒音を中和する。 表示器は非常に使いやすく、信号の生成に責任がある1つの変数だけがあります。 あなたは簡単にお好みの任意の取引ツールとレンコバーのサイズにツールを適応させることができます。 私はいつもあなたが私のソフトウェアで収益性の高い取引を支援するために余分なサポートを提供する準備ができています! 私はあなたに幸せで収益性の高い取引をしたいです! ご購入後にご連絡ください! 私はあなたに私のレンコチャートジェネレータを送信します。 私はまた、私の個人的な推奨事項やシステムの他のモジュールを無料で共有します!
現在26%オフ 初心者やエキスパートトレーダーに最適なソリューション! このインジケーターは、独自の機能と新しい計算式を取り入れた、ユニークで高品質、かつ手頃な価格のトレーディングツールです。たった1枚のチャートで28の為替ペアの通貨強度を読み取ることができます。新しいトレンドやスキャルピングチャンスの引き金となるポイントを正確に特定することができるので、あなたのトレードがどのように改善されるか想像してみてください。 ユーザーマニュアルはこちら  https://www.mql5.com/en/blogs/post/697384 これが最初の1本、オリジナルだ! 価値のないクローンを買わないでください。 特別な サブウィンドウの矢印で強い通貨の勢いを表示 GAPがあなたのトレードを導く! 基準通貨や気配値が売られすぎ・買われすぎのゾーン(外相フィボナッチレベル)にあるとき、個別チャートのメインウィンドウに警告表示。 通貨がレンジの外側から反落した場合、プルバック/リバーサルのアラート。 クロスパターンの特別なアラート 複数の時間枠を選択可能で、トレンドを素早く
ブレーカートレーダーになり、価格が反転すると市場構造からの利益が変化します。 注文ブロックブレーカーインジケーターは、トレンドまたは価格の動きが枯渇に近づいており、逆転の準備ができていることを識別します。通常、反転または大規模なプルバックが発生しようとしているときに発生する市場構造の変化について警告します。 この指標は、ブレイクアウトと価格の勢いを識別する独自の計算を使用します。使い果たされる可能性のあるポイントの近くで新しい高値が形成されるたびに、インディケーターはその高値の作成を担当する最後の注文ブロックを描きます。次に、移動する価格とともに注文ブロックを追跡します。その後、価格が反対方向にシフトし、その注文ブロックを突破すると、新しい市場構造を作成し、トレンドまたは大きな後退の可能性のある反転の開始を警告します。 注文ブロックは、高値/安値が作成される前の最後の反対色のろうそくであり、価格がこれらの重要な領域を下抜けすると、トレンドの短期的ま​​たは長期的な反転の兆候です。 特徴 重要な枯渇点での市場構造の変化を警告します 価格が使い果たされるレベルに近づくと、
TakePropips Donchian Trend Pro
Eric John Pajarillaga Aldana
4.44 (16)
TakePropips Donchian Trend Pro   (MT4) は、ドンチャン チャネルを使用してトレンドの方向を自動的に検出し、エントリーとエグジットの取引シグナルを提供する強力で効果的なツールです! この多機能インジケーターには、トレンド スキャナー、取引シグナル、統計パネル、スクリーナー、取引セッション、およびアラート履歴ダッシュボードが含まれます。取引シグナルを提供し、チャートを分析する時間を節約するように設計されています! ユーザー マニュアルとインストール ガイドは、ブログ投稿 (   https://www.mql5.com/en/blogs/post/751368   ) からダウンロードできます。 今日は 50% オフ! 98ドルから49ドルに値下げ! このインジケーターは、ストラテジー テスターでテストできます (ビジュアル モードを有効にします)。 詳細については、説明の下にあるビデオ チュートリアルも利用できます。 ご不明な点やサポートが必要な場合は、私に連絡してください。 TakePropips Donchian Trend Pro イン
支持線と抵抗線、そしてローソク足のギャップをチャート上に自動的に表示するため、価格が次に向かう可能性のある場所や反転する可能性のある場所を確認することができます。 このインジケーターは、私のウェブサイト(The Market Structure Trader)で教えているポジショントレード手法の一部として使用するように設計されており、ターゲットとエントリーの可能性のための重要な情報を表示します。 このインジケーターには、2つのコア機能と4つの追加機能があります: コア機能1 - 日足、週足、月足のサポートラインとレジスタンスラインの自動表示 このインジケーターは、直近2日間、最大6週間前、数ヶ月前のサポートレベルとレジスタンスレベルを自動的に引き込みます。これらのレベルの見た目は完全にカスタマイズすることができ、いくつ表示されるかを表示することもできます。これらの重要な水準は、しばしば主要な支持線と抵抗線として機能し、価格が転換して引き戻されたり反転したりする場所です。また、価格が向かうターゲットでもあるため、価格が転換する前に、取引に利用できる潜在的な距離を素早く確認するこ
通貨強さウィザードは、取引を成功させるためのオールインワン ソリューションを提供する非常に強力な指標です。このインジケーターは、複数の時間枠のすべての通貨のデータを使用して、このまたはその外国為替ペアのパワーを計算します。このデータは、使いやすい通貨インデックスと通貨パワーラインの形式で表され、特定の通貨のパワーを確認するために使用できます。 必要なのは、取引したいチャートにインジケーターを接続することだけです。インジケーターは、取引する通貨の実際の強さを示します。このインジケーターは、トレンドに合わせて取引するときに有利に利用できる売買高の圧力の極値も示します。このインジケーターには、フィボナッチに基づく可能なターゲットも表示されます。 このインジケーターは、PUSH 通知を含むあらゆるタイプのアラートを提供します。 購入後ご連絡下さい。私の取引のヒントをあなたと共有し、素晴らしいボーナスインジケーターを無料で提供します! 幸せで有益な取引をお祈りします。
IX Powerは 、FX Powerの無敵の精度をついにFX以外のシンボルにも提供します。 お気に入りの指数、株式、コモディティ、ETF、さらには暗号通貨の短期、中期、長期のトレンドの強さを正確に判断します。 お使いの端末が提供する すべてを分析する ことができます。ぜひお試しいただき、取引 タイミングが大幅に改善 されることをご体験ください。 IXパワーの主な特徴 100%正確で再描画されない計算結果 - ターミナルで利用可能なすべての取引シンボルに対して 予め設定され、さらに個別に設定可能な強度分析期間のドロップダウン選択 Eメール、メッセージ、モバイル通知による無数の通知オプション EAリクエストのためのアクセス可能なバッファ カスタマイズ可能な計算制限により、さらに優れたパフォーマンスを実現 もっと見たい人のための特別なマルチインスタンス設定 すべてのチャートでお好みの色を無限に設定可能 Windows 11とmacOSのスタイルで角を丸くした新しいパネルデザイン サブ・ウィンドウとメイン・チャートの間をシームレスに移動する、魔法のように動く
ADR反転インジケーターは、通常の1日の平均レンジに関連して価格が現在取引されている場所を一目で示します。価格が選択した平均範囲とレベルを超えると、ポップアップ、電子メール、またはプッシュを介して即座にアラートを受け取るため、プルバックと逆転にすばやくジャンプできます。インディケータは、チャート上に1日の平均レンジの極値で水平線を描画し、それらを超える価格の数学的確率が付加されているレベルを超える延長も描画します。詳細については、以下をご覧ください... インジケーターとモニターを補完するADRアラートダッシュボードここでも利用可能なすべてのペア:https:// www.mql5.com/en/market/product/62756 MT5バージョンはこちらからも入手できます:https:// www.mql5.com/en/market/product/64477/ 通常の1日平均レンジ(ADR)内で価格が取引され、これらのレベルを上回っている時間の約60%は、通常、その後の引き戻し(利益確定)の動きを伴う急激な価格の動きの指標です。毎日の範囲の上部または下部からの
Please contact me after purchase to immediately get your PDF strategy + documentation for Trend Pulse !  Introducing Trend Pulse , a unique and robust indicator capable of detecting bullish, bearish, and even ranging trends! Trend Pulse uses a special algorithm to filter out market noise with real precision. If the current symbol is moving sideways, Trend Pulse will send you a ranging signal, letting you know that it's not a good time to enter a trade. This excellent system makes Trend Pulse
RSI / TDIアラートダッシュボードを使用すると、取引するすべての主要ペアでRSIを一度に(ユーザーが選択可能に)監視できます。 次の2つの方法で使用できます。 1.複数の時間枠を選択すると、通常の取引条件を超えて延長された複数の時間枠がある場合にダッシュが表示されます。複数の時間枠にわたって買われ過ぎまたは売られ過ぎのレベルを達成したため、価格が最近激しく押し上げられたため、引き戻しまたは逆転が間もなく行われることを示す優れた指標です。 2. 1つの時間枠(トレードするのが好き)と複数のRSIレベルを使用して、その時間枠でのRSIの延長の強さを示します。これは、価格が一方向に非常に長く押し込まれ、市場が利益を得ることになっている場合に、平均回帰取引を行うための優れた戦略です。スクリーンショットの例では、H4 RSIが25レベルを超えて2ペアで拡張されていることがわかります。これは、通常の価格アクションよりもはるかに遠いため、長く行く良い機会です。 ダッシュボードは、選択した時間枠でろうそくが閉じたときに、選択したレベルでの延長された状態(買われ過ぎと売られ過
Stratos Pali Indicator   is a revolutionary tool designed to enhance your trading strategy by accurately identifying market trends. This sophisticated indicator uses a unique algorithm to generate a complete histogram, which records when the trend is Long or Short. When a trend reversal occurs, an arrow appears, indicating the new direction of the trend. Important Information Revealed Leave a review and contact me via mql5 message to receive My Top 5 set files for Stratos Pali at no cost! D
Gold Channel is a volatility-based indicator, developed with a specific timing algorithm for the XAUUSD pair, which consists of finding possible corrections in the market. This indicator shows two outer lines, an inner line (retracement line) and an arrow sign, where the theory of the channel is to help identify overbought and oversold conditions in the market. The market price will generally fall between the boundaries of the channel. If prices touch or move outside the channel it is a tra
M1 Arrow
Oleg Rodin
4.73 (15)
市場の2つの基本原則に基づく日中戦略。 このアルゴリズムは、追加のフィルターを使用したボリュームと価格の波の分析に基づいています。インディケータのインテリジェントアルゴリズムは、2つの市場要因が1つに結合した場合にのみシグナルを出します。インディケータは、より高い時間枠のデータを使用して、M1チャート上の特定の範囲の波を計算します。そして波を確認するために、インジケーターはボリュームによる分析を使用します。 このインディケータはレディトレーディングシステムです。トレーダーが必要とするのは、信号に従うことだけです。また、インジケーターはあなた自身の取引システムの基礎になることができます。取引はミニッツチャートでのみ行われます。 インジケーターがMTFの原則を使用しているという事実にもかかわらず、インジケーターのアルゴリズムは可能な限り安定しています。 購入後、必ず私に書いてください!私の取引設定と推奨事項をあなたと共有します!
Bomb Bank Signal
Igor Pereira Calil
5 (1)
Bomb Bank シグナル: MetaTrader 4 の信頼度インジケーター Bomb Bank Signal は、金融市場で最も関連性の高いトレンドを特定するように設計された MetaTrader 4 の強力なインジケーターです。動きを正確に予測するツールをお探しなら、Bomb Bank が最適です。 仕組み: このインジケーターは、出来高分析、ローソク足終値、対称トレンドという 3 つの異なる方法を組み合わせて、売買の機会を検出してシグナルを送ります。 Bomb Bank は、買いの機会を特定するときは「爆弾」のようなものであり、売りシグナルを検出するときは「ドクロ」のようなものです。 ボムバンクはなぜ違うのですか? 完全な信頼性: Bomb Bank Signal は信号を削除しません。一度シグナルが発せられると、シグナルは残り続けるので、チャンスを逃すことはありません。 極めて高い精度: Bomb Bank は誤った信号を送信しません。リアルタイムで最新情報を更新し、市場の進化に合わせて調整しながら、以前のシグナルの透明性を維持します。 ライブアップデ
Advanced Supply Demand
Bernhard Schweigert
4.91 (294)
現在33%オフ 初心者にもエキスパートトレーダーにも最適なソリューション このインジケーターは独自の機能と新しい公式を多数内蔵しており、ユニークで高品質かつ手頃な取引ツールです。このアップデートでは、2つの時間枠ゾーンを表示できるようになります。より長いTFだけでなく、チャートTFとより長いTF(ネストゾーンを表示)の両方を表示できます。すべてのSupply Demandトレーダーの皆さんのお気に召すはずです。:) 重要情報の公開 Advanced Supply Demandの可能性を最大化するには、 https://www.mql5.com/ja/blogs/post/720245 にアクセスしてください。   エントリーまたはターゲットの正確なトリガーポイントを正確に特定できれば取引がどのように改善されるか想像してみてください。新しい基盤となるアルゴリズムに基づいて構築されているため、買い手と売り手の間の潜在的な不均衡をさらに簡単に特定できます。これは、最も強い需要と供給のゾーンと、過去のパフォーマンス(古いゾーンを表示)がグラフィカルに表現されるためです。これらの機能は、最適
作者のその他のプロダクト
The tool is used to calculate the size of the position that can be opened with the previously assumed risk. The risk can be defined as: percentage value of the account (%), nominal value, expressed in the account currency. The size of position is determined by the distance of the planned SL (red line). Input Parameters Lost_in_Money - if true, the value of the acceptable loss is determined by the parameter "Acceptable_loss", else acceptable loss is determined by the parameter "Acceptable_Risk_
This scanner is a tool used to support trading with the Ichimoku method. Its basic features are: 10 trading setups implemented in accordance with the Ichimoku technique, the possibility of simultaneous scanning, all financial instruments available on the platform, the possibility of simultaneous scanning, in all timeframes available on the platform, two trading modes available: Manual and AutoTrading, the ability to open in Manual mode from the level of the chart, the ability to determine the si
It is a tool for technical analysis. It allows you to make measurements: Fibo, including the search for clusters Fibo levels (by the DiNapoli method) Overbalance Trend line Selecting S/D levels Input parameters Trend_Color - color of the trend line Trend_Width - width of the trend line Trend_info - if true, along with the trend line additional information is displayed (low, high, medium of the trend line) Trend_info_color_up_dn - color of the text describing the trend line Trend_info_font_up_d
Indicator enabling the analysis of the relationship between two derivatives. There are different methods of presentation relationship. The attached video shows all the functionality of the indicator. Input parameters Anchor_mode - sets the end of the measurement to the current candle. Follow_mode - if true, the beginning of the measurement (START line) follows a fixed distance after its end (END line). Follow_distance - distance, (in candles) between the beginning and the end of the measuremen
This scanner is a tool used to support trading. Scanner searches on a wide market, in real time setups, created by mutual arrangements of candles (candles pattern). Its basic features are:  8 implemented trading setups (it is possible to add further setups, additional versions of the scanner),  the possibility of simultaneous scanning, all financial instruments available on the platform,  the possibility of simultaneous scanning, in all timeframes available on the platform,  the ability to manua
This is a script used for placing pending orders. However, this does not create a trivial grid of orders, but a little "thinks and counts" ;) The general idea that guided me when writing this script is the concept of playing the demand and supply zones by setting pending "limits", but with a predetermined level of risk that I accept. Operating principles: - put a rectangle on the graph, which is supposed to reflect the "zone" we are going to play, - drag the Pending_Orders_1v6_Rectangle script t
Piramid Machine is a tool supporting manual trading, allowing for a radical increase in profits. Principle of operation: The trader must open the first position himself. In the "Auto_size_position" mode, the robot will determine the size of the item based on the assumed risk risk "Risk_perc" and the automatically set SL level. The SL level is defined as: for position "BUY" = Lowest - V_BE_buffer, The Lowest level is defined as the lowest level of the candle number "V_BE_candles_back". for the
Piramid Machine is a tool supporting manual trading, allowing for a radical increase in profits. Principle of operation: The trader must open the first position himself. In the "Auto_size_position" mode, the robot will determine the size of the item based on the assumed risk risk "Risk_perc" and the automatically set SL level. The SL level is defined as: If you do not use the red "colored pencil" (shown in the movie), then SL is set at the Kijun or Tenkan level - depending on the choice. The siz
This scanner is a tool used to support trading with the Ichimoku method. Its basic features are: 10 trading setups implemented in accordance with the Ichimoku technique, the possibility of simultaneous scanning, all financial instruments available on the platform, the possibility of simultaneous scanning, in all timeframes available on the platform, available Manual and Auto trade , the ability to open in Manual mode from the level of the chart, the ability to determine the size of the position
Candles Pattern Scanner EA This scanner is a tool used to support trading. Scanner searches on a wide market, in real time setups, created by mutual arrangements of candles (candles pattern). Its basic features are:  8 implemented trading setups (it is possible to add further setups, additional versions of the scanner),  the possibility of simultaneous scanning, all financial instruments available on the platform,  the possibility of simultaneous scanning, in all timeframes available on the pl
フィルタ:
レビューなし
レビューに返信