Better Period Separators MT5
- インディケータ
- バージョン: 1.1
- アップデート済み: 21 3月 2025

Better Period Separators For MetaTrader 5
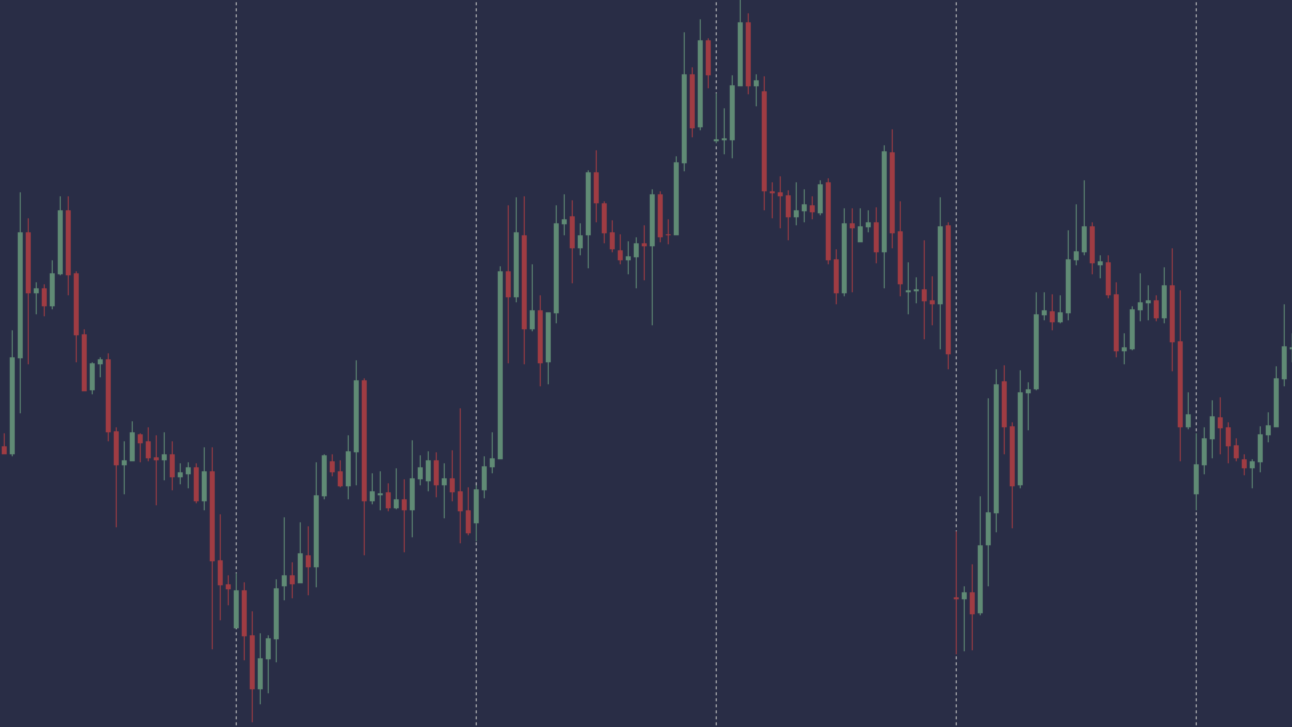
The built-in period separators feature doesn’t allow users to specify the time period, so you can use this indicator to create more customizable period separators.
On intraday charts, you could place period separators at a specific time, you could also place extra period separators at a specific time on Monday to mark the start of a week.
On higher timeframe charts, this indicator works the same as the built-in period separators,
On the daily chart, period separators are placed at the start day of every month.
On the weekly and monthly charts, period separators are placed at the start day of every year.
Inputs
Period Separator Settings
- hour of the separator
- minute of the separator
Weekly Separator Settings
- hour of the separator
- minute of the separator
If you need the more advanced period separators indicator, please check out the pro version:


Exactly what I'm looking for, now I'm able to see the yearly period separator in monthly timeframe, thank you so much!