PipHistogram
- インディケータ
-
Carlos Andrés Moya Erazo
 I am an Electronic Engineer specializing in Automation and Control with 15 years of experience, a multi-platform and multi-language programmer for over 20 years, and an enthusiastic trader since 2018. Throughout my career, I have combined my expertise in efficient process automation, intelligent
 - バージョン: 1.0
- アクティベーション: 12
PipHistogram is an essential tool for traders who want to gain insight into price distribution and concentration. Its customizable, visually appealing histogram allows you to pinpoint key levels and make more informed trading decisions. Enhance your market analysis and improve your trading strategy with PipHistogram —your shortcut to understanding price dynamics in MetaTrader 5.
Overview:
PipHistogram is a powerful indicator for MetaTrader 5 that visually displays the percentage distribution of a symbol’s key price levels—open, close, high, and low—over a customizable number of candles. By grouping these values into bins of a specified pip range, PipHistogram helps traders quickly identify price concentration areas, key support/resistance levels, and overall market behavior in a clear, easy-to-read histogram format.
How It Works:
-
Data Collection:
PipHistogram analyzes the last X candles (where X is user-defined via the input parameter BarsBack) and extracts the open, high, low, and close prices from each candle. -
Bin Grouping:
The indicator groups the collected prices into bins of N pips, with N being set by the BinSizePips parameter. This allows you to view the frequency distribution of price levels within specified pip intervals. -
Percentage Calculation:
It calculates the percentage of occurrences for each bin relative to the total number of price points analyzed. This percentage is then used to determine the visual length of the histogram bars. -
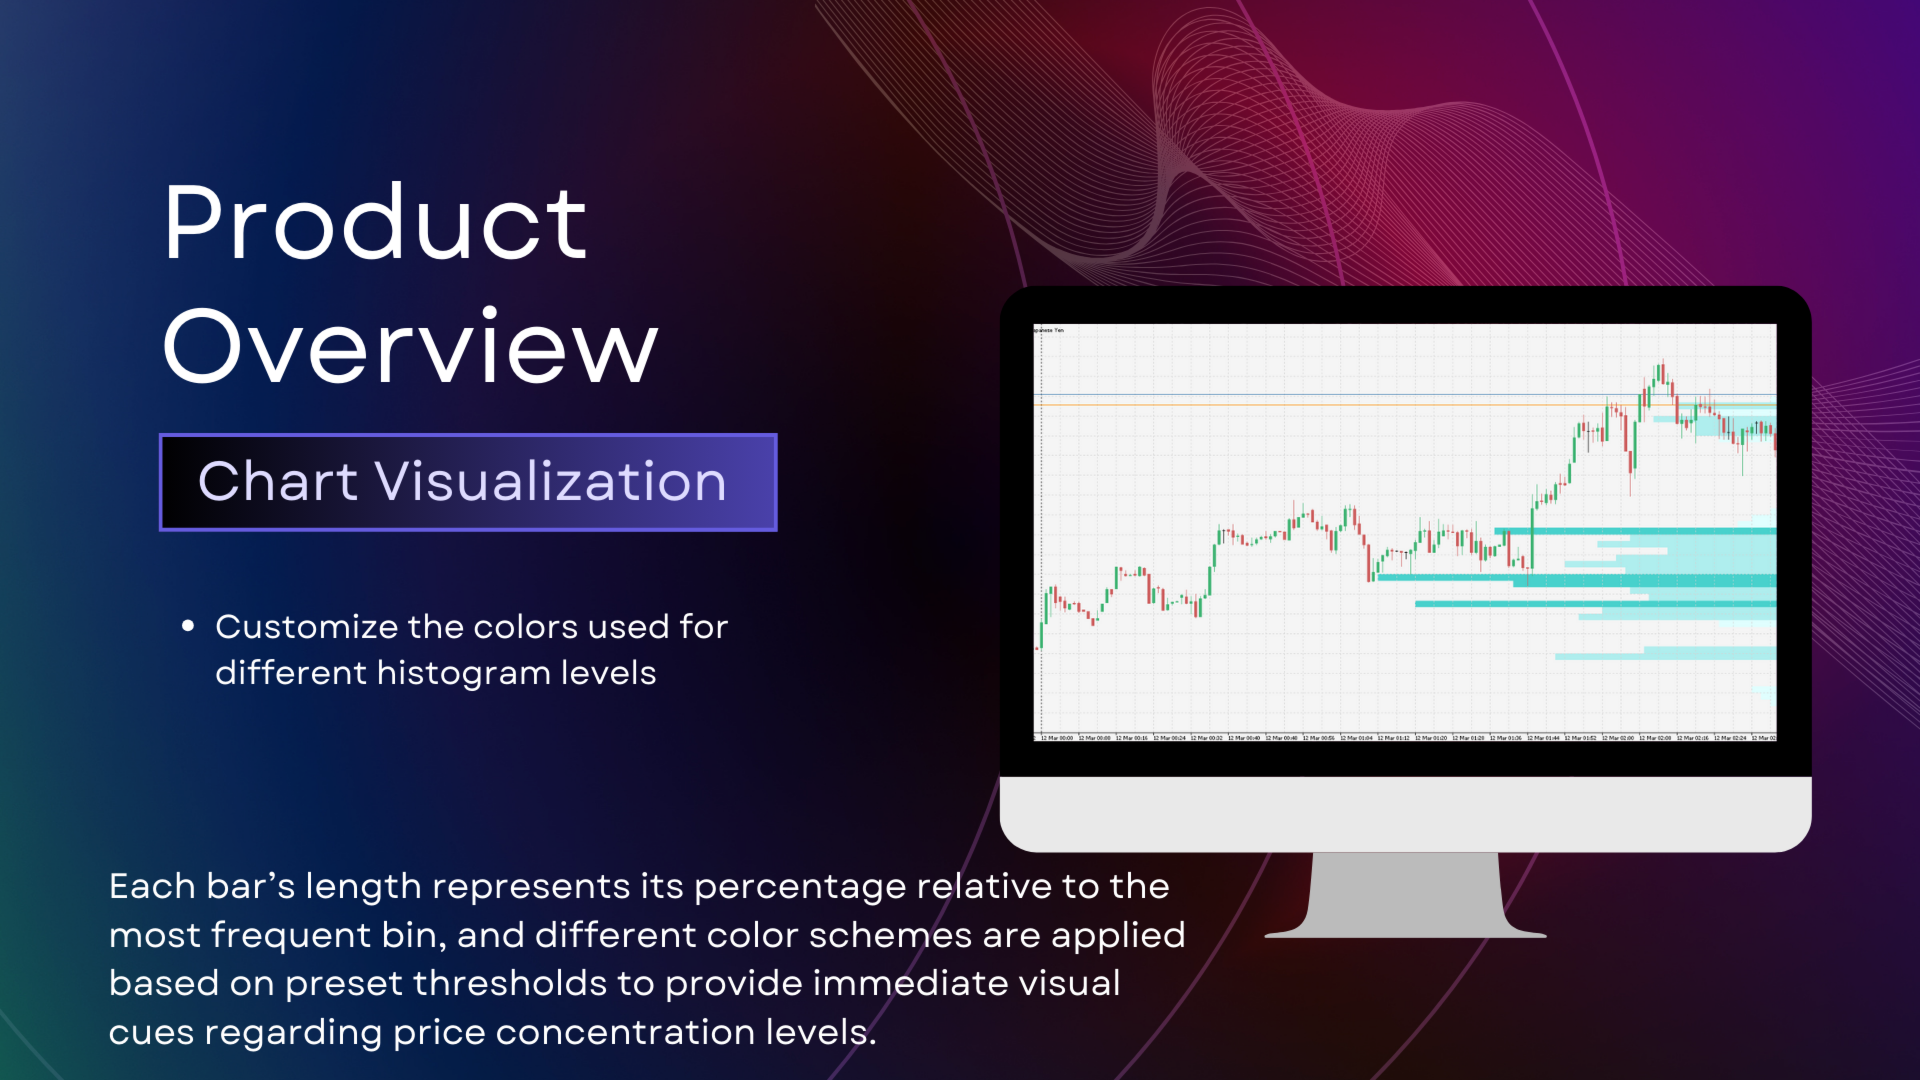
Visual Display:
PipHistogram draws a histogram on your chart—positioned conveniently, typically at the top right. Each bar’s length represents its percentage relative to the most frequent bin, and different color schemes are applied based on preset thresholds to provide immediate visual cues regarding price concentration levels. -
Adaptive Time Factor:
The indicator adapts to the current chart period using a predefined time factor, ensuring that the histogram scales appropriately with the timeframe you are analyzing.
Key Features and Benefits:
-
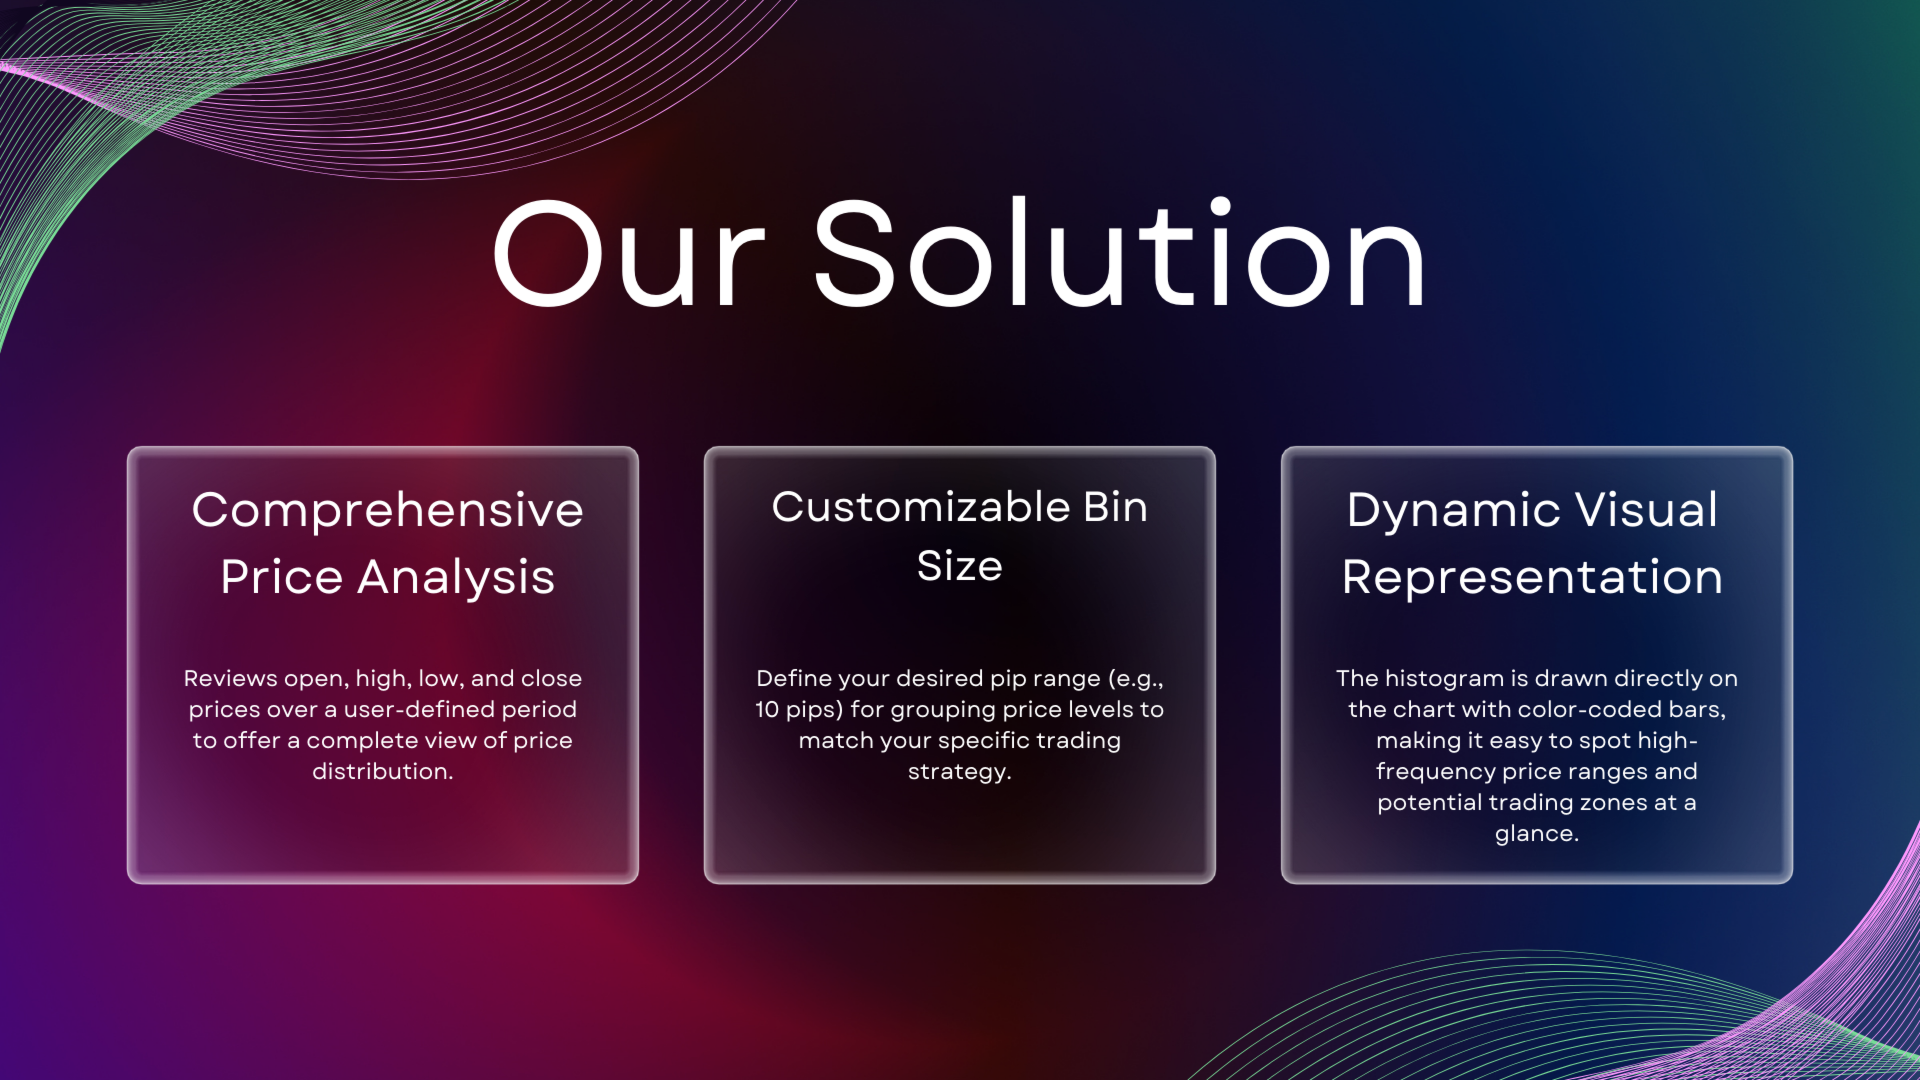
Comprehensive Price Analysis:
Reviews open, high, low, and close prices over a user-defined period to offer a complete view of price distribution. -
Customizable Bin Size:
Define your desired pip range (e.g., 10 pips) for grouping price levels to match your specific trading strategy. -
Dynamic Visual Representation:
The histogram is drawn directly on the chart with color-coded bars, making it easy to spot high-frequency price ranges and potential trading zones at a glance. -
User-Friendly Interface:
With a simplified setup and clearly labeled input parameters, PipHistogram eliminates the need for complex configurations, allowing you to focus on analysis and decision-making. -
Optimized for MetaTrader 5:
Developed with best practices in MQL5, PipHistogram is lightweight, efficient, and fully compatible with MetaTrader 5’s environment.
How to Get Started:
-
Installation:
- Download the PipHistogram indicator file and place it in the “Indicators” folder of your MetaTrader 5 terminal.
- Open MetaEditor and compile the indicator to ensure it is error-free.
-
Attaching to a Chart:
- Open the desired chart in MetaTrader 5.
- Drag and drop PipHistogram onto the chart. The indicator will automatically analyze the most recent candles and display the histogram.
-
Configuration:
- Adjust the input parameters:
- BarsBack: Set the number of candles to analyze (default is 500).
- BinSizePips: Define the pip range for grouping (default is 10 pips).
- DisplayWidth: Specify the maximum width (in bars) for the histogram, representing the highest frequency (default is 100).
- Color1, Color2, Color3: Customize the colors used for different histogram levels.
- Confirm your settings and click “OK” to apply the indicator.
- Adjust the input parameters:
Input Parameters:
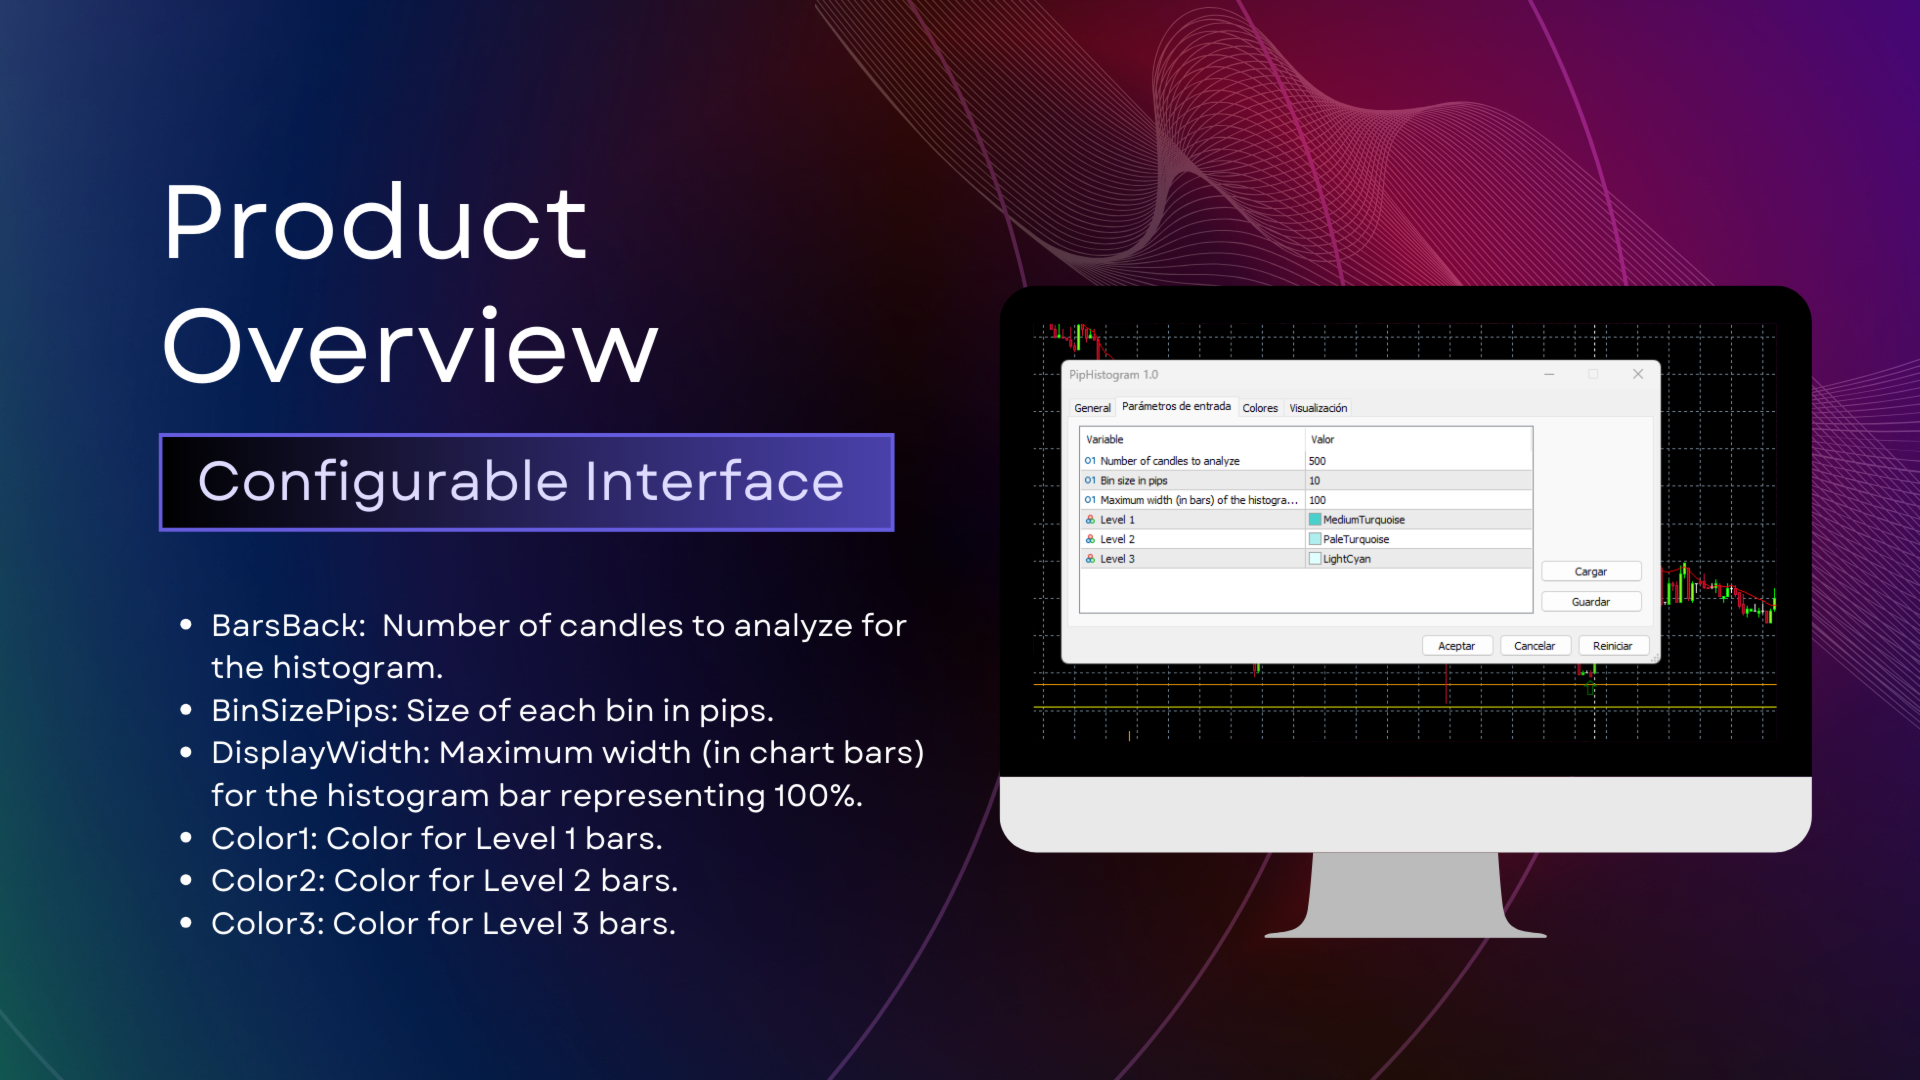
- BarsBack (int):
Number of candles to analyze for the histogram. - BinSizePips (int):
Size of each bin in pips. - DisplayWidth (int):
Maximum width (in chart bars) for the histogram bar representing 100%. - Color1 (color):
Color for Level 1 bars. - Color2 (color):
Color for Level 2 bars. - Color3 (color):
Color for Level 3 bars.
Technical Support and Contact:
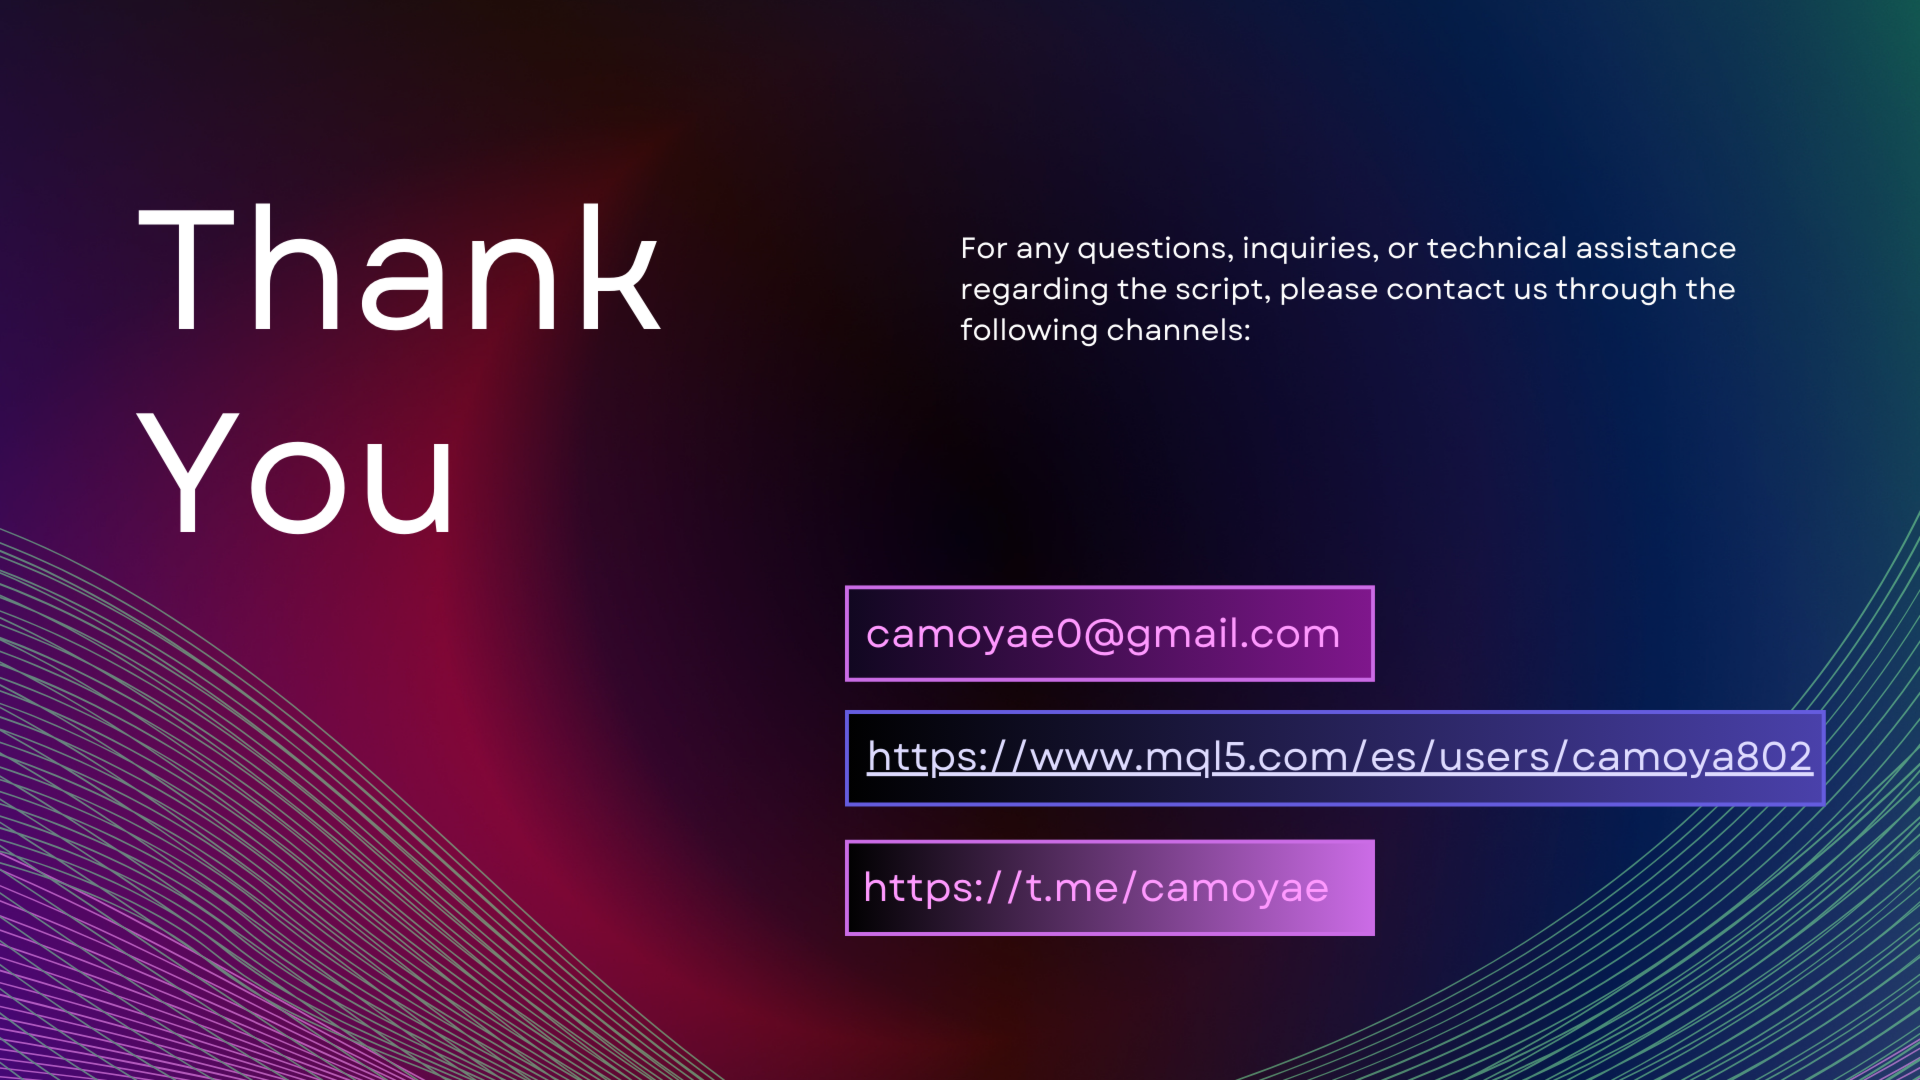
For any questions, further assistance, or technical support regarding PipHistogram, please contact us through the following channels:
- Email: camoyae0@gmail.com
- Support Forum: https://www.mql5.com/es/users/camoya802
- Live Chat: Available on our telegram for real-time support.
Our dedicated support team is committed to ensuring you have a smooth experience with PipHistogram, helping you optimize your trading analysis effortlessly.
For more info click link