MACDmaxmin

3

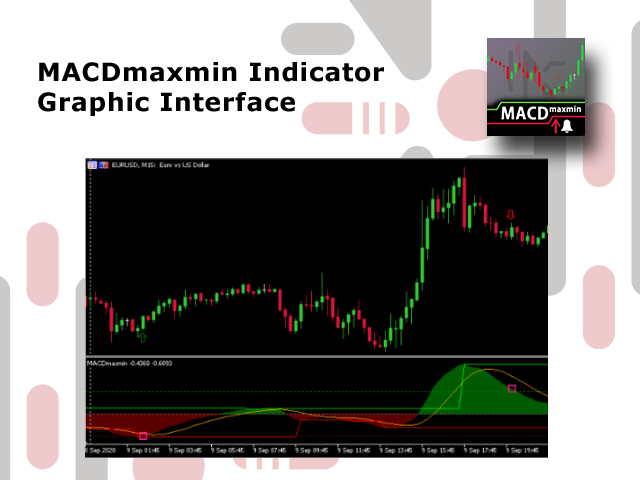
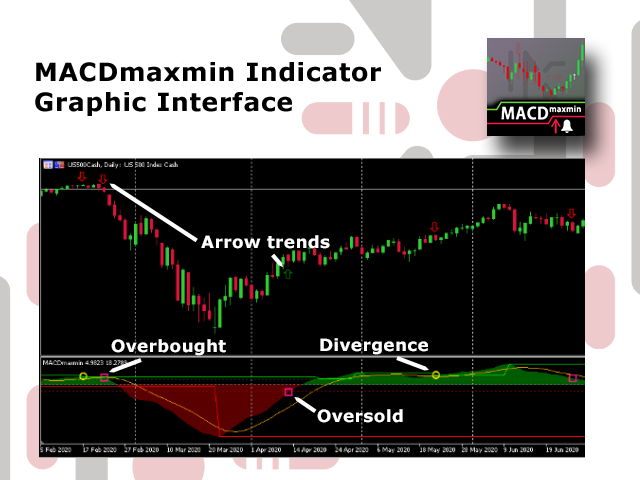
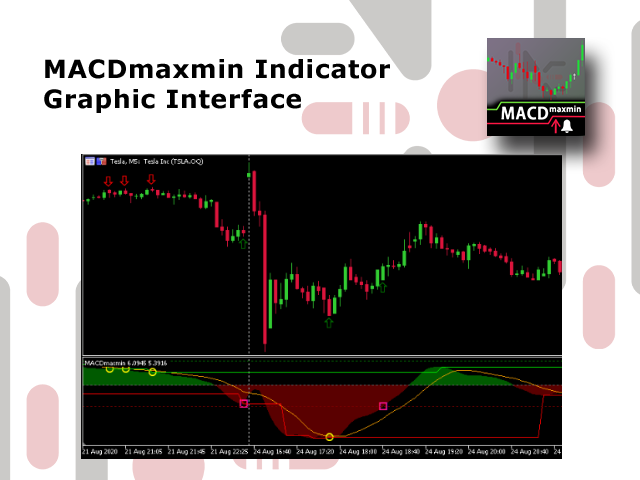
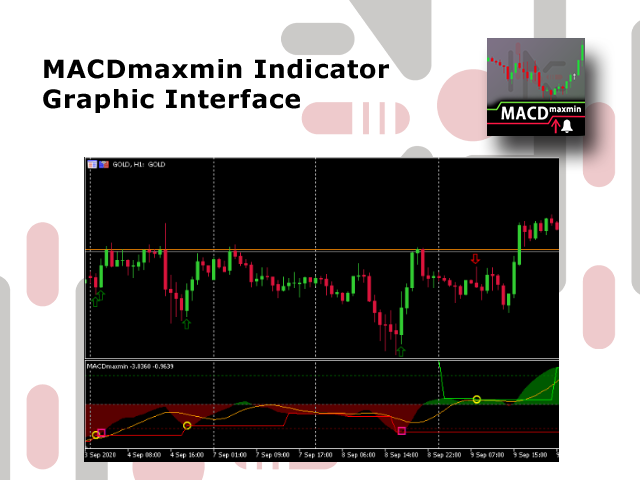
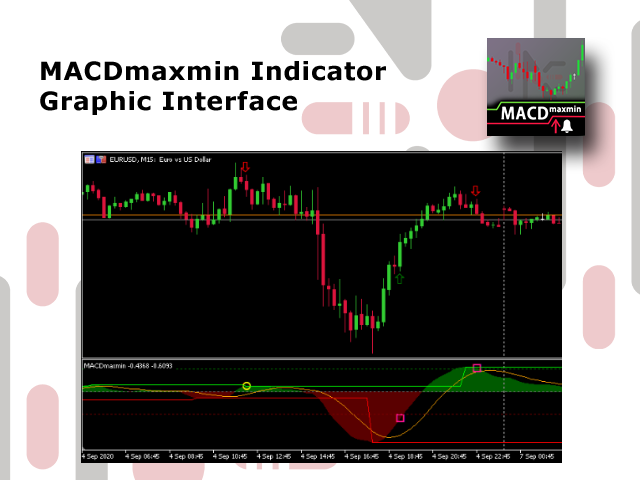
The indicator shows when there are overpricing and divergences over a normalized MACD

Plus, it displays signals with configurable alerts, self-regulating dynamic overprice levels, and a simple setup and interface.

The indicator that automatically calculates overprices ranges!
MACDmaxmin is an indicator based on the MACD oscillator that effectively identifies trend changes in price, as it is a momentum indicator that captures the trend and shows the relationship between two moving averages of the price.

MACDmaxmin provides valuable market information and signals of overpricing, and divergences that it detects automatically. These signals are represented in the oscillator as circles for the divergence points and squares for the overprices points. You can immediately receive configurable alerts for these signals.


Furthermore, this indicator has two unique characteristics


It graphs dynamic support and resistance levels that it automatically calculates according to the market to which it has been applied and the input parameters conveniently configured by the trader. Overbought and oversold levels are also automatically calculated for each chart optimizing the results.

The second uniqueness of MACDmaxmin is that it presents normalized values ​​on a scale of -100 to 100 to get a global idea about the real movement of the market.

MACDmaxmin features

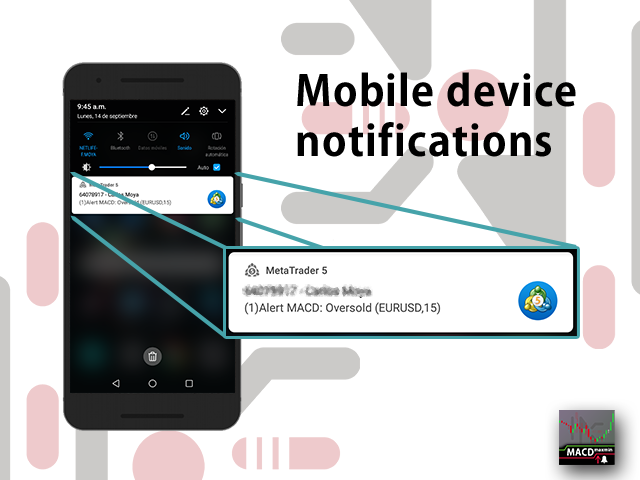
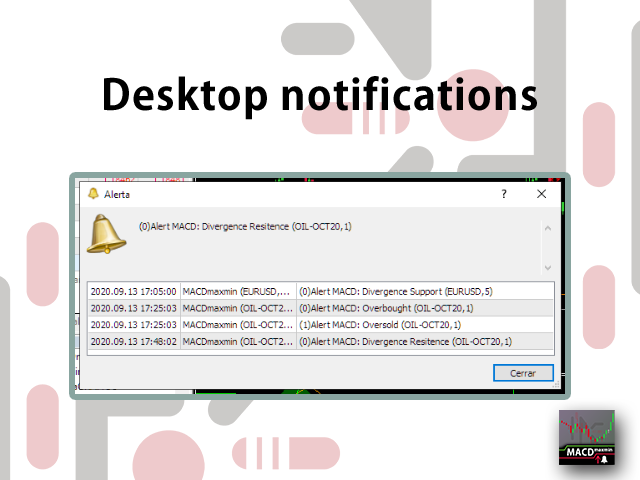
  • The indicator allows to generate alerts in different configurations (mobile application - Push, email, desktop application) when divergences and overpricing are detected
  • Alerts can be repeated for the same event to guarantee or to recognize the MACDmaxmin indicator
  • The indicator simplifies the parameters to the maximum, to avoid the trader complex configurations
  • The indicator is valid for any asset and any time horizon
  • It can be used in strategies based solely on this indicator or it can be combined with other indicators
  • You can configure the color of the indicator trend lines.
  • Optimized and tested algorithm to ensure it is always in service
Understands:
  • A positive and a negative area that represents the MACD movement
  • Oscillating line as a signal of trend strength
  • 2 lines of dynamic levels of supports and resistances in the oscillator signal
  • Two lines of dynamic levels, resist and support

MACDmaxmin Indicator Parameters

  • Fast MACD Period candlestick period used to calculate the fast moving average of the MACD oscillator
  • Slow MACD Period candlestick period used to calculate the slow moving average of the MACD oscillator
  • Signal Period period used to calculate the MACD signal
  • Tolerance value used as a condition to accept a peak as a new maximum or minimum
  • Kind price calculation can use all forms of price calculation including HL / 2, HLC / 3 and HLCC / 4
  • View divergence (circle) display circles in the oscillator at the points where divergences occurred
  • View overprice (square) display in the oscillator squares at the points where overpricing is detected
  • View trend in chart (arrow) see in the candlestick chart an arrow indicating the possible trend according to the oscillator RSImaxmin
  • View support and resist levels view support and resistance calculated automatically
  • Alert Settings allows you to choose the alerts you want to receive regarding the indicator. These can be:
    • alerts_off
    • maxmin_Divergences
    • max_Divergences
    • min_Divergences
    • overbought
    • oversold
    • overbought_sold
    • all_alerts
  • Alert Kind are the options that the program allows to notify you of an event. These can be:
    • Mobile (you must have this option activated on your MT5 platform)
    • Email (you must configure your MT5 platform to receive emails)
    • Desktop
    • Alls
  • Alert repetition per event is the number of times an alert can be repeated for the same event. You can repeat an alarm 1, 3, 5, and 10 times as needed
If you have any questions or suggestions you can contact me using the following link


レビュー 2
JJair
79
JJair 2022.06.27 18:39 
 

Ótimo indicador, recomendo.

おすすめのプロダクト
このインジケーターは実践的なトレードに最適な自動波動分析のインジケーターです! 場合... 注:   Tang Lun (Tang Zhong Shuo Zen) の命名規則の影響で、私は波のグレーディングに西洋の名前を使用することに慣れていません。基本的な波を ペン 、二次波のバンドを セグメント と名付けました。同時に、 セグメント にはトレンドの方向が指定されます (この命名方法は将来のノートで使用されます。最初に言っておきます)。ただし、アルゴリズムは曲がりくねった理論とはほとんど関係がないため、付けるべきではありません。これは、私の市場分析 によって要約された、絶えず変化する複雑な運用ルール を反映しています。 バンドは標準化され、人によって異なることがないよう定義されており、市場参入を厳密に分析する上で重要な役割を果たす人為的な干渉の描画方法が排除されています。 このインジケーターを使用することは、取引インターフェイスの美しさを改善することと同等であり、元の K ライン取引を放棄し、取引の新しいレベルに連れて行きます。また、宣伝の観点から顧客の認識も向上します。 イ
Product Name: FXmans Pro SMC Structure Description: Navigate the markets with institutional precision. FXmans Pro SMC Structure is an advanced, algorithmically optimized indicator designed to decode Smart Money Concepts (SMC) directly on your chart. Built on a highly secure and lightweight engine, this tool avoids the lag of standard pivot points by utilizing Bill Williams' Fractal logic for laser-accurate market structure mapping. Whether you are a day trader or a swing trader, this indicator f
Develop this indicator for periods of 30 minutes or more, focus on getting market trends right and making sure they are met. MFOP v8.1 gets straight to the point: it scans the market and tells you exactly when there is enough strength to enter a trade. This indicator doesn't do magic, it uses mathematical algorithms to filter out market noise, not enter into false breakouts and show you clear BUY (blue arrow) and SELL (red arrow) opportunities. It is designed and optimized specifically to take
KT Psar Arrows MT5
KEENBASE SOFTWARE SOLUTIONS
5 (1)
KT Psar Arrowsは、標準のパラボリックSARインジケーターを使用してチャート上に矢印をプロットします。ローソク足の高値がSARにタッチしたときに上向き矢印が表示され、安値がSARにタッチしたときに下向き矢印が表示されます。シグナルはリアルタイムで生成され、バーの確定を待つ必要はありません。  特徴 パラボリックSARインジケーターを活用した取引戦略を試したいトレーダーにとって有用なツールです。  市場の転換ポイントを見つけるために使用できます。 カスタムPSAR入力が可能です。 MT4のすべてのアラート機能に対応しています。 注意事項:パラボリックSARは遅延型かつ厳密な機械的インジケーターです。すべての取引シグナルは、明確に定義されたルールでフィルタリングする必要があります。     入力パラメーター PSARステップ値:ステップ値を入力します。 PSAR最大値:最大値を入力します。 PSARドット表示:PSARドットを表示/非表示にします。PSARドットがなくても矢印は正常に機能します。 その他の入力項目は直感的に理解できます。
Send me a message so I can send you the setfile 複数の構成が可能な堅牢なロボット 以下のスクリーンショットの設定を使用して、10 分間の時間枠で BTC を使用します。 エキスパート ロボットを購入すると、ボットを継続的に改善するために変更を要求する権利があります。 主な特徴 移動平均クロスオーバー戦略: EA は 2 つの移動平均 (MA1 と MA2) を使用して取引シグナルを生成します。 より速い MA (MA1) がより遅い MA (MA2) より上または下にクロスオーバーすると、取引がトリガーされます。 マーチンゲール戦略: 取引で損失が発生した場合、次の取引のロット サイズは乗数 (martingaleMultiplier) によって増加されます。 マーチンゲール シーケンスは、トレードが成功した後、またはマーチンゲール ステップの最大数 (maxMartingale) に達したときにリセットされます。 リスク管理: ストップロス(SL)とテイクプロフィット(TP)のレベルは設定可能です。 利益を確定し
Veltrion Smart Fibonacci   is a clean automatic Fibonacci structure overlay for MetaTrader 5. It automatically detects recent swing highs and swing lows, then draws key Fibonacci retracement levels directly on the chart. The indicator is designed to help traders visualize market structure, retracement zones, and the golden zone without manually drawing Fibonacci tools. Key Features Automatic swing high and swing low detection Clean Fibonacci retracement overlay Horizontal Fibonacci levels for a
KT Knoxville Divergenceは、相対力指数(RSI)とモメンタムオシレーターを巧みに組み合わせることで、金融商品のユニークな価格ダイバージェンスを明らかにする強力なツールです。このインジケーターは、市場の微妙な動きを効果的に捉え、トレーダーがより高い精度で有望な取引機会を特定するのに役立ちます。 Knoxville Divergenceは、Rob Bookerによって開発された取引手法の一種です。取引におけるダイバージェンスとは、資産価格の動きとテクニカル指標(オシレーター)が反対方向に動く現象を指します。このズレは、現在の価格トレンドが弱まっており、反転する可能性があることを示すシグナルとなる場合があります。 これは、最適なエントリーおよびエグジットポイントを探しているトレーダーにとって非常に有用です。インジケーターは、これらのダイバージェンスが発生した際に、価格チャート上に視覚的なシグナルを表示します。 Knoxville Divergenceの理解 Knoxville Divergenceは、トレンドに逆らう取引や、長期トレンドに沿う前に小さな押し目や戻りを
The indicator helps to enter a trade following the trend, at the same time, after some correction. It finds strong trending movements of a currency pair on a given number of bars, and also finds correction levels to this trend. If the trend is strong enough, and the correction becomes equal to the one specified in the parameters, then the indicator signals this. You can set different correction values, 38, 50 and 62 (Fibonacci levels) are better. In addition, you can set the minimum trend lengt
このマルチタイムフレームとマルチシンボルインジケーターは、ダブルトップ/ボトム、ヘッド&ショルダー、ペナント/トライアングル、フラグパターンを識別します。ネックライン/トライアングル/旗竿のブレイクアウトが発生した場合にのみアラートを設定することもできます(ネックラインブレイクアウト=上下および頭と肩の確認された信号)。     インジケーターはシングルチャートモードでも使用できます。このオプションの詳細については、製品の     ブログ 。独自のルールとテクニックを組み合わせることで、このインジケーターを使用して、独自の強力なシステムを作成(または強化)できます。 特徴 マーケットウォッチウィンドウに表示されているすべてのシンボルを同時に監視できます。インジケーターを1つのチャートに適用し、市場全体を即座に監視します。 M1からMNまでのすべての時間枠を監視でき、パターンが識別されたとき、またはブレイクアウト時にリアルタイムのアラートを送信します。すべてのMetatraderネイティブアラートタイプがサポートされています。 RSIをトレンドフィルターとして使用して、潜在的な反転を適
Liquidity Map  Overview The Liquidity Map indicator is an advanced visualization tool based on ICT Smart Money Concepts . It automatically identifies daily Buy Zones , Sell Zones , and Liquidity Levels , showing where price is likely to reverse or continue based on institutional order flow. It calculates key levels from the daily session — such as the previous day’s high, low, and midpoint — then derives a premium (sell bias) and discount (buy bias) structure. When price trades into these mapped
Introduction to Fractal Pattern Scanner Fractal Indicator refers to the technical indicator that makes use of the fractal geometry found in the financial market. Fractal Pattern Scanner is the advanced Fractal Indicator that brings the latest trading technology after the extensive research and development work in the fractal geometry in the financial market. The most important feature in Fractal Pattern Scanner is the ability to measure the turning point probability as well as the trend probabil
MTF Connecting Fractals Multi-Timeframe Market Structure. One Glance. Real Decisions. MTF Connecting Fractals is not just another arrow-printing indicator. It’s a complete multi-timeframe market structure intelligence system designed to answer the most important trading questions in real time - clearly, visually, and without clutter. Built around fractals as objective structure anchors, this tool gives traders a decisive edge by combining price action, structural context, proximity risk, and
KT DMA is a modified and advanced version of the classic Displaced Moving Averages with buy/sell crossover alerts and a Multi-Timeframe scanner that shows DMA's direction across each real-time time frame. A Displaced Moving Average is a simple moving average that moves ahead or backward in a time frame (either short-term or long-term). It also allows you to predict price movement more accurately. Features Depicts the trend direction using the alignment of three moving averages. Buy/Sell signals
Every Trader trades in a market zone. If you are not living in the time zone you are trading, you need a clock to show you what time it is in your favorite time zone, and it should be small at the same time to not interrupt your trading process.  In this small indicator, you have access to 3 major clocks around the world, and you can easily look at them. We have some other products that I am sure will help you with your trading career. Please have a look at the link: LINK our all-in-one trading
The indicator monitors the Dinapoli MACD trend in multiple timeframes for the all markets filtered and shows the results on Dashboard. Key Features Indicator can be used for all markets Monitors every timeframe, from 1 Min to Monthly Parameters UseMarketWatch: Set true to copy all symbols available in market watch MarketWatchCount : Set the number of symbols that you want to copy from the market watch list. CustomSymbols: Enter the custom symbols that you want to be available in dashboard. Ti
Quantum TrendPulse を ご紹介します。これは、   SuperTrend   、   RSI   、および Stochastic のパワーを 1 つの包括的なインジケーターに組み合わせて、取引の可能性を最大限に引き出す究極の取引ツールです。精度と効率を求めるトレーダー向けに設計されたこのインジケーターは、市場のトレンド、勢いの変化、最適なエントリー ポイントとエグジット ポイントを自信を持って特定するのに役立ちます。 主な特徴: SuperTrend 統合: 現在の市場動向に簡単に追従し、収益性の波に乗ることができます。 RSI精度: 買われすぎと売られすぎのレベルを検出し、市場の反転のタイミングに最適で、SuperTrendのフィルターとして使用されます。 確率的精度: 確率的振動を活用して、変動の激しい市場で隠れたチャンスを見つけます。SuperTrend のフィルターとして使用されます。 マルチタイムフレーム分析:   M5 から H1 または H4 まで、さまざまなタイムフレームで市場を常に把握します。 カスタマイズ可能なアラート: カスタム取引条件が満たされ
Mean Reversal Heikin Ashi Indicator calculates special trade reversal points based on Heikin Ashi candlesticks patterns. This indicator can be used on all symbols, even in Forex or B3 Brazillian Markets. You can configure just the position of each arrow. Then, after include the indicator on the graphic, pay attention on each arrow that indicates a long or short trade.
Market Structure Break & Order Block (MSB-OB) The Market Structure Break & Order Block (MSB-OB) indicator is built to analyze price structure, highlight market structure breaks, and mark order block zones. It also provides buffers for Buy/Sell signals and MSB detection, making it suitable for both manual analysis and automated strategies. A tester panel is included to evaluate performance under different conditions in the Strategy Tester. Main Concept Market Structure Break (MSB): Occurs after
The best quality application of the famous Super Trend indicator that requires no introduction. It is completely faithful to the original algorithm and powered by the CCI indicator. - easy to trade - It implements all kinds of warnings. - It implements a multi-timezone dashboard. - It cannot be repainted or backpainted. Input parameters - ATR Period – This is the average true range period. - ATR Multiplier - The ATR multiplier that defines the trend. - CCI - Makes trend following powerful. - M
Bid Price Timer Indicator — 精密なタイミングとスマートな価格追跡! Bid Price Timer Indicator は、 時間・正確さ・明確さ を重視するトレーダーのために設計された、強力なトレードツールです。 主な特徴: 固定タイマー表示 – タイマーは常にチャートの 右側 に表示され、(X_Offset で位置調整可能)。 価格に連動した動き – タイマーは Bid価格 に合わせてリアルタイムで 上下に移動 。 自動再配置 – 価格が変化すると、タイマーは自動的に 新しい価格レベルに追従 。 オプションの水平ライン – 正確なBid価格レベル を視覚的に表示可能。 ️ リアルタイム更新 – タイマーは 毎秒更新 され、 次のローソク足までのカウントダウン を表示。完璧なエントリータイミングを逃しません! トレーダーが選ぶ理由: ローソク足のクローズを 高精度で予測 できる チャートを シンプル・モダン・分かりやすく 保てる スキャルピング、デイトレード、テクニカル分析 に最適 シンプルで洗練さ
これは当社のインジケーター ACB Breakout Arrows 用に開発されたマルチシンボル・マルチタイムフレームのスキャナーです。デフォルト設定では、 28種類の通貨ペアと9つの時間足 を同時にスキャンして売買シグナルを検出します。  機能 1つのチャートから 252* のシンボルと時間足の組み合わせをスキャン可能です。 ワンクリックでシグナルのチャートを開き、事前に設定されたテンプレートを自動で適用します。  チャート上のどこにでも簡単にドラッグ&ドロップで配置できます。 ポップアップ、音声、プッシュ通知、メールによるリアルタイムアラート機能を搭載しています。  入力パラメーター ACB Breakout Arrows のシグナル感度設定。 スキャンするシンボルを入力してください。  履歴の更新:履歴データが不足または壊れている場合は、再ダウンロードして更新できます。  スキャンする時間足を選択してください。 アラート設定 パネルの色やフォントサイズを調整可能です。 
Euro Escalper — Puro no Kikan Toshi Sukyarupingu Injikeeta Euro Escalper wa, subete no entori de kikan toshi reberu no seido wo motomeru toreedaa no tame ni sekkei sareta kooseinou torihiki injikeeta desu. Gousei Shisuu (Deriv), Forex, oyobi MetaTrader 5 de riyou kanou na subete no shisan de kinoushimasu. Fibonacci beisu no ryuudousei zoon, naizou SuperTrend enjin, oyobi riaru taimu no purofesshonaru dasshubooddo wo kumiawasemasu. Shuyo na Riten Sai Egaki Nashi: Shingou yajirushi wa rousoku ashi
RubdFx Perfect Reversal , The reversal indicator is used to determine areas of support and resistance by Drawing an arrow with a level of supply and demand ( ReversalZones ). - You will catch more swings by reducing the period, and less swings if you increase period - Mobile, computer and email alerts available . it is not pushed by price which means the arrow will stay in one place,suitable for scalping and long term trading  Also Compatible with all forex paris , BUY RULES;  open a buy positio
If you are unsure how to use this indicator, please feel free to reach out to me. I will explain it to you and provide reading materials to help you make the most of it. TD Sequential Scanner: An Overview The TD Sequential scanner is a powerful technical analysis tool designed to identify potential price exhaustion points and trend reversals in financial markets. Developed by Tom DeMark, this method is widely used by traders to gauge market cycles and potential turning points with precision. Ho
Aurora Fibonacci — Illuminating the Golden Path of Market Structure Aurora Fibonacci is a next‑generation MetaTrader indicator that transforms the timeless elegance of Fibonacci mathematics into a powerful, real‑time trading compass. By mapping natural ratios and price symmetries with exceptional clarity, it helps traders navigate complex market terrain and identify high‑probability trade zones before they emerge. Key Features & Benefits Golden Ratio Precision – Harnesses the proven accuracy
Pivot Scenario Dashboard is a compact trading indicator designed to display daily pivot-based market structure in a clean and professional dashboard. It automatically calculates the main pivot level, support and resistance zones, and scenario-based market bias for the current symbol. The indicator helps traders quickly identify: main pivot level bullish and bearish trigger areas support and resistance levels target projection levels current market scenario in a compact dashboard Main Features: D
This indicator allows you to observe candle formation over a specific period, such as the Nasdaq, which starts at mid-hour. For example, for the first hour. The distance and size of the candle positioned on the right side can be adjusted. Color can also be assigned based on falling and rising candles. The needle can be made visible or invisible if desired. The body size can also be adjusted as desired.
FREE
Projection インジケーター(BCB Elevate)は、完全なプロ仕様のマーケット構造およびトレンド追従ツールです。手動トレーダー向けに作られており、マクロトレンドフィルター(EMA 100)、動的な ATR トレーリングストップ、スイングの高値/安値(Swing High/Low)ピボット追跡を組み合わせ、高精度なチャートシグナルを提供します。 チャートを再描画したり散らかしたりする代わりに、Projection インジケーターは条件が厳密に整うまで待機し、エントリー矢印、ストップロスの目標、テイクプロフィットレベルを描画します。 主な機能: トレンド検出: 構造的なスイング高値/安値を使用して真の市場トレンドを識別します。 マクロフィルター: EMA 100 を基準線として用い、支配的なモメンタムに沿った取引のみを行えるようにします。 動的 ATR ストップ: 変動性に応じたストップロスと二段階のテイクプロフィット(TP1 と TP2)ゾーンを自動計算します。 RSI ピーク検出: 取引中に RSI が極端な過熱/過冷状態に達したときにアラートを出し、理想的な決済機会を提
Link to our products: LINK The ICT Asian Killzone Indicator delivers a professional, institutional-grade framework by precisely defining the Asian trading session from 00:00 to 04:00 GMT with absolute accuracy. It streamlines market structure analysis by isolating liquidity accumulation, range formation, and volatility compression during the Asian session. Built for serious ICT and Smart Money traders, it enhances strategic decision-making, execution confidence, and Tokyo session directional bi
PREDATOR PULSE AI TRADER Premium · By Prometheus Neural Systems Most trading indicators are built once, calibrated on historical data, and left to run. They don't adapt. They don't learn. When the market changes — and it always does — they keep firing the same signals based on conditions that no longer exist. Predator Pulse was built on a different idea. Two Engines Working Together The foundation is a 60-feature institutional microstructure engine. Every bar, it analyses sixty distinct aspects
FREE
このプロダクトを購入した人は以下も購入しています
Neuro Poseidon is a new indicator by Daria Rezueva. It combines precise trading signals with adaptive TP/SL levels - creating best possible trades as a result! Message me and get  Neuro Poseidon Assistant  as a gift to automize your trading process! What makes it stand out? 1. Proven profitability on all assets and timeframes 2. Only confirmed BUY and SELL signals present on the chart 3. Adaptive TP & SL levels generated by the software for each trade 4. Easy to understand - suitable for al
PrimeScalping is a powerful trading companion designed to generate high-probability entry signals with dynamic TP/SL/DP levels based on volatility. Built-in performance tracking shows win/loss stats, PP1/PP2 hits, and success rates — all updated live. Key Features: Buy/Sell signals with adaptive volatility bands Real-time TP/SL/DP levels based on ATR Built-in MA Filter with optional ATR/StdDev volatility Performance stats panel (Success, Profit/Loss, PP1/PP2) Alerts via popup, sound, push, or e
SuperScalp Pro
Van Minh Nguyen
4.65 (26)
SuperScalp Pro – 高度なマルチフィルタースキャルピングインジケーターシステム SuperScalp Pro は、クラシックな Supertrend と複数のインテリジェント確認フィルターを組み合わせた高度なスキャルピングインジケーターです。M1 から H4 まで複数の時間足で効率的に動作し、XAUUSD、BTCUSD、主要 Forex 通貨ペア向けに最適化されています。 このインジケーターは明確な Buy / Sell シグナルを提供し、ATR に基づいてエントリー価格、Stop Loss、Take Profit を自動計算します。Fibonacci Take Profit 機能により、重要な価格帯で早期決済し、到達時に通知を送信します。 初期設定では Fibonacci Take Profit が有効化されており、より安定した取引体験を重視しています。チャートに適用するだけですぐ利用可能です。上級者向けに、すべてのパラメータは自由にカスタマイズできます。 完全なドキュメントは製品ブログにあります: [User Guide] SuperScalp Pro Auto T
このインジケーターを購入された方には、以下の特典を 無料 で提供しています: 各トレードを自動で管理し、ストップロスとテイクプロフィットを設定し、戦略ルールに基づいてポジションを決済する補助ツール 「Bomber Utility」 様々な銘柄に合わせたインジケーターの設定ファイル(セットファイル) 「最小リスク」、「バランスリスク」、「待機戦略」 の3つのモードで使用できる Bomber Utility 用の設定ファイル このトレーディング戦略をすぐに導入・設定・開始できる ステップバイステップのビデオマニュアル ご注意: 上記の特典を受け取るには、MQL5のプライベートメッセージシステムを通じて販売者にご連絡ください。 オリジナルのカスタムインジケーター 「Divergence Bomber(ダイバージェンス・ボンバー)」 をご紹介します。これは、MACDのダイバージェンス(乖離)戦略に基づいた 「オールインワン」型のトレーディングシステム です。 このテクニカルインジケーターの主な目的は、価格とMACDインジケーターの間に発生するダイバージェンスを検出 し、将来の価格の動きを示す
Entry In The Zone and SMC Multi Timeframe is a real-time 2-in-1 market analysis tool that combines market structure analysis and a No Repaint BUY / SELL signal system into a single indicator, built on Smart Money Concepts (SMC) — a widely adopted framework used by professional traders to understand market structure. This indicator helps you see the market more clearly, make decisions based on structure rather than guesswork, and focus on high-probability zones where price is more likely to react
Power Candles V3 - 自己最適化型強弱インジケーター Power Candles V3は 、通貨や銘柄の強さを、適用されたすべてのチャート上で実行可能なトレードプランに変換します。単にローソク足を色分けするだけでなく、バックグラウンドでリアルタイムの自動最適化を実行し、目の前の銘柄に対して最適なストップロス、テイクプロフィット、およびシグナルの閾値を提示します。ワンクリックで実取引に適用でき、エントリーポイント、ストップロス、テイクプロフィットのラインが正確な価格位置にチャート上に表示され、方向性を示すアラートがリアルタイムで発動します。 このツールは、Stein Investmentsのエコシステムの一部です。  18種類以上のツールをすべて閲覧し、AIを活用したセットアップの推奨事項を入手し、  https://stein.investments でコミュニティに参加しましょう クローズしたバーごとに3,000回以上のトレードシミュレーション。9つの強さの状態。2つの戦略を並行してテスト。勝率の高い設定をワンクリックで適用。 なぜこれが必要なのか ほとんどの強
この製品は 2026 年の市場向けに更新され、最新の MT5 ビルドに最適化されています。 価格更新のお知らせ: Smart Trend Trading System は現在 $99 で提供されています。 次の 30 件の購入 後、価格は $199 に上がります。 特別オファー: Smart Trend Trading System を購入後、私にプライベートメッセージを送ることで、 Smart Universal EA を無料 で受け取り、Smart Trend のシグナルを自動売買に変えることができます。 Smart Trend Trading System は、リペイントなし、再描画なし、遅延なしの完全なトレーディングシステムです。よりクリーンなシグナル、より明確なトレンド方向、そしてより整理された取引方法を求めるトレーダー向けに作られています。 Online course , manual and download presets . このシステムは、トレンド検出、反転ゾーン、Smart Cloud、トレーリングストップロジック、サポートとレジスタンス、ローソク足の色分け、ア
SignalTech MT5 is an unique fully rule based trading system for EURUSD, USDCHF, USDJPY, AUDUSD, NZDUSD, EURJPY, AUDJPY, NZDJPY, CADJPY.  All the winning trades with chart setups are published on the comments page. 2026-05 4107 Pips (Until 05-29 NY Closed) 2026-04 2243 Pips 2026-03 2165 Pips 2026-02 2937 Pips 2026-01 2624 Pips 2025-12 1174 Pips It can generate signals with Buy/Sell Arrows and Pop-Up/Sound Alerts. Each signal has clear Entry and Stop Loss levels, which should be automatically flag
ご紹介     Quantum Breakout PRO は 、ブレイクアウト ゾーンの取引方法を変革する画期的な MQL5 インジケーターです。 13年以上の取引経験を持つ経験豊富なトレーダーのチームによって開発されました。     クォンタム ブレイクアウト プロ   は、革新的でダイナミックなブレイクアウト ゾーン戦略により、あなたのトレーディングの旅を新たな高みに押し上げるように設計されています。 クォンタム ブレイクアウト インジケーターは、5 つの利益ターゲット ゾーンを備えたブレイクアウト ゾーン上のシグナル矢印と、ブレイクアウト ボックスに基づいたストップロスの提案を提供します。 初心者トレーダーにもプロのトレーダーにも適しています。 量子EAチャネル:       ここをクリック 重要!購入後、インストールマニュアルを受け取るためにプライベートメッセージを送ってください。 推奨事項: 時間枠: M15 通貨ペア: GBPJPY、EURJPY、USDJPY、NZDUSD、XAUUSD アカウントの種類: ECN、Raw、またはスプレッドが非常に低い R
Azimuth Pro
Ottaviano De Cicco
5 (7)
Azimuth Pro V2:MT5向けシンセティック・フラクタル構造分析と確認済みエントリー 概要 Azimuth Pro は Merkava Labs によるマルチレベルスイング構造インジケーターです。4つのネストされたスイングレイヤー、スイングアンカーVWAP、ABCパターン検出、3タイムフレーム構造フィルタリング、そして確定バーでの確認済みエントリー — 1つのチャートで、ミクロスイングからマクロサイクルまでを網羅するワークフロー。 これはブラインドシグナル製品ではありません。ロケーション、コンテキスト、タイミングを重視するトレーダーのための構造ファーストワークフローです。 V2発売記念オファー — Azimuth Pro V2をUSD 399で(次の100本)。最終価格:USD 499。 1. V2での変更点 シンセティック・マルチタイムフレームエンジン 上位タイムフレーム分析をMeridian Proと同じ独自のシンセティックアーキテクチャで一から再構築。よりクリーンなHTFコンテキスト、安定したライブ動作、従来のMTF同期問題なし。シンセティックエンジンは 固定比率タ
FX Trend NG:次世代マルチマーケット・トレンドインテリジェンス 概要 FX Trend NG は、複数の時間足に対応したプロフェッショナル向けトレンド分析およびマーケット監視ツールです。 市場全体の構造を数秒で把握することができます。 複数のチャートを切り替える必要はありません。どの銘柄がトレンド中なのか、どこでモメンタムが弱まっているのか、そしてどの時間足で強い整合性があるのかを瞬時に確認できます。 ローンチ特別オファー – FX Trend NG を $30(6ヶ月) または $80 永久ライセンス でご利用いただけます。 すでに Stein Investments のユーザーですか? -> メッセージを送信 して、プライベートグループへアクセスしてください。 セットアップや詳細情報が必要ですか? -> Stein Investments 公式ページ をご覧ください。 1. FX Trend NG が他と異なる理由 3ステート・トレンドロジック ― Buy と Sell だけではない • 多くのインジケーターは Buy または Sell の2状態のみを表示します。
トレンドキャッチャーインジケーター トレンドキャッチャーインジケーターは、開発者独自の適応型トレンド分析指標を組み合わせることで、市場価格の動きを分析します。短期的なノイズを除去し、根底にあるモメンタムの強さ、ボラティリティの拡大、価格構造の挙動に焦点を当てることで、真の市場方向性を特定します。また、移動平均線、RSI、ボラティリティフィルターなどの平滑化およびトレンドフィルタリング機能を備えたカスタマイズ指標も使用します。 実際の運用状況のモニタリングやその他の製品については、こちらをご覧ください: https://www.mql5.com/en/users/mechanic/seller ご注意ください。私はTelegramでEAや設定を販売していません。詐欺です。すべての設定はブログで無料で公開しています。 重要!ご購入後すぐにご連絡ください。手順とボーナスをお送りします!
RelicusRoad Pro: 定量的市場オペレーティングシステム 【期間限定】無制限アクセス 70% OFF - 2,000人超のトレーダーと共に なぜ多くのトレーダーは「完璧な」インジケーターを使っても失敗するのでしょうか? それは、文脈を無視して 単一の概念 だけでトレードしているからです。文脈のないシグナルは単なるギャンブルです。勝ち続けるには、 根拠の重なり(コンフルエンス) が必要です。 RelicusRoad Proは単なる矢印インジケーターではありません。完全な 定量的市場エコシステム です。独自のボラティリティモデリングを用いて、価格が推移する「適正価値の道(Fair Value Road)」をマッピングし、ノイズと真の構造的ブレイクを判別します。 推測はやめましょう。機関投資家レベルの「ロード・ロジック」でトレードを。 コアエンジン:「Road」アルゴリズム システムの中心となる Road Algo は、市場環境にリアルタイムで適応するダイナミックなボラティリティチャネルです。 安全ライン(平衡点) と、価格が数学的に反転しやすい 拡張レベル を投影します。 Si
Gann Made Easy   は、ミスター・ギャンの理論を使用した取引の最良の原則に基づいた、プロフェッショナルで使いやすい外国為替取引システムです。 W・D・ガン。このインジケーターは、ストップロスとテイクプロフィットレベルを含む正確な買いと売りのシグナルを提供します。 PUSH通知を利用して外出先でも取引可能です。 ご購入後、取引方法の説明と優れた追加インジケーターを無料で入手するには、私にご連絡ください! おそらく、ギャンの取引手法についてはすでに何度も聞いたことがあるでしょう。通常、ギャンの理論は初心者のトレーダーだけでなく、すでにある程度の取引経験がある人にとっても非常に複雑なものです。なぜなら、ギャンの取引手法は理論的にはそれほど簡単に適用できるものではないからです。私はその知識を磨き、最良の原則を私の外国為替インジケーターに組み込むために数年を費やしました。 このインジケーターは非常に簡単に適用できます。必要なのは、それをチャートに添付し、簡単な取引推奨事項に従うだけです。このインジケーターは常に市場分析の仕事を行い、取引の機会を探します。適切なエントリーポイントを検
この製品は 2026 年の市場向けに更新され、最新の MT5 ビルドに最適化されています。 価格更新のお知らせ: Smart Price Action Concepts は現在 $200 で提供されています。 次の 30 件の購入 後、価格は $299 に上がります。 特別オファー: 購入後、私にプライベートメッセージを送ることで、 無料ボーナス + ギフト を受け取ることができます。 まず、このトレーディングツールはリペイントなし、再描画なし、遅延なしのインジケーターであり、プロフェッショナルな取引に最適であることを強調しておきます。 Online course , and manual Smart Price Action Concepts Indicator は、初心者から経験豊富なトレーダーまで使える非常に強力なツールです。20 種類以上の便利なインジケーターを 1 つにまとめ、Inner Circle Trader Analysis や Smart Money Concepts Trading Strategies などの高度な取引アイデアを組み合わせています。このインジケ
ARIPoint
Temirlan Kdyrkhan
1 (1)
ARIPoint is a powerful trading companion designed to generate high-probability entry signals with dynamic TP/SL/DP levels based on volatility. Built-in performance tracking shows win/loss stats, PP1/PP2 hits, and success rates all updated live. Key Features: Buy/Sell signals with adaptive volatility bands Real-time TP/SL/DP levels based on ATR Built-in MA Filter with optional ATR/StdDev volatility Performance stats panel (Success, Profit/Loss, PP1/PP2) Alerts via popup, sound, push, or email Cu
メタトレンドプロ   これは、トレードにおける推測を排除し、市場が既に決定を下したポイントを示すトレンドフォローツールです。この指標は、トレンド、動向、構造が変化する重要なポイントを特定し、主要プレーヤーがポジションを取るべき価格の戻り領域を強調表示します。 単に値動きを見るだけでなく、その背後にある論理を理解できます。すべてのシグナルはローソク足が確定した後に記録され、再描画されることなくチャートに保存されるため、自信を持って状況を分析し、意思決定を行うことができます。トレード目標(利益確定)も表示されます。 この指標の有効性について完全に確信を持っていただくために、自動統計機能をご利用いただけます。 方向転換のたびに、インジケーターはストップロスレベルとそのインテリジェントな段階的移動(Move SL)も表示します。これは非常に重要です。     削減   リスク   ポジション別。 損切り/利益確定/リスクリワード 右側の内蔵パネルには、現在の世界的なトレンドの方向における市場参入ポイントが表示され、過去のデータからもこれらのシグナルが確認できます。 任意の時間枠/ツール この指
この製品は 2026 年の市場向けに更新され、最新の MT5 ビルドに最適化されています。 価格更新のお知らせ: Atomic Analyst は現在 $99 で提供されています。 次の 30 件の購入 後、価格は $199 に上がります。 特別オファー: Atomic Analyst を購入後、私にプライベートメッセージを送ることで、 Smart Universal EA を無料 で受け取り、Atomic Analyst のシグナルを自動売買に変えることができます。 Atomic Analyst は、リペイントなし、再描画なし、遅延なしの Price Action トレーディングインジケーターで、手動取引、シグナルの明確化、EA 自動化のために設計されています。 User manual: settings, inputs and strategy. 価格行動、強さ、モメンタム、マルチタイムフレーム方向、高度なフィルターを分析し、トレーダーがノイズを減らし、弱いセットアップを避け、より構造化された取引判断を行えるようにします。 このインジケーターは、複雑な市場計算をシンプルな視覚シ
M30/H1/H4スイング版もあります M5/M15では取りきれない大きな波を狙いたい方へ。 Gold Signal Swing Pro(M30/H1/H4対応)を販売中。 1トレードで$20〜$80+の値幅を狙う。 https://www.mql5.com/en/market/product/177643 KURAMA GOLD SIGNAL PRO(MT5版)— 7層フィルター搭載 XAUUSD完全トレードシステム リペイントなし。リドローなし。ラグなし。すべてのサインは確定後に変わりません。 購入者限定特典:買い切りライセンスをご購入いただいた方に、AI Zone Radar($59相当)+PDFマニュアルを無料プレゼント。購入後にMQL5でメッセージをお送りください。 AI Zone Radar: https://www.mql5.com/en/market/product/175834 ゴールドトレーダーのコミュニティで実際に使用され、精度と使いやすさで高評価。 あなたの問題
FX Power: 通貨の強弱を分析して、より賢い取引を実現 概要 FX Power は主要通貨と金の実際の強弱をあらゆる市場状況で理解するための必須ツールです。強い通貨を買い、弱い通貨を売ることで、 FX Power は取引の意思決定を簡素化し、高い確率の取引機会を見出します。トレンドを追従する場合でも、極端なデルタ値を使用して反転を予測する場合でも、このツールはあなたの取引スタイルに完全に適応します。ただ取引するだけではなく、 FX Power で賢く取引をしましょう。 1. なぜ FX Power がトレーダーにとって非常に有益なのか 通貨と金のリアルタイム強弱分析 • FX Power は主要通貨と金の相対的な強弱を計算し、マーケットダイナミクスに関する明確な洞察を提供します。 • どの資産がリードしているか、または後れを取っているかを監視して、取引するペアを賢く選びましょう。 マルチタイムフレームの包括的なビュー • 短期、中期、長期のタイムフレームで通貨と金の強弱を追跡し、マーケットトレンドに基づいて取引戦略を調整できます。 • スキャルピングからスイングトレード
Meridian Pro
Ottaviano De Cicco
5 (2)
Meridian Pro 2.00:MT5向けプロ仕様マルチタイムフレーム・トレンドマトリクス Meridian Pro 2.00 は、MetaTrader 5 向けのプロ仕様の適応型トレンドマトリクスです。オリジナルの Meridian トレンドエンジン、クリーンなチャート ribbon、確定足ベースのシグナル矢印、8時間足 dashboard、Fuel momentum、weighted consensus、synthetic HTF processing、そしてチャート上に直接表示される上位足コンテキストラインを統合します。 目的はシンプルです。現在のトレンド、マルチタイムフレーム構造、強度、momentum、EA-ready 状態を、複数チャートに無関係なインジケータを重ねるのではなく、1つの整理された workflow で読むことです。 Meridian Pro の違い 1つの適応型エンジン - 同じ volatility-aware Meridian ロジックを M1 から W1 まで適用します。 Synthetic HTF architecture - 上位足行は下位足デ
Crystal Heikin Ashi Signals - Professional Trend & Signal Detection Indicator Advanced Heikin Ashi Visualization with Intelligent Signal System for Manual & Automated Trading Final Price: $149 ---------> Price goes up $10 after every 10 sales . Limited slots available — act fast . Overview Crystal Heikin Ashi Signals is a professional-grade MetaTrader 5 indicator that combines pure Heikin Ashi candle visualization with an advanced momentum-shift detection system. Designed for both manual traders
MetaForecast M5
Vahidreza Heidar Gholami
5 (3)
MetaForecastは、価格データのハーモニクスに基づいて、どんな市場の未来を予測し視覚化します。市場が常に予測可能ではありませんが、価格にパターンがある場合、MetaForecastは可能な限り正確な未来を予測できます。他の類似製品と比較して、MetaForecastは市場のトレンドを分析することでより正確な結果を生成することができます。 入力パラメータ Past size (過去のサイズ) MetaForecastが将来の予測を生成するために使用するバーの数を指定します。モデルは選択したバー上に描かれた黄色の線で表されます。 Future size (将来のサイズ) 予測すべき将来のバーの数を指定します。予測された将来は、ピンクの線で表示され、その上に青い回帰線が描かれます。 Degree (程度) この入力は、MetaForecastが市場で行う分析のレベルを決定します。 Degree 説明  0 Degree 0の場合、価格の全てのピークや谷、そして詳細をカバーするために、「Past size」の入力に大きな値を使用することが推奨されています。  1 (推奨) Degre
多くの矢印インジケーターは、シグナルだけを表示して、その後の判断をすべてトレーダーに任せてしまいます。KT Alpha Hunter Arrows は、完整なトレードプランをチャート上に提示します。 各シグナル矢印が表示されるたびに、エントリーライン、ストップロス、4つのテイクプロフィット水準、そして現在の銘柄と時間足が今トレードに値するかどうかを示すリアルタイムのエッジ判定が、すでに描画された状態で表示されます。付属の Trade Manager EA は、あなたが手動でエントリーした後の実行管理を担当し、相場が荒れて判断がぶれやすい場面でも規律あるトレードを保ちやすくします。リペイントなし。確定足シグナルのみ。Forex、ゴールド、指数、その他あなたが取引するあらゆる銘柄に対応します。 主な機能 リペイントしない買い矢印と売り矢印を、足の確定後にのみ表示。 各シグナルに、エントリーライン、構造的ストップロス、4つのテイクプロフィット水準を表示。 Edge Dashboard が、現在のチャートで買いセットアップと売りセットアップを別々に評価。 判定システム:No Edge、Mar
トレンド スクリーナー インジケーターでトレンド取引の力を解き放ちます。ファジー ロジックと複数通貨システムを活用した究極のトレンド取引ソリューションです。 ファジー ロジックを活用した革新的なトレンド インジケーターである Trend Screener を使用して、トレンド取引を向上させます。 これは、13 を超えるプレミアム ツールと機能、および 3 つの取引戦略を組み合わせた強力なトレンド追跡インジケーターであり、Metatrader をトレンド アナライザーにする多用途の選択肢となります。 期間限定オファー : トレンド スクリーナー インジケーターは、わずか 65 ドルで生涯ご利用いただけます。 (元の価格 50$ ) (オファー延長) Trend Screener の 100% 非再描画精度の揺るぎない精度を体験して、取引の決定が過去の価格変動の影響を受けないようにしてください。 マルチタイムフレームおよびマルチ通貨機能の多用途性を解放し、比類のない自信を持って外国為替、商品、暗号通貨、インデックスの世界を取引できるようにします。 Trend Screener の包括的な戦
このダッシュボードは、選択されたシンボルの最新の利用可能なハーモニックパターンを表示するので、時間を節約し、より効率的に /   MT4バージョン 。 無料インジケーター:   Basic Harmonic Pattern インジケーター列 Symbol : 選択したシンボルが表示されます。 Trend :   強気または弱気 Pattern : パターンの種類(ガートレー、バタフライ、バット、カニ、サメ、サイファー、ABCD) Entry : エントリー価格 SL: ストップロス価格 TP1: 1回目の利食い価格 TP2: 2回目の利食い価格 TP3:   3回目の利食い価格 Current price :   現在値 Age (in bars):    最後に描画されたパターンの年齢 主な入力項目 Symbols:   "28 Major Currency Pairs "または "Selected Symbols "から選択。 Selected Symbols:   カンマで区切られた監視したいシンボル("EURUSD,GBPUSD,XAUUSD")。ブローカーがペアに接
スイングトレーディング は、トレンドの方向のスイングと可能な反転スイングを検出するように設計された最初のインジケーターです。トレーディングの文献で広く説明されているベースラインスイングトレーディングアプローチを使用します。インディケータは、いくつかの価格と時間のベクトルを調査して、全体的なトレンドの方向を追跡し、市場が売られ過ぎまたは買われ過ぎて修正の準備ができている状況を検出します。 [ インストールガイド | 更新ガイド | トラブルシューティング | よくある質問 | すべての製品 ] むち打ちを起こさずに市場スイングの利益 インジケーターは常にトレンドの方向を表示します 色付きの価格帯は機会のベースラインを表します 色付きのダッシュは、可能な反転スイングを表します この指標は、独自の品質とパフォーマンスを分析します 複数時間枠のダッシュボードを実装します カスタマイズ可能なトレンドおよびスイング期間 電子メール/サウンド/プッシュアラートを実装します インジケータは再描画またはバックペインティングではありません Swing Tradingとは Swing Tradingは
BTMM State Engine Pro is a MetaTrader 5 indicator for traders who use the Beat The Market Maker approach: Asian session context, kill zone timing, level progression, peak formation detection, and a multi-pair scanner from a single chart. It combines cycle state logic with a built-in scanner dashboard so you do not need the same tool on many charts at once. What it does Draws the Asian session range; session times can follow broker server offset or be set in inputs. Tracks level progression (L
FX Volume MT5
Daniel Stein
4.79 (24)
FX Volume:ブローカー視点で捉える本物の市場センチメント クイック概要 トレード手法をさらに高めたいとお考えですか? FX Volume は、リテールトレーダーやブローカーのポジション状況をリアルタイムで提供します。これは、COTのような遅延レポートよりもはるかに早く知ることができます。安定した利益を目指す方も、さらなる優位性を求める方も、 FX Volume は大きな不均衡を見極め、ブレイクアウトを確認し、リスク管理を洗練させるのに役立ちます。今すぐ始めて、実際の出来高データがどのように意思決定を変革するかを体感してください! 1. FX Volume がトレーダーにとって非常に有益な理由 高精度の早期警戒シグナル • 各通貨ペアを売買しているトレーダー数を、他者よりも早く、ほぼリアルタイムで把握できます。 • FX Volume は、複数のリテールブローカーから得られる本物の出来高データを収集し、分かりやすい形式で提供する 唯一 のツールです。 強力なリスク管理 • ロングやショートの大きな偏り(インバランス)を特定し、潜在的なトレンド転換を見逃しません。ストップ
ご購入後、ご連絡いただければ、本インジケーターをベースにしたEA(自動売買システム)を無料ボーナスとしてご提供いたします。 ChandraSAR Optimizer:自己適応型・定量的トレンドエンジン ほとんどのトレンドインジケーターが機能しなくなる理由は単純です。それは「市場は変化するのに、静的なパラメーターは変化しないから」です。 ChandraSAR Optimizer は、単なるシグナル生成と高度なアルゴリズムテストの壁を取り払います。本製品は、配列ベースの高効率なウォークフォワード(Walk-Forward)最適化エンジンをチャートに直接組み込むことで、ボラティリティ変動の問題を解決するMetaTrader 5用のダイナミックなトレンドフォローシステムです。 シャンデリア・エグジット(Chandelier Exit)の精度と、パラボリックSAR(Parabolic SAR)のモメンタム追従性を融合させたChandraSARは、単にシグナルを生成するだけではありません。現在の相場環境に合わせて、自らのパラメーターを継続的にテスト、スコアリングし、適応させます。手動での調整は一
作者のその他のプロダクト
VIX index
Carlos Andrés Moya Erazo
The VIX Index, or CBOE Volatility Index, is an indicator designed for MetaTrader 5 that transforms historical volatility into an easy-to-interpret oscillator, placing the volatility range between 0 (minimum) and 100 (maximum) based on a configurable normalization period. Unlike a simple ATR, this oscillator shows you on the chart when volatility is abnormally low or high compared to its recent behavior. Additionally, the indicator provides context and information about the famous VIX Volatility
FREE
RSImaxmin
Carlos Andrés Moya Erazo
4.5 (10)
The indicator shows when there are overprice and divergences on the RSI. In addition, it has configurable alerts, dynamic overprice levels and a special “RSI cleaner” function. The indicator that automatically calculates the premium rates! RSImaxmin is an indicator based on the Relative Strength Index (RSI) oscillator that effectively identifies changes in price trends as it reflects the relative strength of bullish movements compared to bearish movements. It is widely used by traders to measur
Ranking Scalping
Carlos Andrés Moya Erazo
Ranking Scalping allows you to quickly identify the best opportunities in the market, reducing analysis time and empowering your trading decisions. It is a robust and adaptable tool, ideal for traders looking to optimize their scalping and intraday strategies. With its automated analysis and clear visualization, discover how to maximize your opportunities and trade more efficiently with this innovative tool! Serie: Daytrading: Scalping & Intraday Top Symbols Analyzer General Description: The "R
PipHistogram
Carlos Andrés Moya Erazo
PipHistogram   is an essential tool for traders who want to gain insight into price distribution and concentration. Its customizable, visually appealing histogram allows you to pinpoint key levels and make more informed trading decisions. Enhance your market analysis and improve your trading strategy with PipHistogram   —your shortcut to understanding price dynamics in MetaTrader 5. Overview : PipHistogram   is a powerful indicator for MetaTrader 5 that visually displays the percentage distribu
フィルタ:
JJair
79
JJair 2022.06.27 18:39 
 

Ótimo indicador, recomendo.

faithdefender
1746
faithdefender 2021.08.19 19:30 
 

So far, this is more difficult to understand than the details make it out to be. I wanted the RSI, (since I am more of an RSI person) but had to settle for the MACD since it was tremendously cheaper. I want to be fair with my review since I have only had it a week. In the details it says "Soon more strategies will be implemented to have a great variety of signals and to fully exploit the possibilities of this indicator." But when was that written? A year ago? There are not many instructions to follow other than what is written already. Nine pics dont really help understand how to use the indicator. Of course, when Vendors do their advertising, they pick the perfect charts to sell their indicators. I am not saying this is the case with Carlos, but it is the case for the majority of slimy Vendors on MQL platform. The only reason I give it 4 stars is because the price was fair. Other wise it probably would have been 2 or 3 stars. I will follow up with an update to let others know how it performs. UPDATE 3-21-22 Updated to the new version. However, received an error message. Sent the Vendor a comment, but non responsive. I asked him why the indicator is leaving the following message; "Can you tell me why I have a sudden error when I downloaded the newer version? It reads; "2022.03.18 13:11:31.227 MACDmaxmin (XAUUSD,H2) Not all data of ExtFastMaHandle is calculated (-1bars ). Error4806"..... It will remain a 1 star until I hear back and the problem is fixed for 60 dollars.

Carlos Andrés Moya Erazo
6256
開発者からの返信 Carlos Andrés Moya Erazo 2021.08.19 20:16
Hello, I am sorry that I did not meet your expectations. The indicator is designed to be easy to configure and operate, that is why the indicator shows only what is necessary (and you can even remove signals that you do not want to see). Anyway, could you tell us what is the difficulty you have to be able to make a better product? On the other hand, if I plan to improve the indicator, and include new features, but the process is long due to the fact that several tests are carried out and it will only be published when I think it has something really functional. In addition, the price will also rise once it is updated due to marketplace policies, for this reason the updates were also delayed.
The graphics included to show the indicator try to get as close as possible to reality, in fact if you analyze them, I show that in some cases the market does not comply with the indicator's prediction.
Thank you for sharing your review and rating. I hope I have been able to help you. successes.
レビューに返信