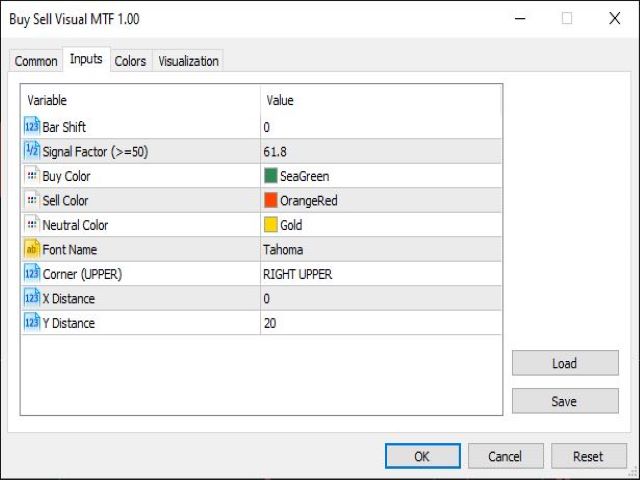
Buy Sell Visual MTF

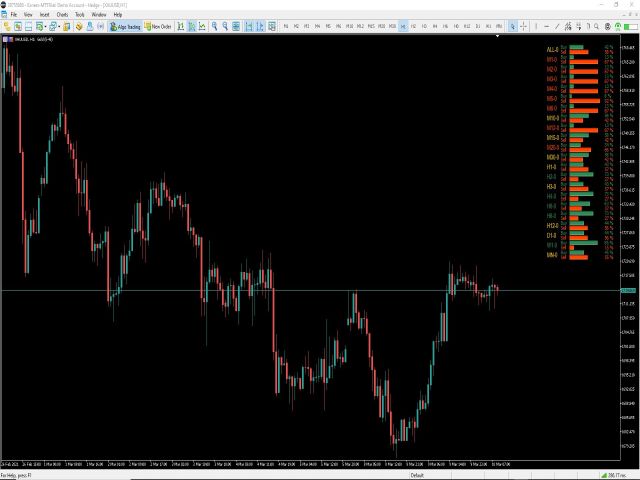
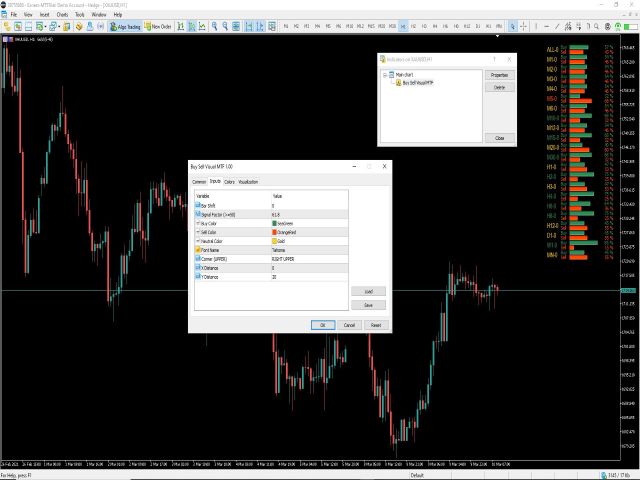
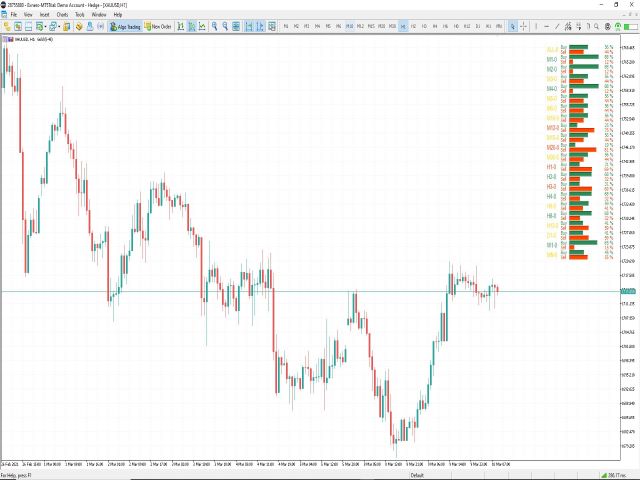
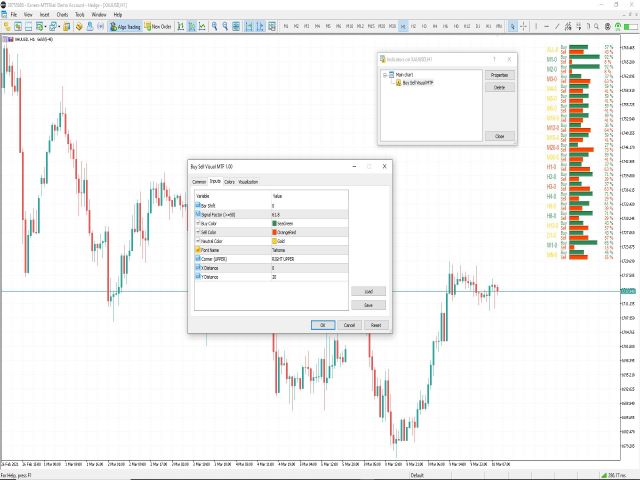
This MT5 indicator, Bull Bear Visual MTF (21 Time Frames), summarize the strength color graphic and percentages of power for both  Bull and Bear in current market emotion stage which will show you in multi time frames and sum of the total Bull and Bear power strength which is an important information for traders especially you can see all Bull and Bear power in visualized graphic easily, Hope it will be helpful tool for you for making a good decision in trading.


おすすめのプロダクト
Volume Profile SAF - Institutional-Grade Volume-informed Market Structure Indicator     Unlock Professional Market Intelligence with less Effort   Stop guessing. Start seeing. The Volume Profile SAF (Set and Forget) transforms complex market structure analysis into crystal-clear, actionable trading signals that institutional traders pay thousands for. Experience the power of real-time volume profiling, value area tracking, and precision POC cross alerts - all in one lightweight, EA-ready indicat
Institutional Tick Engine Pro: ティック速度&ヒートマップ分析 Institutional Tick Engine Proは、ブローカーからの生のティックデータを処理するために設計されたテクニカル分析スイートです。レベル2データを必要とせずに、速度(Velocity)、ヒートマップ、マイクロストラクチャーパターンなどのオーダーフロー指標を合成します。 主な機能 1. ティック速度モニター 市場速度(1秒あたりのティック数)を測定し、価格変動の勢いを分析します。 2. 合成流動性ヒートマップ 大口の出来高があるにもかかわらず価格が停滞している「吸収ゾーン」を可視化し、隠れた指値注文を特定します。 3. マイクロストラクチャー反転シグナル 形成中のローソク足内部での潜在的な反転を検出します(例:高値更新時に売りティックが優勢な場合など)。 4. オーディオトレーディングアシスタント(ガイガーモード) 市場のボラティリティに基づいて音の周波数を変調させる「ガイガーカウンター」モードを搭載しています。 技術仕様 データソース: ブローカーティックデータ。 アラート
Link to our best products: LINK Link to our Trading Dashboard: LINK !!!!!!! Attention, you can find premium discounts by clicking on arrows!!!!!! Setting of this indicator candles mode: Show zones from the beginning Swing number for highs and lows Show background color Color of Premium Color of Discount show level 0% line show level 25% line show level 50% line show level 75% line show level 100% line The Premium and Discount concept is a core principle of Smart Money Concepts (SMC) used to i
PROMOTIONAL PERIOD - ONLY 2 COPIES LEFT OF FIRST 10 BUYERS AT PRICE 300,00$!!! CHECK SCREENSHOTS AND COMMENTS FOR OUR STRATEGY RULES AND LIVE TRADES SIGNALS PULL IT BACK  is a revolutionary trading system and a complete strategy with advanced algorithm developed to detect the trend direction after a  PULLBACK , a  RETREACEMENT  or a  KEY LEVEL BOUNCE . The goal of this indicator is to get as many pips as possible from market trend. Following strictly the rules of the strategy, you can become a
- Real price is 80$ - 45% Discount (It is 45$ now) Contact me for extra bonus   indicator, instruction or any questions! - Lifetime update free - Non-repaint - Related product: Gann Gold EA - I just sell my products in Elif Kaya Profile, any other websites are stolen old versions, So no any new updates or support. Advantages of  M1 Scalper Pro  Profitability: M1 Scalper Pro is highly profitable with a strict exit strategy. Frequent Opportunities: M1 Scalper Pro  takes advantage of numerous smal
ATR Volatility Zones Indicator Multi-Level Volatility Measurement Tool with Visual Alerts This advanced indicator analyzes market volatility using Average True Range (ATR) to identify five distinct volatility zones, helping traders adapt their strategies to current market conditions. Key Features: 5-Zone Volatility Classification - Precisely identifies: • LOW (Cyan) • MEDIUM-LOW (Lime Green) • MEDIUM (Yellow) • HIGH-MEDIUM (Orange) • HIGH (Red) Smart Dynamic Ranges - Automatically adjust
( 私の推奨: XAUUSD、EURUSD、USDJPY、GBPUSD などの主要通貨ペアでは 1 分足(M1)での利用を推奨します。これは本インジケーターの推奨設定です) MetaTrader 5 用 Compression Breakout Box PRO 目的: 高品質な保ち合い(「圧縮」)ゾーンを特定し、 ローソク足の確定(クローズ) で 確認ブレイクアウト を表示します。さらに、すぐに使えるトレードプラン(Entry / Stop / Target1 / Target2)を提示します。 このインジケーターでできること 自動コンプレッションボックス :確定足のみを使用し、 ATR(14) によるボラティリティスケーリングで検出します。 全銘柄 ・ 全時間足 で動作します。 ( 私の推奨: XAUUSD、EURUSD、USDJPY、GBPUSD などの主要通貨ペアでは 1 分足(M1)) リペイントなしのシグナル :矢印は足が確定してからのみ表示され、他の足へ移動しません。 CONFIRMED モード(既定) :Break → Retest → Rebreak の確認でダマシをフ
VWAP Indicator MT5
Kyra Nickaline Watson-gordon
Description : VWAP (Volume-Weighted Average Price) is the ratio of the value traded to total volume traded over a particular time horizon. It is a measure of the average price at which pair is traded over the trading horizon. Read More. All Symbols and All Timeframes are supported. Indicator Inputs :     VWAP Mode : Mode of VWAP Calculation. Options can be selected : Single,Session,Daily,Weekly,Monthly     Volumes : Real Volumes,Tick Volumes     Price Type : Used price for calculating. O
SMC VALID EA (MT5) Version: 1.10 Author: Marrion Brave Wabomba Category: Smart Money Concepts (SMC) and  ICT concepts ICT Smart Money Daily Zones (SMC Pro)  ICT Smart Money Daily Zones (SMC Pro) – ICT Daily Buy & Sell Zones Pro is a professional-grade Smart Money Concepts (SMC) / ICT trading indicator for MetaTrader 5, designed to clearly map institutional daily levels and guide traders with high-probability decision zones . This indicator automatically analyzes the Daily timeframe (PDH / PD
CRV Z-Score Engine is a professional market structure indicator that transforms raw price into normalized,  multi-horizon statistical structure model   It reveals: When price is statistically stretched When the market is transitioning between regimes When a move is structurally aligned across multiple horizons This is not a lagging oscillator . It is a multi-horizon statistical structure model built for serious traders. WHAT IS Z-SCORE? Z-Score measures how far price deviates from its n
Introduction This indicator detects volume spread patterns for buy and sell opportunity. The patterns include demand and supply patterns. You might use each pattern for trading. However, these patterns are best used to detect the demand zone (=accumulation area) and supply zone (=distribution area). Demand pattern indicates generally potential buying opportunity. Supply pattern indicates generally potential selling opportunity. These are the underlying patterns rather than direct price action. T
Explosion Trend MT5 is a momentum and volatility based indicator designed to detect strong market activity and filter low energy conditions. The indicator combines: MACD based momentum acceleration Volatility expansion using standard deviation A dynamic dead zone filter based on market range Signals are generated when trend strength, volatility expansion and market activity align. Core Logic Trend strength is calculated from the difference between fast and slow exponential moving averages. The c
The Institutional Flow Sentinel (Net Sentiment Volume AKA NSV) SEE VOLUME HAPPENING ON THE GO!!!!!!! Overview Retail traders look at price. Institutions look at order flow . The Institutional Flow Sentinel is a high-precision algorithmic system designed to decode the hidden battle between buyers and sellers. By analyzing real-time volume delta and identifying supply/demand imbalances, this system allows you to stop guessing and start trading with the "Smart Money." Why Order Flow? Price charts
# LofiBoy CSM - Pure Price Action Currency Strength Meter **Stop guessing which pair to trade. Let the market tell you where the money is flowing.** LofiBoy CSM is not your average currency strength meter. While traditional meters rely on lagging indicators like RSI, Stochastic, or MACD that introduce noise and delay, **LofiBoy CSM uses a proprietary Pure Price Action algorithm** . It analyzes the direct candle positioning of the 8 major currencies to reveal the true, raw momentum of the mark
3つのインジケーターが力を合わせる! Trix TURBOは、オシレーターのファミリーに属するインジケーターで、MetaTrader 5用にカスタマイズされ、Triple Exponential Moving Average (TRIX) オシレーターをParabolic SAR (SAR)と組み合わせ、動的な着色を行い、シンプルな移動平均 (MA) でスムージングします。 このツールは、別ウィンドウでモメンタムとトレンド方向の視覚的な表現を提供します。TRIXのライン(またはヒストグラム)は、SARの価格に対する位置に基づいて着色されます:アクアで潜在的な上昇トレンド(SARが価格の下)、コーラルで潜在的な下降トレンド(SARが価格の上)。含まれるMAは、可能なクロスオーバーを特定してエントリー/エグジットシグナルを助けます。 主な機能: TRIX期間、適用価格、およびMAパラメーターのカスタマイズ可能。 SARのステップと最大値でトレンド感度を調整。 カラーラインまたはヒストグラムとして表示するオプションで、強さとダイバージェンスをより良く視覚化。 ユーザー定義の色で上昇および下降
一目で分析を強化! このインジケーターは、価格が最近反発または突破した重要なレベルを自動的に描画し、手動でラインを引くことなくサポートとレジスタンスのゾーンを表示します。チャートに適用するだけで、各期間の過去の高値・安値ラインが表示されます。 各ラインの意味 Previous Month High ‣ 前月高値:前の月の期間内で記録された最高価格。 Previous Month Low ‣ 前月安値:前の月の期間内で記録された最安価格。 Previous Week High ‣ 前週高値:前の週の期間内で記録された最高価格。 Previous Week Low ‣ 前週安値:前の週の期間内で記録された最安価格。 Previous Day High ‣ 前日高値:直前の取引日の最高価格。 Previous Day Low ‣ 前日安値:直前の取引日の最安価格。 なぜ使うのか? グラフを開いた瞬間に 反発 と 突破 を検出。 実績あるゾーンで 利確 と 損切り を設定。 SMC や ICT 戦略に必須、市場構造をベースにエントリーと決済を最適化。 スキャルピング 、 スイング
There is a strong correlation between tick volume and real volume.  This is important for 2 reasons: Real volume is a very important indicator because, among many other benefits, it provides strong confirmations of the emergence/dissipation of trends. Real volume is not available in Forex, instead, one has to make do with tick volume. Unfortunately, tick volume is highly broker dependent.  Additionally, it is often not used effectively to define indicators.  Virtually all indicators that use
Forex is the most liquid market in the world. For this reason real volumes are not available. Some indicators use the number of ticks, in other cases the broker can supply volumes informations but they will be only data about that broker. Volumes are important becase they will form the price and volatility of the market. Using an algorithm this indicator can give you a very good approximation of the volumes for each candle. How to read the indicators? This version provides you many visualizati
Hydra Trend Rider is a non-repainting, multi-timeframe trend indicator that delivers precise buy/sell signals and real-time alerts for high-probability trade setups. With its color-coded trend line, customizable dashboard, and mobile notifications, it's perfect for traders seeking clarity, confidence, and consistency in trend trading. Setup & Guide:  Download  MT4 Version here. To learn how to use the Indicator: Indicator Manual & Guide -   Read Here Follow our MQL5 channel for daily market ins
The Price Tracker Indicator is designed to outline a dynamic price channel, showcasing areas where price movement is typically contained. The indicator highlights potential areas of interest where price may react when approaching the channel limits. Versatile for Scalping and Swing Trading The indicator adapts to all timeframes and can complement various trading strategies. It integrates seamlessly with tools such as supply and demand levels, reversal patterns, and other confluences. Key Feat
Are you the trend surfing type? Do you like to follow the big sharks? Nope? So you are the type that trades reversion? Awaiting the trend exhaustion and entering on trade? So this indicator is for you ! With it is extremely easy to identify the trend and when it reverses because the chart is automatically colored according to a defined moving average. You can change it settings and make it your own (or hide it). In addition it is possible to have indicative arrows on chart and also popup and p
Market Structure Break & Order Block (MSB-OB) The Market Structure Break & Order Block (MSB-OB) indicator is built to analyze price structure, highlight market structure breaks, and mark order block zones. It also provides buffers for Buy/Sell signals and MSB detection, making it suitable for both manual analysis and automated strategies. A tester panel is included to evaluate performance under different conditions in the Strategy Tester. Main Concept Market Structure Break (MSB): Occurs after
SMC Market Blueprint Institutional Market Structure Analyzer Based on Smart Money and ICT Concepts Overview SMC Market Blueprint is a comprehensive institutional-grade indicator designed to decode the true structure of the market using Smart Money Concepts (SMC) and ICT (Inner Circle Trader) methodology. It maps the internal market framework — identifying structure shifts, liquidity zones, and order flow transitions across multiple timeframes — giving traders a clear blueprint of how institution
概要 外国為替や金融市場では、迅速な反応と正確な意思決定が非常に重要です。しかし、標準のMetaTrader 5端末は最小でも1分のチャートしかサポートしておらず、トレーダーが市場の変動に敏感であることを制限しています。この問題を解決するために、 秒単位チャートキャンドルインジケーター を導入しました。このインジケーターを使用すれば、1秒から30秒の市場の動向をサブチャートで簡単に表示・分析できます。 主な機能 複数の秒単位タイムフレームのサポート :このインジケーターは、以下のタイムフレームを選択でき、さまざまな取引戦略に対応します: S1 : 1秒 S2 : 2秒 S3 : 3秒 S4 : 4秒 S5 : 5秒 S10 : 10秒 S15 : 15秒 S20 : 20秒 S30 : 30秒 リアルタイム更新 :秒単位チャートはリアルタイムで更新され、各瞬間に最新の市場情報を提供します。これにより、迅速な取引判断が可能になります。 ユーザーフレンドリーなインターフェース :インジケーターはサブチャートに表示され、直感的で使いやすいです。異なるタイムフレームに素早く切り替えて市場を迅速
AMSV Zones
Alex Amuyunzu Raymond
AMSV Zones - Adaptive Market Structure + Volatility Zones Stop trading blind support/resistance levels. Start trading zones that adapt to real market conditions. AMSV Zones combines multi-timeframe market structure analysis with volatility-adaptive zones to identify high-probability trading opportunities. Unlike traditional indicators using fixed levels, AMSV automatically adjusts zone widths based on current ATR, ensuring relevance during both calm and volatile periods. KEY FEATURES 1. Mu
The Hi Lo Breakout is taken from the concept of the ZZ Scalper EA which exploits the inevitable behaviour of price fluctuations and breakouts.  The fact that because market prices will always fluctuate to higher highs before ebbing down to lower lows, breakouts will occur. But here I've added a few more filters which I see work well also as an Indicator.    Range Analysis :    When price is within a tight range this Indicator will be able to spot this and only then look for price breaks. You
DirectionBias4 Pro
Luigi Salvatores Buigues Morillo
DirectionBias4 Pro is an institutional-grade algorithmic trading system designed for serious traders and Prop Firm challengers. Unlike traditional indicators that rely on a single lagging moving average, DB4 Pro uses an advanced Weighted Scoring Engine to evaluate the market from three different dimensions simultaneously, filtering out fake breakouts and market noise. Developed by Luis Buigues (binaryoption.cloud), this system has been rigorously backtested and Out-Of-Sample validated. Core S
AlgoKing Chandelier Exit Indicator (MT5) The Chandelier Exit Indicator is a volatility based indicator that maximizes returns using the Average True Range (ATR) value and the highest high or lowest low of a period. Benefits Should be used as a trailing stop. Helps you exit a position when you have a respectable profit. Identifies a high probability of a trend reversal when the price moves against the prevailing trend by a distance equal to 3x the average volatility. Join the AlgoKing Lightning
About indicator > The indicator is a function based on one value (open/high prices up to now) and then it is a mathematical representation of the whole function that is totally independent from any else values. So, if you ask yourself will the future be as it is on the graph... I can tell you - as it was the same as the trading function up to the moment "now"... In conclusion, the point of the indicator is  to try to show the future of the trading function into eternity. The graphic is sometime
If you are unsure how to use this indicator, please feel free to reach out to me. I will explain it to you and provide reading materials to help you make the most of it. TD Sequential Scanner: An Overview The TD Sequential scanner is a powerful technical analysis tool designed to identify potential price exhaustion points and trend reversals in financial markets. Developed by Tom DeMark, this method is widely used by traders to gauge market cycles and potential turning points with precision. Ho
このプロダクトを購入した人は以下も購入しています
Azimuth Pro
Ottaviano De Cicco
5 (6)
発売プロモーション Azimuth Proは先着100名様限定で 299ドル でご提供します。最終価格は 499ドル となります。 リテールとインスティテューショナルのエントリーの違いはインジケーターではなく、ロケーションにあります。 多くのトレーダーは、モメンタムを追いかけたり、遅行シグナルに反応して、任意の価格レベルでエントリーします。機関投資家は、需給が実際にシフトする構造的なレベルに価格が到達するのを待ちます。 Azimuth Proはこれらのレベルを自動的にマッピングします:スイングアンカーVWAP、マルチタイムフレーム構造ライン、高確率ロケーションにのみ出現するABCパターン。 Azimuth Proは、構造分析とインテリジェントな自動化の両方を求めるプロフェッショナルトレーダー向けに構築されています。 Azimuthが外科的精度で市場構造をマッピングする一方、Azimuth Proはインテリジェンスレイヤーを追加します:トレーディングスタイルの自動検出、スマート設定された移動平均線、20年のデータでバックテストされた最適化パラメータ。その結果、お使いの銘柄と
このインジケーターを購入された方には、以下の特典を 無料 で提供しています: 各トレードを自動で管理し、ストップロスとテイクプロフィットを設定し、戦略ルールに基づいてポジションを決済する補助ツール 「Bomber Utility」 様々な銘柄に合わせたインジケーターの設定ファイル(セットファイル) 「最小リスク」、「バランスリスク」、「待機戦略」 の3つのモードで使用できる Bomber Utility 用の設定ファイル このトレーディング戦略をすぐに導入・設定・開始できる ステップバイステップのビデオマニュアル ご注意: 上記の特典を受け取るには、MQL5のプライベートメッセージシステムを通じて販売者にご連絡ください。 オリジナルのカスタムインジケーター 「Divergence Bomber(ダイバージェンス・ボンバー)」 をご紹介します。これは、MACDのダイバージェンス(乖離)戦略に基づいた 「オールインワン」型のトレーディングシステム です。 このテクニカルインジケーターの主な目的は、価格とMACDインジケーターの間に発生するダイバージェンスを検出 し、将来の価格の動きを示す
Entry In The Zone and SMC Multi Timeframe is a real-time market analysis tool developed based on Smart Money Concepts (SMC). It is designed to analyze market structure, price direction, reversal points, and key zones across multiple timeframes in a systematic way. The system displays Points of Interest (POI) and real-time No Repaint signals, with instant alerts when price reaches key zones or when signals occur within those zones. It functions as both an Indicator and a Signal System (2-in-1), c
RelicusRoad Pro: 定量的市場オペレーティングシステム 【期間限定】無制限アクセス 70% OFF - 2,000人超のトレーダーと共に なぜ多くのトレーダーは「完璧な」インジケーターを使っても失敗するのでしょうか? それは、文脈を無視して 単一の概念 だけでトレードしているからです。文脈のないシグナルは単なるギャンブルです。勝ち続けるには、 根拠の重なり(コンフルエンス) が必要です。 RelicusRoad Proは単なる矢印インジケーターではありません。完全な 定量的市場エコシステム です。独自のボラティリティモデリングを用いて、価格が推移する「適正価値の道(Fair Value Road)」をマッピングし、ノイズと真の構造的ブレイクを判別します。 推測はやめましょう。機関投資家レベルの「ロード・ロジック」でトレードを。 コアエンジン:「Road」アルゴリズム システムの中心となる Road Algo は、市場環境にリアルタイムで適応するダイナミックなボラティリティチャネルです。 安全ライン(平衡点) と、価格が数学的に反転しやすい 拡張レベル を投影します。 Si
CGE Trading Suite
Carl Gustav Johan Ekstrom
5 (1)
CGE Trading Suite delivers the analytical edge typically reserved for professional trading desks. The platform integrates a full suite of analytical tools into one seamless workflow: dynamic grid mapping, liquidity behavior analysis, ECM, trend lines, MIDAS, trade cycles, and directional channel projections. Together, these provide a unified view of market structure and momentum. Directional clarity is further enhanced by the capital flow index, which measures currency basket strength to identif
このインジケーターを購入すると、プロ仕様のトレードマネージャーを無料で差し上げます。 まず第一に、このトレーディングシステムがノンリペイント、ノンリドロー、ノンラグのインジケーターであることを強調する価値がある。これにより、手動取引とロボット取引の両方に理想的なものになっています。 オンラインコース、マニュアル、プリセットのダウンロード。 「スマートトレンドトレーディングシステム MT5」は、新規および経験豊富なトレーダー向けにカスタマイズされた包括的なトレーディングソリューションです。10以上のプレミアムインジケーターを組み合わせ、7つ以上の堅実なトレーディング戦略を備えており、多様な市場状況に対応する多目的な選択肢となっています。 トレンドフォロー戦略:トレンドを効果的に乗り越えるための正確なエントリーとストップロス管理を提供します。 リバーサル戦略:潜在的なトレンドの反転を特定し、トレーダーがレンジ相場を活用できるようにします。 スキャルピング戦略:高速で正確なデイトレードおよび短期取引のために設計されています。 安定性:すべてのインジケーターはノンリペイント、ノンリドロー、ノ
FX Trend NG:次世代マルチマーケット・トレンドインテリジェンス 概要 FX Trend NG は、複数の時間足に対応したプロフェッショナル向けトレンド分析およびマーケット監視ツールです。 市場全体の構造を数秒で把握することができます。 複数のチャートを切り替える必要はありません。どの銘柄がトレンド中なのか、どこでモメンタムが弱まっているのか、そしてどの時間足で強い整合性があるのかを瞬時に確認できます。 ローンチ特別オファー – FX Trend NG を $30(6ヶ月) または $80 永久ライセンス でご利用いただけます。 すでに Stein Investments のユーザーですか? -> メッセージを送信 して、プライベートグループへアクセスしてください。 セットアップや詳細情報が必要ですか? -> Stein Investments 公式ページ をご覧ください。 1. FX Trend NG が他と異なる理由 3ステート・トレンドロジック ― Buy と Sell だけではない • 多くのインジケーターは Buy または Sell の2状態のみを表示します。
Meridian Pro
Ottaviano De Cicco
5 (1)
Meridian Pro:MT5用プロフェッショナル・マルチタイムフレーム・トレンドマトリックス 概要 Meridian Pro は Merkava Labs が開発したマルチタイムフレーム・トレンドマトリックスで、方向性の状態、強度、モメンタムの状況、マトリックスの合意をひとつのコンパクトなパネルに集約します。ひとつのアダプティブエンジンがM1からW1まで一貫して適用されます。シンボルごとの調整は不要。インジケーターの積み重ねも不要。すべてのアセットとすべてのタイムフレームをカバーするひとつの構造化された読み取りです。 発売キャンペーン — Meridian Proを USD 99 (導入価格)で入手。通常価格:USD 149 。 1. Meridian Proが他と異なる理由 ひとつのエンジン、バラバラなインジケーターのダッシュボードではない 多くのMTFダッシュボードは、タイムフレームごとに生のインジケーター値を繰り返すだけです。Meridian Proはマトリックス全体でひとつのアダプティブ・トレンドエンジンを使用するため、パネルの各行が同じ構造化フレームワークから導出されます
トレンド スクリーナー インジケーターでトレンド取引の力を解き放ちます。ファジー ロジックと複数通貨システムを活用した究極のトレンド取引ソリューションです。 ファジー ロジックを活用した革新的なトレンド インジケーターである Trend Screener を使用して、トレンド取引を向上させます。 これは、13 を超えるプレミアム ツールと機能、および 3 つの取引戦略を組み合わせた強力なトレンド追跡インジケーターであり、Metatrader をトレンド アナライザーにする多用途の選択肢となります。 期間限定オファー : トレンド スクリーナー インジケーターは、わずか 100 ドルで生涯ご利用いただけます。 (元の価格 50$ ) (オファー延長) Trend Screener の 100% 非再描画精度の揺るぎない精度を体験して、取引の決定が過去の価格変動の影響を受けないようにしてください。 マルチタイムフレームおよびマルチ通貨機能の多用途性を解放し、比類のない自信を持って外国為替、商品、暗号通貨、インデックスの世界を取引できるようにします。 Trend Screener の包括的な
まず第一に、この取引インジケーターは再描画されず、再描画されず、遅延しないことを強調する価値があります。これにより、手動取引とロボット取引の両方に理想的なものになります。 ユーザーマニュアル:設定、入力、戦略。 アトミックアナリストは、価格の強さとモメンタムを利用して市場でより良いエッジを見つけるためのPA価格アクションインジケーターです。ノイズや誤ったシグナルを除去し、取引ポテンシャルを高めるための高度なフィルターを備えています。複雑なインジケーターの複数のレイヤーを使用して、アトミックアナリストはチャートをスキャンし、複雑な数学的計算をシンプルなシグナルと色に変換します。これにより、どのような初心者トレーダーでも理解して使用し、一貫した取引の決定を行うことができます。 「アトミックアナリスト」は、新規および経験豊富なトレーダー向けにカスタマイズされた包括的な取引ソリューションです。プレミアムインジケーターとトップノッチの機能を1つの取引戦略に組み合わせ、すべてのタイプのトレーダーにとって汎用性のある選択肢にします。 デイリートレーディングとスキャルピング戦略:高速で正確なデイ
マーケットメーカーのためのツール。 Meravith は次の機能を提供します: すべての時間足を分析し、現在有効なトレンドを表示します。 強気と弱気の出来高が等しくなる流動性ゾーン(出来高均衡)を強調表示します。 異なる時間足のすべての流動性レベルをチャート上に直接表示します。 テキスト形式の市場分析を生成し、参考情報として表示します。 現在のトレンドに基づいて目標値、サポートレベル、ストップロスを計算します。 取引のリスクリワード比を算出します。 口座残高に基づいてポジションサイズを計算し、潜在的な利益を推定します。 また、市場に大きな変化があった場合には警告を表示します。 インジケーターの主要ライン: 強気/弱気の出来高エグゾーストライン ― 目標値として機能します。 市場のトレンドを示すライン。市場が強気か弱気かによって色が変わり、トレンドのサポートとして機能します。主にその色が市場センチメントを示します。 出来高均衡ライン(Eq)。Eq(Volume Equilibrium)ラインはシステムの中核です。これは買い手と売り手の出来高のバランスポイントを表します。市場の流動性を示し
OmniSync Projection
Antonio-alin Teculescu
5 (1)
Chronos Fractal Engine is an innovative price projection indicator for MetaTrader 5, designed to transform your technical analysis by intelligently identifying and projecting historical price patterns. Built upon an advanced correlation algorithm and the fractal principles of the market, this powerful tool visualizes potential future price movements, giving you a unique edge in your trading decisions. What is Chronos Fractal Engine? At its core, the Chronos Fractal Engine employs a sophisticat
ARICoin is a powerful trading companion designed to generate high-probability entry signals with dynamic TP/SL/DP levels based on volatility. Built-in performance tracking shows win/loss stats, PP1/PP2 hits, and success rates all updated live. Key Features: Buy/Sell signals with adaptive volatility bands Real-time TP/SL/DP levels based on ATR Built-in MA Filter with optional ATR/StdDev volatility Performance stats panel (Success, Profit/Loss, PP1/PP2) Alerts via popup, sound, push, or email Cust
Quantum TrendPulse を ご紹介します。これは、   SuperTrend   、   RSI   、および Stochastic のパワーを 1 つの包括的なインジケーターに組み合わせて、取引の可能性を最大限に引き出す究極の取引ツールです。精度と効率を求めるトレーダー向けに設計されたこのインジケーターは、市場のトレンド、勢いの変化、最適なエントリー ポイントとエグジット ポイントを自信を持って特定するのに役立ちます。 主な特徴: SuperTrend 統合: 現在の市場動向に簡単に追従し、収益性の波に乗ることができます。 RSI精度: 買われすぎと売られすぎのレベルを検出し、市場の反転のタイミングに最適で、SuperTrendのフィルターとして使用されます。 確率的精度: 確率的振動を活用して、変動の激しい市場で隠れたチャンスを見つけます。SuperTrend のフィルターとして使用されます。 マルチタイムフレーム分析:   M5 から H1 または H4 まで、さまざまなタイムフレームで市場を常に把握します。 カスタマイズ可能なアラート: カスタム取引条件が満たされ
Currency Strength Dashboard Pro MetaTrader 5 用の リアルタイム通貨強度分析プロフェッショナルダッシュボード 。 このインジケーターは、 8つの主要通貨 (EUR、USD、GBP、JPY、CHF、AUD、CAD、NZD)の強さを計算し、 28の通貨ペア を同時に複数の時間足で分析・表示します。 ダッシュボードにより、トレーダーは 市場全体の状況を一目で把握 でき、余計な計算や複数のチャートを切り替える必要がありません。 計算方法 このインジケーターは、 高度な数学的通貨強度分析手法 に基づいています。 これは、類似インジケーターで一般的に使用されている RSIベースの手法 と比較して、より正確で客観的です。 この方法は 28の通貨ペアすべての相互関係を同時に分析 し、市場における実際の力関係をよりクリーンで偏りのない形で表示します。 リアルタイムダッシュボード メインテーブルには 8つの通貨 の完全なデータが表示されます。 Rank(順位) — 通貨の総合強度による順位。 1(最も強い)〜8(最も弱い) 。 Strength(強度) — 現在
優れたテクニカルインジケーター「Grabber」をご紹介します。これは、すぐに使える「オールインワン」トレーディング戦略として機能します。 ひとつのコードに、市場のテクニカル分析ツール、取引シグナル(矢印)、アラート機能、プッシュ通知が強力に統合されています。 このインジケーターを購入された方には、以下の特典を無料で提供します: Grabberユーティリティ:オープンポジションを自動で管理するツール ステップバイステップのビデオマニュアル:インジケーターのインストール、設定、取引方法を解説 カスタムセットファイル:インジケーターをすばやく自動設定し、最大限の成果を出すための設定ファイル 他の戦略はもう忘れてください!Grabberだけが、あなたを新たなトレードの高みへと導いてくれるのです。 Grabber戦略の主な特徴: 推奨タイムフレーム:M5〜H4 対応通貨ペア・資産:どれでも使用可能ですが、私が実際に検証した以下を推奨します(GBPUSD、GBPCAD、GBPCHF、AUDCAD、AUDUSD、AUDSGD、AUDCHF、NZDUSD、NZDCAD、EURCAD、EURUSD、E
ご紹介     Quantum Breakout PRO は 、ブレイクアウト ゾーンの取引方法を変革する画期的な MQL5 インジケーターです。 13年以上の取引経験を持つ経験豊富なトレーダーのチームによって開発されました。     クォンタム ブレイクアウト プロ   は、革新的でダイナミックなブレイクアウト ゾーン戦略により、あなたのトレーディングの旅を新たな高みに押し上げるように設計されています。 クォンタム ブレイクアウト インジケーターは、5 つの利益ターゲット ゾーンを備えたブレイクアウト ゾーン上のシグナル矢印と、ブレイクアウト ボックスに基づいたストップロスの提案を提供します。 初心者トレーダーにもプロのトレーダーにも適しています。 量子EAチャネル:       ここをクリック 重要!購入後、インストールマニュアルを受け取るためにプライベートメッセージを送ってください。 推奨事項: 時間枠: M15 通貨ペア: GBPJPY、EURJPY、USDJPY、NZDUSD、XAUUSD アカウントの種類: ECN、Raw、またはスプレッドが非常に低い R
FX Power: 通貨の強弱を分析して、より賢い取引を実現 概要 FX Power は主要通貨と金の実際の強弱をあらゆる市場状況で理解するための必須ツールです。強い通貨を買い、弱い通貨を売ることで、 FX Power は取引の意思決定を簡素化し、高い確率の取引機会を見出します。トレンドを追従する場合でも、極端なデルタ値を使用して反転を予測する場合でも、このツールはあなたの取引スタイルに完全に適応します。ただ取引するだけではなく、 FX Power で賢く取引をしましょう。 1. なぜ FX Power がトレーダーにとって非常に有益なのか 通貨と金のリアルタイム強弱分析 • FX Power は主要通貨と金の相対的な強弱を計算し、マーケットダイナミクスに関する明確な洞察を提供します。 • どの資産がリードしているか、または後れを取っているかを監視して、取引するペアを賢く選びましょう。 マルチタイムフレームの包括的なビュー • 短期、中期、長期のタイムフレームで通貨と金の強弱を追跡し、マーケットトレンドに基づいて取引戦略を調整できます。 • スキャルピングからスイングトレード
Bill Williams Advanced is designed for automatic chart analysis using Bill Williams' "Profitunity" system. The indicator analyzes four timeframes at once. Manual (Be sure to read before purchasing) Advantages 1. Analyzes the chart using Bill Williams' "Profitunity" system. Signals are displayed in a table in the corner of the screen and on the price chart. 2. Finds all known AO and AC signals, as well as zone signals. Equipped with a trend filter based on the Alligator. 3. Finds "Divergence Bar
現在33%オフ 初心者にもエキスパートトレーダーにも最適なソリューション このインジケーターは独自の機能と新しい公式を多数内蔵しており、ユニークで高品質かつ手頃な取引ツールです。このアップデートでは、2つの時間枠ゾーンを表示できるようになります。より長いTFだけでなく、チャートTFとより長いTF(ネストゾーンを表示)の両方を表示できます。すべてのSupply Demandトレーダーの皆さんのお気に召すはずです。:) 重要情報の公開 Advanced Supply Demandの可能性を最大化するには、 https://www.mql5.com/ja/blogs/post/720245 にアクセスしてください。   エントリーまたはターゲットの正確なトリガーポイントを正確に特定できれば取引がどのように改善されるか想像してみてください。新しい基盤となるアルゴリズムに基づいて構築されているため、買い手と売り手の間の潜在的な不均衡をさらに簡単に特定できます。これは、最も強い需要と供給のゾーンと、過去のパフォーマンス(古いゾーンを表示)がグラフィカルに表現されるためです。これらの機能は、最適な
このインジケーターは、反転ポイントと価格戻りゾーンを正確に表示します。     主要プレーヤー 。新たなトレンドが形成される場所を把握し、最大限の精度で意思決定を行い、すべての取引をコントロールします。 TREND LINES PRO インジケーターと組み合わせることで、その潜在能力を最大限に発揮します。 VERSION MT4 インジケーターが示す内容: 新しいトレンドの始まりに活性化する反転構造と反転レベル。 リスクと報酬の比率を最小限に抑えた利益 確定 と 損失停止の レベルの表示     RR 1:2   。 インテリジェントな削減ロジックによるストップロス。 指定されたインジケーターから 2 つのトレンド タイプの反転パターンを表示します。 指標: トレンドを追う   TREND LINES PRO   (世界的なトレンドの変化) TREND PRO   (クイックトレンド変更) シンプルで効果的   スキャナー   リアルタイムトレンド(新機能)。 マルチタイムフレームのインストゥルメント フィルタリング。 画面   利益     LOGIC AI信号の後。 当日プラス方
あなたのシンボルでどの戦略が実際に機能するか確認しましょう - リアルマネーをリスクにさらす前に。 Power Barは、あらゆるシンボルとあらゆるタイムフレームで 極端な価格バー を検出し、3つの異なるトレード戦略を即座にバックテストします。勝率、プロフィットファクター、損益を並べて比較できます。すべてが1つのインタラクティブなパネルに集約されています。 推測なし。カーブフィッティングなし。データだけです。 Power Barが特別な理由 ほとんどのインジケーターはシグナルを出すだけで、それが機能するかどうかは推測に任されます。Power Barはさらに先を行きます - すべてのシグナルを 3つの戦略 に対してテストし、統計を表示します。FlipFlop、Momentum、Reversalをワンクリックで切り替え、数値が即座に変化するのを確認できます。 FlipFlop - 常にポジションを保有。シグナルでエントリーし、反対シグナルでイグジット。当社のリサーチでは、US30、US500、DAXなどのトレンドのあるインデックスで最も効果的です。 Momentum - シグナルの方向に
Gold Sniper Scalper Pro は、XAUUSD における ダマシブレイクアウト(false breakout)パターンの検出に特化した MetaTrader 5 用インジケーターです。価格がレンジの境界を突破してブレイクアウトトレーダーを誘い込み、その後反転してレンジ内に戻る4本バーのトラップ構造を識別します。インジケーターは各セットアップを17の品質要素で採点し、4層コンフルエンスパイプラインで評価し、7タイムフレームトレンドコンセンサスエンジンで検証し、ゴールドボラティリティレジーム分類器でフィルタリングします。すべてシグナルがチャートに表示される前に完了します。 詳細なユーザーガイドは、著者の   MQL5 ブログ   で入手できます。追加の更新は、著者の   MQL5 チャンネル   を通じて入手可能です。 現在のサポートポリシーに基づき、購入者は著者が開発した選定コンパニオンツールへの追加アクセスを受けることができます。 Forex通貨ペア、インデックス、暗号資産でも動作しますが、検出パラメーター、ボラティリティ処理、フィルターロジックはXAUUSD
ARIPoint is a powerful trading companion designed to generate high-probability entry signals with dynamic TP/SL/DP levels based on volatility. Built-in performance tracking shows win/loss stats, PP1/PP2 hits, and success rates all updated live. Key Features: Buy/Sell signals with adaptive volatility bands Real-time TP/SL/DP levels based on ATR Built-in MA Filter with optional ATR/StdDev volatility Performance stats panel (Success, Profit/Loss, PP1/PP2) Alerts via popup, sound, push, or email Cu
Trend Hunter は、外国為替、仮想通貨、CFD 市場におけるトレンド指標です。 このインジケーターの特別な特徴は、価格がトレンドラインをわずかに突き抜けたときにシグナルを変更することなく、自信を持ってトレンドに従うことです。 インジケーターは再描画されず、バーが閉じた後に市場に参入するシグナルが表示されます。 トレンドに沿って移動すると、インジケーターにはトレンドの方向に追加のエントリーポイントが表示されます。 これらのシグナルに基づいて、小さなストップロスで取引できます。 トレンドハンターは正直な指標です。 インジケーター信号の上にマウスを置くと、信号の潜在的な利益と可能なストップが表示されます。 新しい信号が表示されると、次の通知を受け取ることができます。 アラート プッシュ通知 メールによる通知 電報での通知 チャートのスクリーンショットも Telegram に送信されるため、取引を決定するために端末を開く必要はありません。 インジケーターシグナルは、電報チャネル https://www.mql5.com/ja/market/product/11085#!ta
AriX
Temirlan Kdyrkhan
1 (4)
AriX Indicator for MT5 A powerful trend-following and signal-evaluation tool AriX is a custom MT5 indicator that combines Moving Averages and ATR-based risk/reward logic to generate clear buy/sell signals. It visualizes dynamic SL/TP levels, evaluates past trade outcomes, and displays win/loss statistics in a clean on-chart panel. Key features include: Buy/Sell signals based on MA crossovers ATR-based SL/TP1/TP2/TP3 levels with visual lines and labels Signal outcome tracking with real-time stat
The Trend Forecaster indicator utilizes a unique proprietary algorithm to determine entry points for a breakout trading strategy. The indicator identifies price clusters, analyzes price movement near levels, and provides a signal when the price breaks through a level. The Trend Forecaster indicator is suitable for all financial assets, including currencies (Forex), metals, stocks, indices, and cryptocurrencies. You can also adjust the indicator to work on any time frames, although it is recommen
Matrix Arrow Indicator MT5
Juvenille Emperor Limited
5 (19)
マトリックスアローインジケーターMT5は、すべてのシンボル/商品(外国為替、商品、暗号通貨、インデックス、株式)で使用できる100%再描画されていないマルチタイムフレームインジケーターに続くユニークな10in1トレンドです。マトリックスアローインジケーターMT5は、初期段階で現在のトレンドを判断し、最大10の標準インジケーターから情報とデータを収集します。 平均方向移動指数(ADX) 商品チャネルインデックス(CCI) クラシック平研アシキャンドル 移動平均 移動平均収束発散(MACD) 相対活力指数(RVI) 相対力指数(RSI) 放物線SAR ストキャスティクス ウィリアムズのパーセント範囲 すべてのインジケーターが有効な買いまたは売りシグナルを与えると、対応する矢印がチャートに印刷され、次のろうそく/バーの開始時に強い上昇トレンド/下降トレンドを示します。ユーザーは、使用するインジケーターを選択し、各インジケーターのパラメーターを個別に調整できます。マトリックスアローインジケーターMT5は選択されたインディケーターからのみ情報を収集し、それらのデータのみに基づいてアローを印刷
MACD Intraday Trend PROは、1960年代にGeraldAppelによって作成された元のMACDを応用して開発されたインジケーターです。 長年の取引を通じて、MACDのパラメーターをフィボナッチの比率で変更することにより、トレンドの動きの連続性をより適切に表現できることが観察され、価格トレンドの開始と終了をより効率的に検出できるようになりました。 価格トレンドの検出が効率的であるため、トップとボトムの相違を非常に明確に識別し、取引機会をより有効に活用することもできます。 特徴 インディケータMACD日中トレンドPROは、任意の通貨ペア、任意の時間枠、および練行足チャートで機能します。 5つのモードを選択することにより、トレンド検出速度を設定することができます。 最速 速い 正常 スロー 最も遅い 資力 6つの構成可能なアラートがあります。 MACDがシグナルラインを引き戻す MACDが信号線を横切る MACDがレベル0を超える 信号線がレベル0を超えています MACDはトレンドカラーを変更します 信号線変更トレンドカラー アラートごとに、以下を構成できま
BTMM State Engine Pro is a MetaTrader 5 indicator for traders who use the Beat The Market Maker approach: Asian session context, kill zone timing, level progression, peak formation detection, and a multi-pair scanner from a single chart. It combines cycle state logic with a built-in scanner dashboard so you do not need the same tool on many charts at once. What it does Draws the Asian session range; session times can follow broker server offset or be set in inputs. Tracks level progression (L
作者のその他のプロダクト
Bull Bear Easy MTF
Naththapach Thanakulchayanan
This indicator, Bull Bear Easy MTF, summarise the strength color graphic and percentage of power for both  Bull and Bear in current market emotion stage which will show you in multi time frames and sum of the total Bull and Bear power strength which is an important information for traders especially you can see all Bull and Bear power in visualized graphic easily, Hope it will be helpful tool for you for making a good decision in trading.
This MT4 indicator, Bull Bear Visual MTF (9 Time Frames), summarize the strength color graphic and percentages of power for both  Bull and Bear in current market emotion stage which will show you in multi time frames and sum of the total Bull and Bear power strength which is an important information for traders especially you can see all Bull and Bear power in visualized graphic easily, Hope it will be helpful tool for you for making a good decision in trading.
This MT4 indicator, Bull Bear Visual MTF V2, summarize the strength color graphic and percentages of power for both  Bull and Bear in current market emotion stage which will show you in multi timeframes (9) and sum of the total Bull and Bear power strength which is an important information for traders especially you can see all Bull and Bear power in visualized graphic easily, Hope it will be helpful tool for you for making a good decision in trading.
This MT4 indicator, Stochastic Visual MTF, summarize the oscillator values in color graphic for both  Main and Signal in current market emotion stage which will show you in multi timeframes (9) and sum of the total Main and Signal oscillator values which is an important information for traders especially you can see all oscillator values in visualized graphic easily, You can add more by Shift, Hope it will be helpful tool for you for making a good decision in trading.
Rsi Visual MTF for MT4
Naththapach Thanakulchayanan
This MT4 indicator, Rsi Visual MTF, summarize the oscillator values in color graphic in current market emotion stage which will show you in multi timeframes (9) and sum of the total Rsi oscillator values which is an important information for traders especially you can see all oscillator values in visualized graphic easily, Hope it will be helpful tool for you for making a good decision in trading.
Bar Direction, This indicator is created for MetaTrader 4, It will show you strength of bar directions which you can add more options of bar as adjustable requirement such as Bar Timeframe, Bar Shift, Bar Period and also you can set true or false for Signal Alert to your Popup, Email or Push Notice and more of more you can set to show guideline for entry point according to your adjustable options also Ask-Bid and Spread Showing. It will be your assistance for reading bar strength direction easil
This MT4 indicator can show you Dynamic Support and Resistance Zone in current stage based on Current MA Price in 9 Timeframes, Price Lines or Price Zones for Multi (9) Timeframes according to the setting options as you need which you can set such as MA Period, MA Method, MA Shift, MA Price and you will see price lines all 9 timeframes or you can show Price Zones and also you can hide Minutes timeframes and several setting as you want and You can add several MA Periods in your chart such as 50,
This MT5 indicator, Bull Bear Visual MTF V2, summarize the strength color graphic and percentages of power for both  Bull and Bear in current market emotion stage which will show you in multi timeframes (21) and sum of the total Bull and Bear power strength which is an important information for traders especially you can see all Bull and Bear power in visualized graphic easily, Hope it will be helpful tool for you for making a good decision in trading.
Bar Direction, This indicator is created for MetaTrader 5, It will show you strength of bar directions which you can add more options of bar as adjustable requirement such as Bar Timeframe, Bar Shift, Bar Period and also you can set true or false for Signal Alert to your Popup, Email or Push Notice and more of more you can set to show guideline for entry point according to your adjustable options also Ask-Bid and Spread Showing. It will be your assistance for reading bar strength direction easil
フィルタ:
レビューなし
レビューに返信