YouTubeにあるマーケットチュートリアルビデオをご覧ください
ロボットや指標を購入する
仮想ホスティングで
EAを実行
EAを実行
ロボットや指標を購入前にテストする
マーケットで収入を得る
販売のためにプロダクトをプレゼンテーションする方法
MetaTrader 4のためのエキスパートアドバイザーとインディケータ - 23
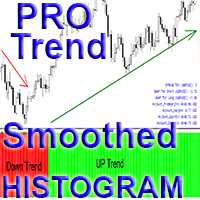
Crypto_Forex MT4用インジケーター「 Pro Smoothed Trend Histogram 」(リペイント不要)
- Pro Smoothed Trend Histogramは、標準的な移動平均線クロスよりもはるかに効率的です。 - 特に大きなトレンドの検出に特化しています。 - インジケーターは2色で表示されます。赤は下降トレンド、緑は上昇トレンドです(色は設定で変更できます)。 - モバイルとPCの両方でアラート機能を搭載しています。 - このインジケーターは、プライスアクション、スキャルピング、モメンタムトレード、その他のインジケーターなど、他の取引手法と組み合わせるのに最適です。 - インジケーターにはスプレッド・スワップ情報表示機能があり、接続されたFXペアの現在のスプレッドとスワップを表示します。 - 画面には口座残高、エクイティ、マージンも表示されます。 - スプレッド・スワップ情報表示機能は、チャートの任意の場所に配置できます。 0 - 左上隅、1 - 右上隅、2 - 左下隅、3 - 右下隅。
// 優れたトレーディングロボットとインジケーターは

「 ZigZag on Trend 」インジケーターは、価格の動向を判断するのに役立つだけでなく、バーとピップの計算機能も備えています。このインジケーターは、トレンドインジケーター、価格の方向性を示すジグザグのトレンドライン、そしてトレンド方向に通過したバーの数と垂直方向のピップ数(バーの始値に基づいて計算)を計算するカウンターで構成されています。このインジケーターは再描画されません。便宜上、色付きのバーまたはラインで表示されます。すべての時間枠で使用できますが、M5以上の時間枠で最も効果的です。
「 Period 」は、価格の方向性を判断するためのバーの数を決定します。これは、一方向への平滑化されたトレンドを得るために、方向の長さを計算します。
「 Diapason 」は、トレンドの方向性の頻度を調整します。主に、異なる取引商品の最初のパラメータを調整するために使用します(EURUSDの場合は最大約10、GOLDの場合は最大約100)。
ピップカウンターは、あらゆる時間枠と取引商品での調整に役立ちます。
主なインジケーターパラメータ
「 Period 」 - トレンドの継

支持線と抵抗線、そしてローソク足のギャップをチャート上に自動的に表示するため、価格が次に向かう可能性のある場所や反転する可能性のある場所を確認することができます。
このインジケーターは、私のウェブサイト(The Market Structure Trader)で教えているポジショントレード手法の一部として使用するように設計されており、ターゲットとエントリーの可能性のための重要な情報を表示します。
このインジケーターには、2つのコア機能と4つの追加機能があります: コア機能1 - 日足、週足、月足のサポートラインとレジスタンスラインの自動表示 このインジケーターは、直近2日間、最大6週間前、数ヶ月前のサポートレベルとレジスタンスレベルを自動的に引き込みます。これらのレベルの見た目は完全にカスタマイズすることができ、いくつ表示されるかを表示することもできます。これらの重要な水準は、しばしば主要な支持線と抵抗線として機能し、価格が転換して引き戻されたり反転したりする場所です。また、価格が向かうターゲットでもあるため、価格が転換する前に、取引に利用できる潜在的な距離を素早く確認することが

インディケータはチャート上にラウンドレベルを示します。 それらは、心理的、銀行的、または主要なプレーヤーレベルとも呼ばれます。 これらのレベルでは、強気と弱気の間に真の戦いがあり、多くの注文が蓄積され、ボラティリティの増加につながります。 インジケーターは、任意の楽器と時間枠に自動的に調整されます。 レベル80を突破してテストすると、購入します。レベル20を突破してテストすると、販売されます。ターゲットは00です。 注意。強力なサポートとレジスタンスレベルのため、価格は00レベルをわずかに下回る可能性があります。
入力パラメータ 。
Bars Count - 線の長さ 。 Show 00 Levels - 00レベルを表示するかしないか 。 Show 10, 90 Levels 。 Show 20, 80 Levels 。 Show 30, 70 Levels 。 Show 40, 60 Levels 。 Show 50 Levels 。 N Lines - チャートのレベル数を制限するパラメーター 。 Distance 00 Levels - レ
FREE
MT5 Version Advanced Range Breakout
Advanced Range Breakout allows you to trade breakouts in an impossible way for any human being. This EA focuses on entering breakouts as soon as the price moves over them, keeping a tight trailing stop loss (TSL) to catch as much as possible of breakouts' characteristic explosive price movements while protecting the trade if it turns out to be a fakeout. Feel free to get in touch we me to find out how I successfully managed to passed a prop firm challenge

Auto Fibonacci Retracement Indicator — Flexible and Reliable This is not just another Auto Fibonacci Retracement indicator — it’s one of the most flexible and dependable tools available . If you find it useful, please leave a review or comment to support the project. Check out my other helpful tools below: Timeframes Trend Scanner - Scan the trend of assets in difference timeframes with multiple indicators
Market Trend Scanner - Scan the trend of multiple-assets in with multiple indicators
FREE

This very new indicator is able to unlock all advanced features of MetaTrader 4 (above build 600). This indicator can graphically represent the main data of the current account (balance, equity, free margin, current Profit/Loss, total Profit/Loss, amount of open position(s) & size, etc.) in an elegant way. On the chart AccountInfo graphically shows the account balance of recent days. Also all data can be filtered with MagicNumber, Order Comment, and symbol for the professional evaluation of a sp
FREE

Flag Pattern Indicator - Your Guide to Flagging Profitable Trade Setups Welcome to the world of precision trading with the "Flag Pattern Indicator." Designed for MetaTrader, this powerful tool is your go-to solution for identifying one of the most reliable and versatile chart patterns in technical analysis: the flag pattern. Whether you're a seasoned trader or just starting, this indicator simplifies the process of spotting flag patterns, giving you an edge in your trading decisions. Key Feature
FREE

フォレックス取引のシャーロック・ホームズになる準備はできていますか?️️ 究極のトレーディングツール、 Lisek Levels and Channels インジケーターの登場です!!! サーカスの芸のように複数のインジケーターを扱うのは忘れてください。必要なものをすべて一つの素晴らしいショーにパッケージングしました: 価格レベル?チェック済み! 価格チャネル?間違いなし! 価格VWAP?もちろん! オンバランスボリューム?全部ここにあります! そして、お楽しみはこれだけではありません!ダブルエスプレッソよりも素早く目を覚まさせるアラームとプッシュ通知!️ あなたのチャートはトレーディングチャンスの宝の地図に変身します: 現在の価格がどこにあるか、すべてのクールなレベル、チャネル、VWAPと一緒に見てください。 オンバランスボリュームを評価しましょう - ベアダンスを踊っていますか、それともブルタンゴですか?買い手と売り手、どちらが動きを持っているか見てみましょう。 フォレックスのレイブパーティーのように上下を指す矢印?これは買い手または売り手の増加するボリ
FREE

It is a custom non-repaint indicator to identify trade opportunities in swing action as prices move within an upper and lower band. Inspired by the Keltner Channel, the most popular channel Indicator introduced by Chester Keltner. It is different with a Bollinger Bands. It represents volatility using the high and low prices, while Bollinger's studies rely on the standard deviation. The algorithm for this indicator is also available in the EntryMaximator EA. Including the option to use it or not.
FREE

as the name suggest Trend Maker Master is a trend scalping indicator that give long and short trading opportunity based on price action and ma style trend filter, the indicator Trend Period and Trend Extra Filter will change arrows signals quality and frequency, this leave a space for trader to come out with good combos for each pair. How to trade : Buy : when white buy arrow prints, set sl below recent swing low, and set tp to 1-1 Risk to reward ratio. Sell : when white Sell arrow prints, set
FREE
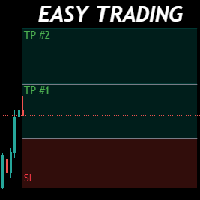
Money Management will help you to Easy Trade with One Click , instance and pending, set SL, and manage number of your TP . You can use this expert for different currency pairs, CFDs, cryptocurrency, and stocks .
The basic formula for calculating pip value and position size which has been used in this expert are:
Pipette Value = Position Size * (Exchange Rate (Base Currency) / Entry Price) * Contract Size * Digits Exp. Account Currency: USD Currency Pair: GBPJPY Position Size: 0.05 Lot = 5000
FREE

Всем привет! Советник "Calipso" за много лет перетерпел очень много изменений и модификаций. Данная версия собрала в себе лучшие апгрейды и идеи. Эксперт поддерживает много режимов торговли и его можно адаптировать под разные нужды, такие как ночной скальпинг, торговля сеткой, позиционная торговля на отбой от уровней поддержки/сопротивления и многое многое другое. Благодаря глубоким настройкам, этот советник становиться незаменимым помощником в торговле. На базе этого EA можно реализовать десят
FREE

SafeLockdown is a fully automated Expert Advisor. This EA has passed 21 years back test of real tick data (2003-2021) and (2021-2023) . The Expert Advisor does not use martingale, grids, hedging, averaging and other risky strategies. This strategy works well with the wave of ever-changing markets, which is targeting small market movements to generate profits in a short time by entering and exiting the market, taking profits from small price changes. Protected by a volatility stop loss and take

Growthamp は、独自のエントリ条件をカスタマイズしたいクライアント向けに設計されたグリッド エキスパートです。
エキスパートは、2 つの入力カスタム移動平均とオプションの確率的オシレーションを使用して取引を開始します。
次に、選択した注文管理とクローズ機能を使用して、注文を管理して利益を生み出します。
シグナルとグループチャット: https://www.mql5.com/en/users/conorstephenson 主な特長
カスタマイズ可能なエントリと取引管理。 36 種類の移動平均タイプから選択できます。 トレンドに従うか、移動平均クロスを使用してエントリーします。 取引をさらにフィルタリングするためのオプションの確率的入力。 取引を管理およびクローズするための複数の方法。 オプションのマーチンゲール モード。 オプションのヘッジロジック。 独自の戦略を作成/取引したいクライアント向けに設計されています。 広範囲の広がりと滑り防止。 株式制限 - Grow
FREE
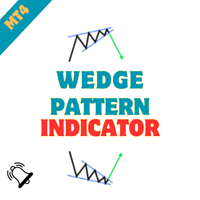
Wedge Chart Pattern Indicator - Unleash the Power of Wedge Patterns in Your Trading Embark on a journey of precision trading with the "Wedge Chart Pattern Indicator." Crafted for MetaTrader, this advanced tool is your ultimate companion for identifying wedge chart patterns, empowering you to make informed and strategic trading decisions. Whether you're a seasoned trader or just starting, this indicator simplifies the process of spotting wedge patterns, providing you with a valuable edge in the m
FREE

このエキスパートアドバイザー(100%自動)は2つのインジケーターを組み合わせて戦略を作成できます。このバージョンは「ベアバージョン」(BASICバージョン)と呼ばれ、CCIとRSIの2つのインジケーターが含まれています
簡単な個人的なメッセージで私に連絡して、選択した指標と条件を記載したEAの「ベアバージョン」(または優れたバージョン)を要求することができます。テレグラムの連絡先に移動するページの下部。
あなたにぴったりの戦略が見つからない場合、私はあなたのためにそれを作成できます(EAに基づく)
条件は明確に指定されています。
長いエントリー; CCIはレベルラインより高い/低い エントリーショート; CCIはレベルラインより高い/低い Longを終了します。 RSIがレベルラインを上/下に横切る ショートを終了します。 RSIがレベルラインを上/下に横切る テイクプロフィットとストップロスは自由に変更できます 100%自動 このEAには、「スプレッドリミット」と呼ばれる統合機能があります。この機能を使用すると、スプレッドがユーザーが決定した入力以下の場合にのみ市場に参入
FREE

As every ZigZag Indicator this Indicator Repaints . So use this only combining with other indicators or strategy.
CyberZingFx ZigZag Arrow MT4 Indicator, is one of the best tool for traders looking to identify trend reversals in the markets. This powerful indicator uses the ZigZag method to help you identify key support and resistance levels, making it easier to spot significant changes in price and filter out short-term fluctuations. With CyberZingFx ZigZag Arrow, you can quickly and easily
FREE

The Official "GRID EA" Using PipFinite Trend PRO A Smart Trend Following EA Using Trend PRO Indicator Signals In a Unique Grid Strategy. Trend Grid EA takes the signal of Trend PRO Indicator on the first trade then builds succeeding trades if the move goes against it. The innovative grid algorithm manages each position to ensure every basket is closed in a net positive profit.
LIVE ACCOUNT MONITORING Real account monitoring https://t.me/pipfinite/997
Settings Used & Input Descriptions
I
Trade donchian breakouts with complete freedom using the Flexible Breakout EA . It can trade any breakout period, any timeframe, with pending or market orders- as desired- and implements many other useful features for the exigent trader, like customizable trading sessions and a martingale mode. [ Installation Guide | Update Guide | Troubleshooting | FAQ | All Products ] Easy to use and supervise Customizable trading direction Customizable donchian breakout period It can trade using pending or m
FREE

Alan Hull's moving average, more sensitive to the current price activity than the normal MA. Reacts to the trend changes faster, displays the price movement more clearly. Color version of the indicator. Improvement of the original version of the indicator by Sergey <wizardserg@mail.ru>. Suitable for all timeframes.
Parameters Period - smoothing period, recommended values are from 9 to 64. The greater the period, the smoother the indicator. Method - smoothing method, suitable values are 0, 1, 2
FREE

Live signal: https: // www.mql5.com/en/signals/1809948?source=Site Fully automated Expert Advisor OGNSFA system . The Expert Advisor works on the basis of neural networks. There is a possibility of choosing a fixed lot and an autolot. The EA has the ability to choose the trading time. If you trade in 7 pairs, the system works normally with a minimum deposit of $ 5 000. You can use cent accounts. You will earn more if you use a broker with fewer spreads.
Recommendations An ECN account with a

Gold Island is an Expert Advisor that make your trading very smooth and safe. Following features has been added to the EA. Feature : Risk management in percent of total balance Take profit points Martingale methods Close trade in average profit Low drawdown Parameters: Take profit = Points to take profit & close trades Trade distance= From how far away the 2nd, 3rd trade to be opened. Starting lots= Trade size to be open at starting. Multiplier value= How frequently trade size should be incre
FREE

️ Currency Strength Master EA
Overview
Currency Strength Master EA is a smart, fully automated trading system that runs on a single chart (M5 timeframe) and internally analyzes 28 currency pairs to detect the strongest and weakest currencies in the market.
Based on this strength analysis and the Moving Average trend direction , the EA automatically opens trades in the correct direction to capture short-term profit opportunities.
️ How It Works
The EA continuously calculates the strength
Advanced Order Block Breaker Scanner
This Scanner is free to download but is dependent on you owning the advance order block breaker indicator. Need to purchase the indicator here: https://www.mql5.com/en/market/product/59127
MT5 version: https://www.mql5.com/en/market/product/62769
The Scanner will show you on a single chart all the timeframes (M1 to Monthly) with their own status for the indicator: advance order block breaker Scan all time frame and all symbol: breaker's smart algor
FREE

VeMAs インジケータは、出来高動態と市場構造を分析することにより、あなたの取引戦略を強化するために設計された革新的な取引ツールです。 あなたが初心者であろうと経験豊富なトレーダーであろうと、VeMAs はあなたに優位性を与えます。 インジケーター VeMAs が 50 $ ドルで入手可能。オリジナル価格 299 $
を期間限定でご提供。 購入後、私に連絡して、個人的なボーナスを入手してください! VeMAs インジケータをマルチタイムフレームにするクールなユーティリティ( VeMAs ユーティリティ MTF )を無料で入手できます!
Version MT5
Here are some blogs on the VeMAs indicator
市場の出来高と構造は、注視すべき数少ない主要な事柄である。
VeMAsは、出来高の変化と価格の動きを評価するために高度なアルゴリズムを使用しています。正確性と効率性を求めるトレーダーのために設計されています。
このインディケータは、資産の出来高の値動きを分析し、理想的なエントリーポイントを特定します。
正確なエントリーポイントにより

Этот индикатор является уникальным в своём роде, больше всего подходит для скальпинга на XAUUSD а также для торговли на более старших таймфреймах!
Уведомление сообщит самые важные точки входа, поэтому следует торговать по тренду. Идеален для скальпинга! The Best Trend Signals - трендовый мультивалютный индикатор, может использоваться на любых финансовых инструментах валюта, криптовалюта, металлы, акции, индексы. Рекомендуемый тайм-фрейм M15, M30, H1, H4, D1.
Как торговать с помощью индикатора
FREE
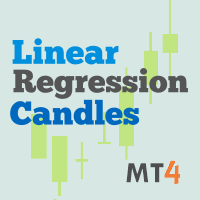
This indicator is the mql version of the Linear Regression Candles indicator. Find out more here: https://www.mql5.com/en/users/rashedsamir/seller There are many linear regression indicators out there, most of them draw lines or channels, but this one actually draws a chart.This script includes features such as linear regression for open, high, low, and close prices, signal smoothing with simple or exponential moving averages. I welcome your suggestion for improving the indicator.
To incre
FREE

Time your Entry and Exits with Average True Range (ATR) Trailing Stops ATR Trailing Stops are primarily used to protect capital and lock in profits on individual trades but they can also be used, in conjunction with a trend filter, to signal entries. The indicator will help make your calculation of stop loss easier as it will be visually aiding you in choosing where to put your stoploss level on the chart by calculating the current value of ATR indicator. For those who are unfamiliar with ATR, i
FREE

PartialAutoClose EA は、裁量トレードや手動エントリーのポジションを、半自動で柔軟に管理できるユーティリティEAです。
【主な機能と特徴】 - 自動決済ロジックを2種類から選択可能 「平均足転換」または「移動平均クロス」による自動決済 - 建値ストップ自動設定 一定の含み益達成後にストップロスを建値(または指定値)へ自動移動 - 分割決済/全決済を切り替え可能 決済ロジック発動時、1回だけ分割決済(半分のロット)、または全ロット一括決済を選択可能 - 複数ポジション管理に対応 チャート上の複数ポジションを同時に監視・自動管理 - マジックナンバー不要、裁量・手動トレードの自動化に最適 マジックナンバーでの管理は行わず、裁量・手動で建てた全ポジションを対象に動作 - 使いやすいパラメータ設計 すべての設定項目は英語名+日本語説明付きで直感的に設定可能
【こんな方におすすめ】 - 裁量エントリーの決済管理を自動化したい - トレンド転換やシグナル発生で一部だけ利確したい - 建値ストップを自動で入れたいが、裁量エントリ
FREE

「BIG FIGURE INDICATOR」は、価格チャート上で整数や半分の数字(たとえば、通貨取引での1.0000や1.5000など)など特定のレベルで自動的に水平線を識別して描画します。これらのレベルは心理的に重要であると考えられており、大口トレーダーや投資家が注目する可能性がある丸められた数字を表しており、潜在的なサポートまたはレジスタンスレベルにつながります。ビッグフィギュアインジケーターは、トレーダーが重要な価格レベルを特定し、これらのレベルに基づいて取引決定を行うのに役立ちます。
ラインはM1からH4のタイムフレームチャートにのみ表示されます。
ラインの色は入力パラメータタブで変更できます。
すべての通貨ペアで使用できます。
MT5バージョン: https://www.mql5.com/fr/market/product/96750
注意:当社のインジケーターを最適に機能させるには、まずデイリー(D1)タイムフレームを読み込む必要があります
FREE

HFT EA -Set in Pictures -DE40, US30, US500, USTEC
-IC Market Recomment Broker -EA can Trade with every Broker
only DE40 with this Standart Settings (Change the Compare Count to 3 or higher 10 for better Results) for other Indizes or Pairs Set the Stop Loss x10 to actuall Spread or higher, and Set Take Profit x40 from Spread, PriceOffset x4 from Spread or higher Recomment M5, M15, M30, H1, D1 minimum 1000$/€ ...Lot 1 in first 3 Weeks Expert have auto Lot Settings, to delete auto Lot...Set Volu
FREE
阳线开多,阴线开空! 阳线开多,阴线开空! 阳线开多,阴线开空!
阳线开多,阴线开空! 阳线开多,阴线开空!
阳线开多,阴线开空! 阳线开多,阴线开空! 阳线开多,阴线开空! 阳线开多,阴线开空!
阳线开多,阴线开空! 阳线开多,阴线开空!
阳线开多,阴线开空! 阳线开多,阴线开空! 阳线开多,阴线开空! 阳线开多,阴线开空!
阳线开多,阴线开空! 阳线开多,阴线开空!
阳线开多,阴线开空! 阳线开多,阴线开空! 阳线开多,阴线开空! 阳线开多,阴线开空!
阳线开多,阴线开空! 阳线开多,阴线开空!
阳线开多,阴线开空! 阳线开多,阴线开空! 阳线开多,阴线开空! 阳线开多,阴线开空!
阳线开多,阴线开空! 阳线开多,阴线开空!
阳线开多,阴线开空!
FREE

Summary This EA will trade semi-automatically based on trend lines or horizontal lines that are manually plotted on the chart by the user. It can handle any number of lines per chart and each line can have its own adjustable settings. This EA manages every line separately based on specific user 'keywords' set for each line. Since each line has it's own independent settings, this is why there are very few shared inputs in this EA. Doing it this way allows for a single EA to manage many lines and
FREE

プレシジョン・インデックス・オシレーター(Pi-Osc)は、Precision Trading SystemsのRoger Medcalfによるものです。
バージョン2は、チャートにスーパーファストでロードされるように注意深く再コードされ、その他の技術的な改良も組み込まれて、エクスペリエンスを向上させています。
Pi-Oscは、市場が強制的に行かなければならない、すべての人のストップを取り除くためのポイントである、極限のエクソースト・ポイントを見つけるために設計された正確な取引タイミング信号を提供するために作成されました。
この製品は、極限のポイントがどこにあるかを知るという古代の問題を解決し、トレーダーの生活をはるかにシンプルにします。
これは、業界標準のオシレーターとは異なる強力な要素を持つ高度なコンセンサス・インジケーターです。
使用されている一部の機能には、需要指数、マネーフロー、RSI、スティリング、パターン認識、出来高分析、標準偏差の極値などがあり、異なる長さでこれらのバリエーションが多く含まれています。
初めて見ると、訓練されていない目には、他のオシレーター
Auto Grid: 既存のトレードに基づいたグリッド注文の自動作成。 複雑なトレード戦略の自動化 新しいポジションを検出し、最適化された注文配列を自動的に作成する高度なグリッドシステム。 多機能ユーティリティ :66+ 機能、Auto Gridツールを含む | ご質問はこちらまで | MT5版 A. インテリジェントなトレード検出と監視: 特定シンボルまたは包括的なポートフォリオスキャン 正確な分類による高度な注文タイプ検出 戦略的監視開始:即時、遅延、または条件ベース アルゴリズム戦略互換性のためのマジックナンバー統合 B. 高度なグリッド設定: 戦略的注文配置: 複数の配置方法論 インテリジェントな方向ロジック: 同一、反対、または市場ベースの注文作成 精密な注文数量: カスタマイズ可能なグリッド密度と構造 高度なオフセットシステム: 固定間隔または動的百分比進行 包括的なレベル管理: サイズまたは価格一貫性のあるSL/TP継承 高度なロットサイジング: 固定、累進的增加、または戦略的削減 有効期限制御: カスタム時間枠または原注

With this easy to set up indicator you can display and set alerts for the following candlestick formations: Bull Breakout, Bear Breakout, Hammer, Pin, Bullish Engulfing, Bearish Engulfing. I'd appreciate if you would review the indicator
Input parameters: ShortArrowColor: The color of the Arrows, displaying a Bearish candle formation LongArrowColor: The color of the Arrows displaying a Bullish candle formation BullishEngulfing: Disabled/Enabled/EnabledwithAlert BearishEngulfing: Disabled/Enab
FREE
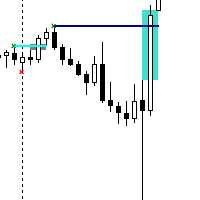
The Contraction/Expansion Breakout Indicator for MetaTrader 4 (MT4) is a powerful tool crafted to identify and signal the breakout of bullish and bearish contraction or expansion formations within financial markets. Utilizing advanced algorithmic calculations, this indicator assists traders in recognizing significant price movements that frequently accompany these formations, providing valuable insights for strategic trading decisions. Key Features: Contraction and Expansion Identification: The
FREE
This automated VOLUME SCALPING INDICATOR can be utilized to manage trades and identify potential areas of support and resistance for both buying and selling. It is designed to identify zones for Sell/Buy trades based on the volume analysis and can be effectively used in conjunction with other indicators, such as order block indicators, and more. Currently designed for MT4, it will later be adapted to function on MT5. We also offer the opportunity to customize the robot according to your trading
FREE

RT_TrendlineTool : Semi-AutoTrendline Tool on MT4 2 easy steps, just press the [T] button on your keyboard and click on the Swing High/Low that you're interested.
Then the indicator will try to draw a trendline that runs through only the wick, not cut through candlestick's body
and try to cross the swing point as much as possible with the least slope of the trendline. You can draw up to 10 trendlines.
You are able to get alert when price breakout these trendlines. Additional Hotkey : Press [M]
FREE

Are you tired of drawing trendlines every time you're analyzing charts? Or perhaps you would like more consistency in your technical analysis. Then this is for you. This indicator will draw trend lines automatically when dropped on a chart. How it works Works similar to standard deviation channel found on mt4 and mt5. It has 2 parameters: 1. Starting Bar 2. Number of bars for calculation The starting bar is the bar which drawing of the trend lines will begin, while the number of bars for c
FREE

Account Profit & Loss Killer
Full Account-Level Intelligent Risk Management EA (MT4)
⸻
Product Introduction
Account Profit & Loss Killer is an account-level risk management EA specifically designed for high-frequency trading, scalping systems, hedging, and grid strategies.
It does not participate in any trading strategy; it focuses on only one thing:
When the total floating profit or total floating loss of all positions in the account reaches your set amount, it immediately and withi
FREE

Introducing automated trading robots for the Gold and forex markets with advanced and revolutionary trading strategies. Robot Sharker is programmed based on AI algorithms and Price Action strategies to find the best trading signals, combining scalper methods and intelligent position management. Trading orders have high accuracy and outstanding winrate efficiency. EA Sharker has a simple and easy-to-use interface. No need for complicated settings, no need for set files to configure. If you have n

ECM Elite Channel is a volatility-based indicator, developed with a specific time algorithm, which consists of finding possible corrections in the market.
This indicator shows two outer lines, an inner line (retracement line) and an arrow sign, where the channel theory is to help identify overbought and oversold conditions in the market.
The market price will generally fall between the boundaries of the channel. If prices touch or move outside the channel, it's a trading opportunity.
The ind

With this indicator you'll have a general reading of the market's range using Gann's calculating modes. Gann's swing is used to have a quick reading to the market latest movements at first glance. The foundation of this swing calculation is in the count of candles in relation to the break-up and break-down of the price. When the price breaks-up the last maximum, the swing will get traced if a certain number of candles is exceeded from the last minimum. It can be used a "pure Gann" or not: If set

Introduction to X3 Chart Pattern Scanner X3 Cherart Pattern Scanner is the non-repainting and non-lagging indicator detecting X3 chart patterns including Harmonic pattern, Elliott Wave pattern, X3 patterns, and Japanese Candlestick patterns. Historical patterns match with signal patterns. Hence, you can readily develop the solid trading strategy in your chart. More importantly, this superb pattern scanner can detect the optimal pattern of its kind. In addition, you can switch on and off individu

The indicator displays peak levels of activity formed by the maximum volume, tracks the correlation of the candles on all timeframes (from the highest to the lowest one). Each volume level is a kind of key trading activity. The most important cluster is inside a month, week, day, hour, etc.
Indicator operation features A volume level receives Demand status if the nearest volume level located to the left and above has been broken upwards. A volume level receives Supply status if the nearest volu

Peak Trough Analysis is the great tool to detect peaks and troughs in your chart. Peak Trough Analysis tool can use three different peaks and troughs detection algorithm. The three algorithm include the orignal Fractals Indicator by Bill Williams, the Modified Fractals indicator and ZigZag indicator. You can use this peak and trough analysis tool to detect the price pattern made up from Equilibrium Fractal-Wave process. For further usage, there are good guide line on how to use this peak trough
FREE

Description of the Golden Shower advisor This advisor is designed for automated trading on the XAUUSD. Its algorithm is focused on short-term trades with rapid opening and closing of positions based on current market activity. Main functions and operating logic: Short-term transactions
The advisor opens positions based on small price fluctuations, managing the time the transaction remains on the market. Protective orders
Stop Loss and Trailing Stop levels can be set automatically for each pos

Bamboo EA:外国為替自動取引システムの機能説明 基本概要
Bamboo EAはブレイクアウト戦略に基づく自動売買EA(エキスパートアドバイザー)です。独自のブレイクアウト検知メカニズムとATR(平均真の範囲)を使った動的なリスク管理を組み合わせ、市場の変動中に取引機会を捉えるように設計されています。取引対象は XAUUSD(金) 、時間軸は M1(1分足) です。トレンド相場で高いパフォーマンスを発揮しますが、レンジ相場では平均的な結果となります。 初心者への推奨事項: デモ口座またはセント口座で十分に練習してから使用してください。 口座資金が 1000ドル の場合、ロットサイズは 0.01 。 口座資金が 10,000ドル の場合、注文数制限は 1~10件 。 自動資金比率計算(オプション): 10,000ドルごとに0.01~0.1ロット 。 1. 取引方向の制御 買い(Buy)と売り(Sell)を個別に有効/無効化可能。 2. ブレイクアウトシグナルの生成 時間枠: 調整可能な分析期間(デフォルト:60分)。 ブレイクアウト確認: 連続したブレイクアウトが必要。
FREE

Steady Flow is a fully automated system which has been developed to make strategies compatible with price action patterns. Protected by stop loss and take profit The Expert Advisor does not use martingale, grids, hedging, averaging and other risky strategies Enable or disable news filtering according to user needs Continuously generating profits Can trade full time in all conditions Works well in all market conditions, either trend or sideways This EA has passed 18 years back test of tick data

製品名 Smart ZigZag (MT4) – SmartView シリーズ 短い説明 MetaTrader プラットフォームで独特なユーザー体験を提供する ZigZag インジケーター。以前は利用できなかった高度な機能を提供し、ダブルクリックで設定を開く、削除せずにインジケーターを非表示/表示する、インジケーターウィンドウをチャート全体のサイズで表示するなどの機能を備えています。SmartView Indicators シリーズの残りの部分とシームレスに連携するように設計されています。 概要 SmartView シリーズは、革新的な機能を通じて MetaTrader プラットフォーム上のインジケーターに独特で特徴的なユーザー体験を提供し、インジケーター管理をより速く、より簡単にします。各インジケーターには、チャート上のスマートコントロールパネルが装備されており、基本情報を表示し、すべての重要な機能への迅速なアクセスを提供します。 以前は利用できなかった独自の機能 SmartView シリーズは、インジケーターでの作業をより簡単で迅速にする高度な機能を提供します: ダブルクリックで設
FREE

Galactic Imperium EA
An Expert Advisor that places pending orders at a user-defined entry time each day and force-closes all positions at a specified exit time, capturing intraday range breakouts while avoiding overnight exposure. How It Works Entry Scan & Orders At your chosen hour & minute, the EA measures the high/low over a configurable look-back period. It places BuyStop and SellStop orders just beyond that range. Orders are split into multiple equal lots to minimize slippage and spread i
FREE

Exclusive Arrival: Presenting for the First Time . This is your secret weapon for predicting which way the wind will blow with the next market shift. It assists you in developing your trading strategy by predicting the direction of the next candle. Compatible with forex, stocks, and cryptocurrencies on all timeframes, but higher timeframes are recommended. MT5 Version - https://www.mql5.com/en/market/product/108937/ How does it work ? It's pretty neat. The algorithm separates green and red can
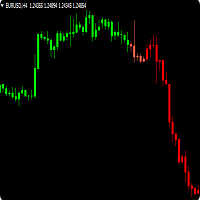
Trendfinder SMA are Colored candlesticks showing the trend based on two Simple Moving Averages and the slope of the slow moving average. This indicator will give you the color change on the next bar on the confirmation candle and will never repaint Trendfinder SMA is optimize to trade on any market and to be used trending and None trending markets. PLEASE TAKE NOTICE: For best results use this indicator as an extra tools after you have completed your regular analysis and use it for alerts base
FREE
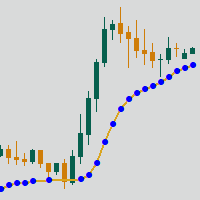
Adaptive Moving Average (AMA) is a trend indicator using moving average and market noise filter. Indicator feature are blue and red points, showing the power of trend. Recommendations for trading: Auxiliary Indicator Detecting trend Detecting power of trend Detecting potential reversal points Main indicator Shows entry points for swing trading Serves as dynamic support and resistance Recommendations for use: Any instrument Any timeframe Input parameters: Period - AMA period Fast Period - fast
FREE

The Netsrac Supply&Demand Dashboard shows you at a glance where relevant zones are located on your favorite assets. Open your chart directly from the dashboard and trade zones that really matter. Features
Finds the next relevant supply and demand zone and displays the distance to this zone (in pips) Finds and displays the zones in three different timeframes Calculates a trend indicator for the current and past candle for each configured time frame Opens a chart with your chart template directly

Attention! Friends, since there have been many scammers on the Internet recently selling indicators called ForexGump, we decided to warn you that only on our page is the LICENSE AUTHOR'S VERSION of the INDICATOR sold! We do not sell this indicator on other sites at a price lower than this! All indicators are sold cheaper - fakes! And even more often sold demo versions that stop working in a week! Therefore, in order not to risk your money, buy this indicator only on this site!
Forex Gump Pro is

このプロジェクトが好きなら、5つ星レビューを残してください。 このインジケータは、時間のための再開のコンパクトなカウントダウンクロックを描画します
キャンドルを閉じると: チャートの任意の角に配置することができます。 複数のタイムフレーム; MT5のナビゲーターからドラッグすることでインジケータウィンドウに追加できます。 ろうそくが10秒残っていると色が異なります。 チャートとのより良い統合のためのカスタマイズ可能な色。
FREE

Easy Scalp System Pro: Never Miss an Entry Again! Are you tired of complex trading setups that leave you guessing? Introducing the Easy Scalp System Pro —your ultimate, high-accuracy tool for capturing fast profits in any market! This powerful indicator combines the best of trend confirmation (Multiple EMAs) and momentum timing (MACD) into clear, non-repainting Buy and Sell arrows right on your chart. It's designed for scalpers and day traders who demand speed and precision. Why Choose Easy Sca
FREE

EA_HigeTrend https://youtu.be/4vXUD_o4reA?si=u76-GyUh053-Ljou
The Hige Trend Forex robot was specifically designed for the XAUUSD pair. XAUUSD typically exhibits high volatility and trendiness in the market. Following this rationale, the Expert Advisor (EA) will execute trades in accordance with the prevailing market trend. Once a clear trend is identified, the EA will initiate an order. The configuration is straightforward, involving Take Profit and Stop Loss with a trailing stop. However, it
FREE

TD Trading Info ユーザーマニュアル はじめに: TD Trading Infoは、リアルタイムの口座情報、取引統計、日次/週次/月次/四半期/年次損益概要、残高変化チャート、取引リマインダーを提供する強力なMT4インジケーターです。トレーダーは自身の取引行動をより深く理解することができます。インジケーターパネルはテーマカラーの切り替えに対応しており、最小化/最大化、ドラッグ、非表示/表示などの便利な機能も提供し、ユーザーエクスペリエンスを向上させます。 機能: リアルタイム口座情報: 口座残高、純資産、使用/空き証拠金、証拠金率、勝率、ネットポジション、保有ポジション数、手数料、スプレッドなどの主要情報を表示します。 取引統計: 現在の取引銘柄のポジション状況、未決済損益、本日/今週/今月/履歴の決済済み損益を提供します。すべての情報は自動的に計算され、リアルタイムで更新されます。 複数時間枠統計: 日次、週次、月次、四半期、年次の取引概要統計(取引ロット数、注文数、損益額、収益率、入出金、残高を含む)を表示できます。 残高変化チャート: 口座残高の日次変化トレンドを
FREE

Automatic trading system based on the morning Flat indicator, puts pending orders on the borders of the night channel .All trades have a fixed stop loss and take profit .The traded pair GBPUSD H1, can be used on other instruments after optimization.
The EA contains a switchable flat indicator . The robot's operating time in the input parameters corresponds to (+2GMT). when switching to daylight saving time,you need to adjust the time manually.
* Use default settings
* Does not use dangerous
FREE

This masterpiece blends cutting-edge Advance MA, HMA, and Momentum logic into stunning gold star signals, giving you the power to spot market shifts without the guesswork. Perfect for every trader—beginner or expert—this tool turns your XAUUSD charts into a goldmine of opportunity. Don’t just trade—thrive!
Why You’ll Love It
Crystal-Clear Signals : Gold star alerts highlight key market moments, guiding your decisions with ease. Smart Moving Average : Pair with the Advance MA to confidently de
FREE

Long-Term Supply Demand Indicator – Description
The Long-Term Supply Demand Indicator is a professional MT4 tool designed for traders who want to track higher-timeframe support and resistance zones on lower timeframes. It identifies supply and demand areas formed on the H4 timeframe and displays them clearly on M15, M5, and M1 charts, giving traders a precise view of key market zones across multiple timeframes.
The indicator provides alerts when a new supply or demand zone is formed, allowing
FREE

About:
The Nadaraya-Watson Envelope is a sophisticated yet practical technical indicator that helps traders identify overbought and oversold conditions using advanced kernel regression methods. This is the MT4 only Version.
For MT5 Version go here: https://www.mql5.com/en/market/product/158641/
Key Features ATR-Based Bands: Three upper and three lower bands provide graduated overbought/oversold zones Logarithmic Scale Calculation Center Line - bullish (teal) or bearish (red)
What is the Nad
FREE

OneShotFX is a scalping arrow signals type indicator, an all in one arrow system with money management and filtered signals. How to trade Buy : when up arrow prints on the chart open buy trade, set your tp and sl on colored tp and sl lines above and below the arrow signal candle. Sell: when up arrow prints on the chart open sell trade, set your tp and sl on colored tp and sl lines above and below the arrow signal candle. Why is it a good choice Plenty of signals : no need to wait for long per
FREE

SENSEは、厳選されたGANN手法とフラクタル計算を組み合わせた自動システムです。このシステムは、どこで取引を開始し、どこで決済するかを教えてくれます。もう複雑な計算に時間を費やす必要はありません。インジケータをインストールするだけです。
基本原則:
価格が白い線の上にある時、市場は強気である。
白い線の上で買い、下で止める 緑線は上値目標 白い線より下にあるときは弱気。
白い線より下で売り、上で止める。 赤線は下値目標 緑または赤の線が二重になっている場合は、強いエリアであることを示す。
なぜSENSEなのか?
利益目標 SENSEは自動的に利益確定のターゲットを設定し、取引の成功を最大化するお手伝いをします。 自動適応: このインディケータは、どのような時間枠に対しても自動的に再計算を行い、手動で調整する必要なく、正確で信頼性の高いシグナルを提供します。
スキャルピングにも最適です。
デモをチェック

Price Action Start — Your Automated Trading Partner in Pure Price Action Dream of an expert advisor that trades like a professional — using only clean price action, without messy indicators? Imagine it's already on your chart. "Price Action Start" is a professional Expert Advisor that automatically identifies and trades the key Engulfing candlestick patterns, the cornerstone of classical Price Action trading. This isn't just another robot; it's your edge, allowing you to follow the market
FREE

What we are talking about: This assistant can serve you for a long trading career. Optimized for those cases when you work on forecasts and want to buy a stock or crypto coin cheaper and sell it more expensive. Do you have an estimated closing price for profit: - If yes, then we will set up the robot to reach the price with greater profit and less risk. - If not, if you do not know exactly how much a stock or coin can grow, then you can maximize profit even with a small increase, due to a tempor
FREE
MetaTraderマーケットは、開発者がトレーディングアプリを販売するシンプルで便利なサイトです。
プロダクトを投稿するのをお手伝いし、マーケットのためにプロダクト記載を準備する方法を説明します。マーケットのすべてのアプリは暗号化によって守られ、購入者のコンピュータでしか動作しません。違法なコピーは不可能です。
取引の機会を逃しています。
- 無料取引アプリ
- 8千を超えるシグナルをコピー
- 金融ニュースで金融マーケットを探索
新規登録
ログイン