Lisek Levels and Channels Indicator

4.8

フォレックス取引のシャーロック・ホームズになる準備はできていますか?🕵️‍♂️💰 究極のトレーディングツール、Lisek Levels and Channelsインジケーターの登場です!!!

サーカスの芸のように複数のインジケーターを扱うのは忘れてください。必要なものをすべて一つの素晴らしいショーにパッケージングしました:

  • 価格レベル?チェック済み!✅
  • 価格チャネル?間違いなし!✅
  • 価格VWAP?もちろん!✅
  • オンバランスボリューム?全部ここにあります!✅

そして、お楽しみはこれだけではありません!ダブルエスプレッソよりも素早く目を覚まさせるアラームとプッシュ通知!☕️🚨

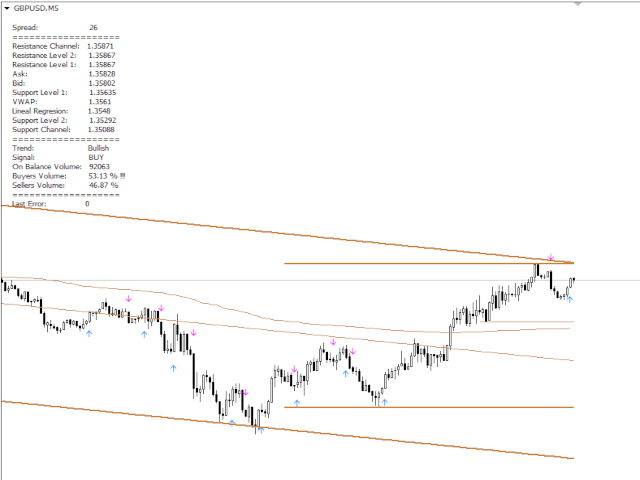
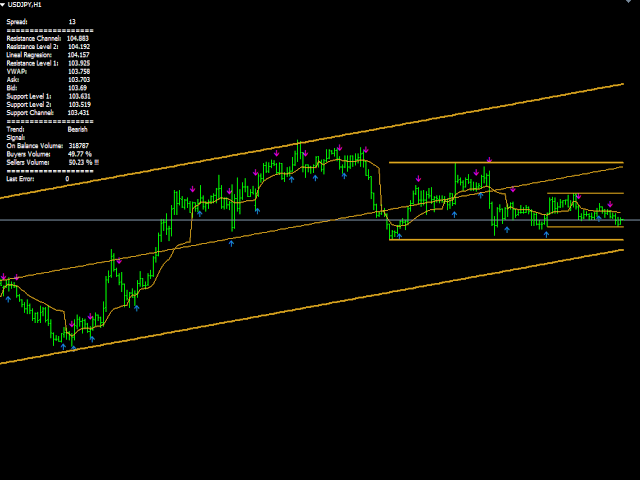
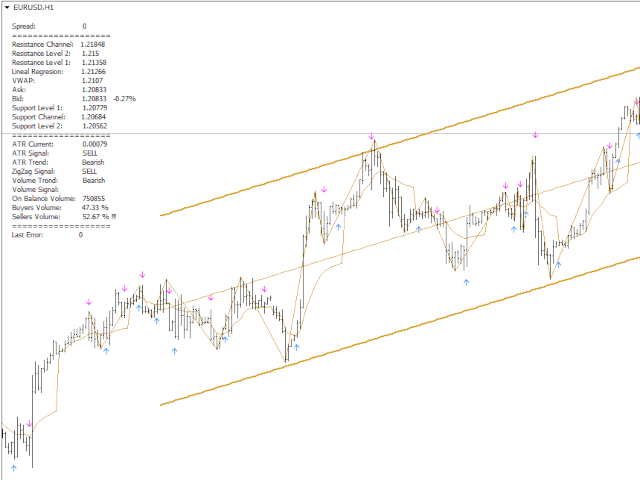
あなたのチャートはトレーディングチャンスの宝の地図に変身します:

  • 現在の価格がどこにあるか、すべてのクールなレベル、チャネル、VWAPと一緒に見てください。
  • オンバランスボリュームを評価しましょう - ベアダンスを踊っていますか、それともブルタンゴですか?買い手と売り手、どちらが動きを持っているか見てみましょう。
  • フォレックスのレイブパーティーのように上下を指す矢印?これは買い手または売り手の増加するボリュームを示しています。
  • 三目並べのゲームのようにチャートを横切る線?これがあなたのレベルとチャネルです、友よ。

でも、まだあります!🎭 Glimpzをご紹介します。大物プレイヤーのゲームへのVIPパスです。クジラと戦うよりも、一緒に泳ぐ方がいいでしょう?glimpz.netGlimpzで、市場の大物たちのプレイブックを覗き見ることができます。占い師の衣装なしで取引の水晶球を持っているようなものです。

トレーディングスタイル?高級アイスクリーム店よりも多くの味を用意しています:

  • サポートとレジスタンスの波にサーフィン 🏄‍♂️
  • プルバックのピンポンをプレイ 🏓
  • 脱獄のようなブレイクアウト 🏃‍♂️
  • レーザーポインターを追いかける猫よりも速く反転 🐱
  • プロのスナイパーのように利益目標とストップロスを設定 🎯

覚えておいてください。この利益ピラミッドゲームでは、最初のポジションだけが最前線にいます。その後は、高級エレベーターのようにストップロスを上げていきます。バブルラップに包まれた子猫よりも安全で、お気に入りのスウェットパンツよりも快適です。

プロのヒント:チャートウィンドウのプロパティを「チャートを前面に表示」に設定してください。3D映画のようにトレーディングビューが飛び出すのを誰が望まないでしょうか?🍿

さあ、あなたのフォレックスアカウントを成功の超高層ビルに変える準備はできましたか?GlimpzパワーのLisek Levels and Channelsインジケーターで、あなたは単にトレードしているだけではありません - 金融の未来を設計しているのです!

チャートのアクロバット、素晴らしい市場のマエストロたちよ、幸運を!トレンドが常にあなたの味方であり、利益がニューヨークのデリの サンドイッチよりも高く積み上がりますように!🚀💰📈


レビュー 29
jiab
436
jiab 2022.10.30 13:54 
 

good job

jerrylew2020
294
jerrylew2020 2022.09.23 09:51 
 

Very good.

Wang Wang Yu
184
Wang Wang Yu 2022.05.17 04:22 
 

the index "Lisek Levels and channel indicator" ,Why can't a message sent to the email?Please answer

おすすめのプロダクト
.................................if you need pivot point s levels............................... ............................this is a daily pivot point level creator........................... ...it is for daily pivots and show levels at times period H4 , H1 , M30 , M15 ,M 5... .................................also shows levels for 3 last days.............................. ................can use it with other indicators and see important levels...............
FREE
.....................................hi....................... ................for showing high s and low s and support and resistanses .....................we have a lot of ways............................... it can be helpful for finding trends , higher highs , higher lows , lower highs , lower lows .......................today i write on of thems.......................... ........................you can enter the number of last support and resistanses .........................and it will dra
FREE
ハーモニックパターンは市場の転換点を予測するのに最適です。これらのパターンは高い勝率と1日の中での多くの取引機会を提供します。当社のインジケーターは、ハーモニックトレーディングの原則に基づいて、市場反転ポイントを予測する最も一般的なハーモニックパターンを特定します。 重要な注意事項: インジケーターは再描画されず、遅れることはありません(パターンはDポイントで検出されます);再描画されることはありません(パターンは有効またはキャンセルされます)。 使用方法: インジケーターをMT5チャートにドラッグアンドドロップします。 パターン検出をTRUE(ABCD;Gartley)に設定します。 任意のデバイスを設定します(高いデバイス=より多くのパターン;低いデバイス=より少ないパターン)。 好みに合わせて色を調整します。 バルブ/エントリーポイント、TP、SLの警告を有効または無効にします。 パターンが検出された場合: アルゴリズムはDポイントでパターンを検出します。 警告が有効になっている場合、パターン検出を通知します。 パターンが無効になった場合、「パターンがキャンセルされました」という
FREE
Schaff Trend Cycleとは Schaff Trend Cycle(STC)は、トレンドの転換点をタイムリーに捉えるために設計されたオシレーター系インジケーターです。従来の移動平均やMACDと比較して、サイクル的な動きとモメンタムを組み合わせることで、トレンドの始まりと終わりをより明確に把握できます。 主な特徴 トレンド転換シグナルの明確化:上昇トレンドではサイクルラインが上向きに、下降トレンドでは下向きに推移します。 レンジ相場でのだましを抑制:サイクル周期を考慮した平滑化処理により、短期的なノイズを減少させます。 パラメーター調整が容易:期間や平滑化係数を変更するだけで、動作感度を初心者から上級者まで幅広く調整可能です。 計算ロジック概要 モメンタムの算出 指定期間の価格変化をもとに、短期および長期のモメンタムを計算します。 サイクル平滑化 モメンタムに対し、二重平滑化(ダブル・スムージング)を適用し、サイクル的な振動成分を抽出します。 正規化処理 0~100の範囲に正規化し、オシレーターとして表示します。 シグナル生成 水平ライン(通常は25と75)を上下に抜
FREE
Wicks UpDown Target GJ Wicks UpDown Target GJ is specialized in GJ forex pairs. Choppy movement up and down on the opening range every day.  Trading breakouts on London session and New York session is recommended. Guideline Entry Strategy Idea: Step 1 - Breakout Forming (Warning! Trade on London Session and New York Session) Step 2 - Breakout Starting (Take Action on your trading plan) Step 3 - Partial Close your order & set breakeven (no-risk) Step 4 - Target complete Step 5 - Don't trade
FREE
It identifies the pivot, support, and resistance price levels of the selected timeframe and then draws lines onto the chart. FEATURES: Option to specify the Timeframe Period in the PivotSR calculation. Option to display the PivotSR of the last candle, of every candle, or of the current candle. Options for displaying labels, line thickness, and line color. PivotSR can be interpreted as reversal levels or past price reactions that can be used as the basis for current price analysis. Some traders b
FREE
PZ Trendlines
PZ TRADING SLU
4.27 (11)
Tired of plotting trendlines? The PZ TrendLines indicator applies a mechanical approach to the construction of trend lines for you! [ Installation Guide | Update Guide | Troubleshooting | FAQ | All Products ] It can draw up to 18 trendlines Trendlines can be optionally based on fractals Each line represents a breakout level Each trendline can be broken or rejected Configurable amount of lines Configurable colors Author Arturo López Pérez, private investor and speculator, software engineer and
FREE
''Trendlines'' is an Indicator, that every Trader need and shows Trendline and  Support and resistance levels in all  Timeframe's. Also In 1-hour, 4-hour and daily time frames and Current timeframes, support, and resistance levels are specified and trend lines are drawn so that the trader can see all levels on a chart.   In   Properties   it is possible to turn off unnecessary Lines.  In ' Tendency indicator '' , as full package of Predictions that every Trader need, there  is also the Predict
FREE
SR indicator
Alexander Chertnik
5 (2)
SR is a support and resistance indicator, it shows major highs and lows by different colors. The color of a level is changing if the last high or low are touching it. After the closing of a bar above or below level, it will delete it. extern inputs: loop for candles / colors / drawing time *This indicator signal is not perfect and have to be used with other market analysis and confirmations.
FREE
Ppr PA
Yury Emeliyanov
4.5 (2)
"Ppr PA" is a unique technical indicator created to identify "PPR" patterns on the currency charts of the MT4 trading platform. These patterns can indicate possible reversals or continuation of the trend, providing traders with valuable signals to enter the market. Features: Automatic PPR Detection:   The indicator automatically identifies and marks PPR patterns with arrows on the chart. Visual Signals:   Green and red arrows indicate the optimal points for buying and selling, respectively. Ar
FREE
This indicator is designed to detect high probability reversal patterns: Double Tops/Bottoms with fake breakouts . This is the FREE version of the indicator: https://www.mql5.com/en/market/product/26371 The free version works only on EURUSD and GBPUSD! Please read also the blog post " Professional Trading With Double Tops/Bottoms And Divergences! " which explains the concepts behind the ULTIMATE Double Top/Bottom indicator and how you can use a professional top-down approach. The provided video
FREE
With this system you can spot high-probability trades in direction of strong trends. You can profit from stop hunt moves initiated by the smart money! Important Information How you can maximize the potential of the scanner, please read here: www.mql5.com/en/blogs/post/718109 Please read also the blog about the usage of the indicator: Professional Trading With Strong Momentum This FREE Version of the indicator works only on EURUSD and GBPUSD. The full version of the indicator can be found here:
FREE
The Red Dragons Support and Resistance Levels indicator automatically determines support and resistance levels using the proprietary algorithm based on historical and current data, so the levels are dynamic, which allows you to adjust trading targets based on the current price movement. For this reason, we use this indicator in our advisors, for example, Red Dragons, which you can purchase here: https://www.mql5.com/en/market/product/128713?source=Site +Market+MT4+New+Rating006 The panel also
FREE
Double Price Channel   設定で指定された特定の数のバーの価格チャネルインジケーター。 インジケータラインは、動的なサポートまたは抵抗レベルを表します。上限は特定の期間の価格の最大値であり、下限は最小値です。終値に基づく移動平均とは異なり、指標は小さな変動によって「気が散る」ことはありません。境界が変更された場合にのみ再計算されます。後者が発生した場合は、新しいトレンドのアプローチについて真剣に考える価値があります。期間の異なる2つの指標を1つのチャートで同時に使用する戦略があります。このような場合、周期の短いインジケーターは2番目のインジケーターの内側に配置されます。 インジケーター設定の説明: Width_Bars-インジケーター期間 高さ-高さ(ポイント単位)
FREE
価格波形パターン MT4へようこそ --(ABCD パターン)--     ABCD パターンは、テクニカル分析の世界で強力で広く使用されている取引パターンです。 これは、トレーダーが市場での潜在的な売買機会を特定するために使用する調和的な価格パターンです。 ABCD パターンを使用すると、トレーダーは潜在的な価格変動を予測し、いつ取引を開始および終了するかについて十分な情報に基づいた決定を下すことができます。 EA バージョン :   Price Wave EA MT4 MT5バージョン: Price Wave Pattern  MT5 特徴 :  ABCDパターンの自動検出。 強気パターンと弱気パターン。  任意のシンボルと任意の時間枠で機能します。 主要なレベルと価格目標。 カスタマイズ可能な設定と繊維レベルの調整。 アラートと通知。 今後さらに多くの機能が追加される予定です。 
FREE
PPRとEngulfing は、MetaTrader 4 (MT4)トレーディングプラットフォームの通貨チャートで「PPR」および「Engulfing」パターンを識別するために設計されたユニークなテクニカルインディケーターです。これらのパターンは、トレンドの反転や継続の可能性を示すことができ、トレーダーに市場へのエントリーとエグジットのための貴重なシグナルを提供します。 主な特徴: パターンの自動検出 : インディケーターは、PPRおよびEngulfingパターンを自動的に識別し、チャートに矢印でマークします。 視覚的シグナル : 緑色の上向き矢印は買いのポイントを示し、赤色の下向き矢印は売りのポイントを示します。 カスタマイズ可能な矢印の色 : ユーザーは、インディケーター設定を通じて、強気および弱気シグナルの矢印の色を選択できます。 モード選択 : 3つの動作モード - PPRのみ、Engulfingのみ、または両方のパターンを同時に分析します。 使用方法: チャートに追加 : インディケーターを希望する通貨ペアまたは金融商品のチャートに適用します。 シグナルを分析 : チャート上
FREE
The indicator displays signals according to the strategy of Bill Williams on the chart. Demo version of the indicator has the same features as the paid, except that it can work only on a demo account . Signal "First Wise Man" is formed when there is a divergent bar with angulation.  Bullish divergent bar - with lower minimum and closing price in the upper half. Bearish divergent bar - higher maximum and the closing price at the bottom half. Angulation is formed when all three lines of Alligator
FREE
WPR Breakout MT4
Mohamed Hassan Mohamed Hassan Alsherbiny
When prices breakout resistance levels are combined with   Larry Williams' Percentage Range "WPR"   oscillator breaks out its historical resistance levels then probability emerges to record farther prices.   It's strongly encouraged to confirm price breakout with oscillator breakout since they have comparable effects to price breaking support and resistance levels; surely, short trades will have the same perception. Concept is based on find swing levels which based on number of bars by each side
FREE
サポート と 抵抗レベルインジケーター( Support and resistance )をダウンロードできます。 インジケーターは、水平とトレンドのサポートと抵抗レベルを 表示します 。 インジケーター設定: トレンド( Trends ) トレンド又は水平のサポートと抵抗レベルの表示モード設定 はい( Yes )-トレンドレベルしか表示しない いいえ( No )- 水平 レベルしか表示しない リソース使用( UseResource ) インジケーターに組み込まれているリソースの使用モード設定。 はい( Yes )-商品リソースからのジグザグ( ZigZag )インジケーターを使用すること。 いいえ( No )-ジグザグ( ZigZag )ユーザーインジケーターを使用すること。 履歴バー( HistoryBar ) レベルが表示される履歴バーの数 バー数( CountBar ) 現在のバーを始め、サポートと 抵抗レベル が検索されるバーの数 商品で使用されている ジグザグ ( ZigZag ) インジケーターの設定 : デプス( Depth ) 前の値 より 偏差( Deviatio
FREE
This indicator shows the latest untouched support and resistance as horizontal lines. The indicator can show support/resistance from higher timeframes. With this indicator you can e.g. easily see the support/resistance of the timeframes H4, D1 and W1 on a H1 chart, which can be a big advantage while time your entry on H1. This is the FREE version of the indicator: Support Resistance Multi Time Frame The free version works only on EURUSD and GBPUSD! Parameters referenceTF: the timeframe from whi
FREE
The free version of the Hi Low Last Day MT4 indicator . The Hi Low Levels Last Day MT4 indicator shows the high and low of the last trading day . The ability to change the color of the lines is available . Try the full version of the Hi Low Last Day MT4 indicator , in which additional indicator features are available : Displaying the minimum and maximum of the second last day Displaying the minimum and maximum of the previous week Sound alert when crossing max . and min . levels Selecting an arb
FREE
Free automatic Fibonacci is an indicator that automatically plots a Fibonacci retracement based on the number of bars you select on the BarsToScan setting in the indicator. The Fibonacci is automatically updated in real time as new highest and lowest values appears amongst the selected bars. You can select which level values to be displayed in the indicator settings. You can also select the color of the levels thus enabling the trader to be able to attach the indicator several times with differe
FREE
The Pivot Indicator is a vital tool for technical analysis used by traders in the financial markets. Designed to assist in identifying potential reversal points or trend changes, this indicator provides valuable insights into key levels in the market. Key features of the Pivot Indicator include: Automatic Calculations: The Pivot Indicator automatically calculates Pivot Point, Support, and Resistance levels based on the previous period's high, low, and close prices. This eliminates the complexity
FREE
Power Trend Free - the indicator shows the trend strength in the selected period. Input Parameters The indicator has three input parameters: Period - a positive number greater than one, it shows the number of candlesticks used for calculations. If you enter one or zero, there will be no error, but the indicator will not be drawn. Applied Price - the standard "Apply to:" set meaning data used for the indicator calculation: Close - Close prices; Open - Open prices; High - High prices; Low - Low p
FREE
The Magic SMA indicator is of great help in determining trend direction. It can be an excellent addition to your existing strategy or the basis of a new one. We humans can make better decisions when we see better visually. So we designed it to show a different color for rising and falling trends. Everyone can customize this in the way that suits them best. By setting the Trend Period, we can optimize it for longer or shorter trends for our strategy. It is great for all time frames. IF YOU NEED
FREE
This tool gives you the opportunity to display pivot point support and resistance levels as well as the daily open, weekly close and monthly close levels on your chart with high levels of customization. Pivot points are important horizontal support and resistance levels that get calculated using the high, low and closing price of the previous period (for example D1). With this indicator, you can choose between hourly to monthly timeframes to base your pivot point calculation on. There is a va
FREE
Follow The Line
Oliver Gideon Amofa Appiah
3.94 (16)
FOLLOW THE LINE GET THE FULL VERSION HERE: https://www.mql5.com/en/market/product/36024 This indicator obeys the popular maxim that: "THE TREND IS YOUR FRIEND" It paints a GREEN line for BUY and also paints a RED line for SELL.  It gives alarms and alerts of all kinds. IT DOES NOT REPAINT and can be used for all currency pairs and timeframes. Yes, as easy and simple as that. Even a newbie can use it to make great and reliable trades. NB: For best results, get my other premium indicators for more
FREE
ContiStat restricted - Free DEMO version of the ContiStat indicator Free version of the indicator is ment as DEMO of full paid version. Full functionality is available, however The indicator work only on M30 chart period . Find the ContiStat indicator for full functionality Brief description The ContiStat indicator calculate statistic frequency of green (up) and red (down) movement in the chart and determine movement dynamics (silver curve). There are two key parameters to understand the ContiS
FREE
Aroon Classic インジケーターの概要 Aroon Classic は、チャート上でトレンドの発生と持続性を定量的に把握できるテクニカル指標です。トレンドの強さや転換タイミングを「Aroon Up」と「Aroon Down」という2本のラインで示し、0~100 の範囲で表示されます。Aroon Up が高値圏にあるほど上昇トレンドが強く、Aroon Down が高値圏にあるほど下降トレンドが強いことを意味します。 主な特徴 トレンドの発生から転換までを視覚的に判別可能 カスタマイズ可能な計算期間(デフォルト14期間) 線の色・太さ・スタイルを自由に設定可能 インジケーターのパラメーター パラメーター名 説明 デフォルト値 Period Aroon の計算に使用するバー数 14 Aroon Up Color Aroon Up ラインの色 DodgerBlue Aroon Down Color Aroon Down ラインの色 Tomato Line Width ラインの太さ(ピクセル) 2 インジケーターの計算方法 Aroon Up は、直近期間内の最高値が発生してからのバー数
FREE
This indicator displays pivot points in the chart, including historical vales, and supports many calculation modes for Pivot Points and S/R levels. [ Installation Guide | Update Guide | Troubleshooting | FAQ | All Products ] It plots historical levels for backtesting purposes It allows you to select the reference timeframe It implements different Pivot Point calculation modes It implements different SR calculation modes It implements customizable colors and sizes Calculation Modes The indicator
FREE
このプロダクトを購入した人は以下も購入しています
Gann Made Easy は、ミスター・ギャンの理論を使用した取引の最良の原則に基づいた、プロフェッショナルで使いやすい外国為替取引システムです。 W・D・ガン。このインジケーターは、ストップロスとテイクプロフィットレベルを含む正確な買いと売りのシグナルを提供します。 PUSH通知を利用して外出先でも取引可能です。 購入後に私に連絡して、取引のヒント、ボーナス、および「GANN MADE EASY」EA アシスタントを無料で入手してください。 おそらく、ギャンの取引手法についてはすでに何度も聞いたことがあるでしょう。通常、ギャンの理論は初心者のトレーダーだけでなく、すでにある程度の取引経験がある人にとっても非常に複雑なものです。なぜなら、ギャンの取引手法は理論的にはそれほど簡単に適用できるものではないからです。私はその知識を磨き、最良の原則を私の外国為替インジケーターに組み込むために数年を費やしました。 このインジケーターは非常に簡単に適用できます。必要なのは、それをチャートに添付し、簡単な取引推奨事項に従うだけです。このインジケーターは常に市場分析の仕事を行い、取引の機会を探しま
El indicador "MR BEAST ALERTAS DE LIQUIDEZ" es una herramienta avanzada diseñada para proporcionar señales y alertas sobre la liquidez del mercado basándose en una serie de indicadores técnicos y análisis de tendencias. Ideal para traders que buscan oportunidades de trading en función de la dinámica de precios y los niveles de volatilidad, este indicador ofrece una visualización clara y detallada en la ventana del gráfico de MetaTrader. Características Principales: Canal ATR Adaptativo: Calcula
Game Changerは、あらゆる金融商品で使用できる革新的なトレンドインジケーターです。MetaTraderを強力なトレンドアナライザーへと変貌させます。あらゆる時間枠で動作し、トレンドの特定、反転の可能性のシグナル、トレーリングストップ機能、そして迅速な市場反応のためのリアルタイムアラートを提供します。経験豊富なプロでも、優位性を求める初心者でも、このツールは自信と規律、そして根本的なトレンドダイナミクスを明確に理解した上で取引を行うための力となります。このインジケーターはリドロー機能も備えています。 購入後すぐにご連絡いただければ、個人ボーナスを進呈いたします。Strong SupportとTrend Scannerインジケーターの無料コピーを入手できます。[email protected]までプライベートメッセージを送ってください。 私のEAや特別なセットはTelegramでは販売しておりません。MQL5でのみ販売しており、セットファイルは私のブログでのみ公開しています。詐欺師にはご注意ください。他の方からセットを購入しないでください。 設定 トレンド変化時のアラート
M1 SNIPER は使いやすいトレーディングインジケーターシステムです。M1時間足向けに設計された矢印インジケーターです。M1時間足でのスキャルピングのためのスタンドアロンシステムとして、また既存のトレーディングシステムの一部としても使用できます。このトレーディングシステムはM1時間足での取引に特化して設計されていますが、他の時間足でも使用できます。元々、この手法はXAUUSDとBTCUSDの取引用に設計しましたが、他の市場においても役立つと考えています。 インジケーターのシグナルは、トレンドの方向と逆方向に取引できます。インジケーターのシグナルを利用して両方向に取引するのに役立つ特別な取引テクニックをご紹介します。この手法は、特別な動的なサポートとレジスタンスの価格帯を利用することに基づいています。 ご購入後、M1 SNIPER矢印インジケーターをすぐにダウンロードできます。さらに、M1 SNIPERツールのすべてのユーザーに、以下のスクリーンショットに表示されているApollo Dynamic SRインジケーターを無料で提供しています。この2つのインジケーターを組み合わせることで
PRO Renko Systemは、特別にRENKOチャートを取引するために設計された高精度の取引システムです。 これは、様々な取引商品に適用することができる普遍的なシステムです。 システムは効果的に正確な逆転信号へのアクセスを与えるいわゆる市場の騒音を中和する。 表示器は非常に使いやすく、信号の生成に責任がある1つの変数だけがあります。 あなたは簡単にお好みの任意の取引ツールとレンコバーのサイズにツールを適応させることができます。 私はいつもあなたが私のソフトウェアで収益性の高い取引を支援するために余分なサポートを提供する準備ができています! 私はあなたに幸せで収益性の高い取引をしたいです! ご購入後にご連絡ください! 私はあなたに私のレンコチャートジェネレータを送信します。 私はまた、私の個人的な推奨事項やシステムの他のモジュールを無料で共有します!
An exclusive indicator that utilizes an innovative algorithm to swiftly and accurately determine the market trend. The indicator automatically calculates opening, closing, and profit levels, providing detailed trading statistics. With these features, you can choose the most appropriate trading instrument for the current market conditions. Additionally, you can easily integrate your own arrow indicators into Scalper Inside Pro to quickly evaluate their statistics and profitability. Scalper Inside
Miraculous Indicator – ガン・スクエア・オブ・ナインに基づく100%非リペイントのFXおよびバイナリーツール この動画では、FXおよびバイナリーオプションのトレーダー向けに特別に開発された、非常に正確で強力な取引ツールである Miraculous Indicator を紹介しています。このインジケーターがユニークなのは、伝説的な ガン・スクエア・オブ・ナイン と ガンの振動の法則 に基づいている点で、現代の取引で利用できる最も正確な予測ツールの一つとなっています。 Miraculous Indicatorは 完全に非リペイント であり、ローソク足が確定した後にシグナルが変化したり消えたりすることはありません。つまり、見たものがそのまま利用できます。これにより、トレーダーは自信を持ってエントリーおよびエグジットを行うための信頼性と一貫性のある根拠を得ることができます。 主な特徴: ガン・スクエア・オブ・ナインとガン理論に基づいて構築 100%非リペイントのシグナルシステム すべての時間枠(M1、M5、H1、H4、日足、週足)で機能 FXおよびバイナリーオプション取引
Trend Screener
STE S.S.COMPANY
4.79 (95)
トレンドインジケーター、1つのツールに組み込まれたすべての重要なトレンド機能を備えたトレンドトレーディングとフィルタリングのための画期的なユニークなソリューション! これは、すべてのシンボル/商品(外国為替、商品、暗号通貨、インデックス、株式)で使用できる100%再描画されていないマルチタイムフレームおよびマルチ通貨インジケーターです。 期間限定オファー: サポートおよびレジスタンス スクリーナー インジケーターは、たった 50 ドルで永久的にご利用いただけます。(元の価格 250 ドル) (オファー延長) トレンドスクリーナーは、チャート内のドットで矢印トレンドシグナルを提供するインジケーターに続く効率的なインジケーターです。 トレンド分析インジケーターで使用できる機能: 1.トレンドスキャナー。 2.最大利益分析を備えたトレンドライン。 3.トレンド通貨強度メーター。 4.アラート付きのトレンド反転ドット。 5.アラート付きの強いトレンドドット。 6.トレンド矢印 毎日の分析例、毎日のシグナルパフォーマンス...など、トレンドスクリーナーインジケーターを使用して、ここで見つけること
このインジケーターは、反転ポイントと価格戻りゾーンを正確に表示します。     主要プレーヤー 。新たなトレンドが形成される場所を把握し、最大限の精度で意思決定を行い、すべての取引をコントロールします。 TREND LINES PRO インジケーターと組み合わせることで、その潜在能力を最大限に発揮します。 VERSION MT5 インジケーターが示す内容: 新しいトレンドの始まりに活性化する反転構造と反転レベル。 リスクと報酬の比率を最小限に抑えた利益 確定 と 損失停止の レベルの表示     RR 1:2   。 インテリジェントな削減ロジックによるストップロス。 指定されたインジケーターから 2 つのトレンド タイプの反転パターンを表示します。 指標: トレンドを追う   TREND LINES PRO   (世界的なトレンドの変化) TREND PRO   (クイックトレンド変更) シンプルで効果的   スキャナー   リアルタイムトレンド(新機能)。 マルチタイムフレームのインストゥルメント フィルタリング。 画面   利益     LOGIC AI信号の後。 当日プラス方
Volatility Trend System - a trading system that gives signals for entries. The volatility system gives linear and point signals in the direction of the trend, as well as signals to exit it, without redrawing and delays. The trend indicator monitors the direction of the medium-term trend, shows the direction and its change. The signal indicator is based on changes in volatility and shows market entries. The indicator is equipped with several types of alerts. Can be applied to various trading ins
Precautions for subscribing to indicator This indicator only supports the computer version of MT4 Does not support MT5, mobile phones, tablets The indicator only shows the day's entry arrow The previous history arrow will not be displayed (Live broadcast is for demonstration) The indicator is a trading aid Is not a EA automatic trading No copy trading function The indicator only indicates the entry position No exit (target profit)  The entry stop loss point is set at 30-50 PIPS Or the front hi
現在40%OFF! 初心者やエキスパートトレーダーのためのベストソリューション! このダッシュボードソフトウェアは、28の通貨ペアで動作しています。それは私達の主要な指標(高度な通貨の強さ28と高度な通貨インパルス)の2に基づいています。それは全体の外国為替市場の大きい概観を与えます。それは、すべての(9)時間枠で28の外国為替ペアのための高度な通貨の強さの値、通貨の動きの速度と信号を示しています。チャート上で1つのインディケータを使用して市場全体を観察し、トレンドやスキャルピングの機会をピンポイントで見つけることができたら、あなたのトレードがどのように改善されるか想像してみてください。 このインディケータには、強い通貨と弱い通貨の識別、潜在的な取引の識別と確認がより簡単になるような機能が搭載されています。このインディケータは、通貨の強さや弱さが増加しているか減少しているか、また、すべての時間枠でどのように機能しているかをグラフィカルに表示します。 新機能として、現在の市場環境の変化に適応するダイナミックなマーケットフィボナッチレベルが追加され、すでに当社のAdvanced
PairMaster Buy Sell Arrow Indicator for MT4 Trade Reversals Like a Pro — Catch Every Swing Point with Precision The PairMaster Buy Sell Arrow Indicator is a powerful MetaTrader 4 tool built to identify high-probability swing trading opportunities . Designed for traders who value accuracy, clarity, and simplicity, PairMaster detects key market turning points and plots intuitive buy and sell arrows directly on your chart. Key Features Accurate Swing Point Detection – Automatically identifies ma
Advanced Supply Demand
Bernhard Schweigert
4.91 (298)
現在40%オフ 初心者にもエキスパートトレーダーにも最適なソリューション このインジケーターは独自の機能と新しい公式を多数内蔵しており、ユニークで高品質かつ手頃な取引ツールです。このアップデートでは、2つの時間枠ゾーンを表示できるようになります。より長いTFだけでなく、チャートTFとより長いTF(ネストゾーンを表示)の両方を表示できます。すべてのSupply Demandトレーダーの皆さんのお気に召すはずです。:) 重要情報の公開 Advanced Supply Demandの可能性を最大化するには、 https://www.mql5.com/ja/blogs/post/720245 にアクセスしてください。   エントリーまたはターゲットの正確なトリガーポイントを正確に特定できれば取引がどのように改善されるか想像してみてください。新しい基盤となるアルゴリズムに基づいて構築されているため、買い手と売り手の間の潜在的な不均衡をさらに簡単に特定できます。これは、最も強い需要と供給のゾーンと、過去のパフォーマンス(古いゾーンを表示)がグラフィカルに表現されるためです。これらの機能は、最適な
Dynamic Forex28 Navigator - 次世代の Forex 取引ツール。 現在 49% オフ。 Dynamic Forex28 Navigator は、長年人気のインジケーターを進化させたもので、3 つの機能を 1 つにまとめています。 Advanced Currency Strength28 インジケーター (レビュー 695 件)  + Advanced Currency IMPULSE with ALERT (レビュー 520 件) + CS28 コンボ シグナル (ボーナス)。 インジケーターの詳細 https://www.mql5.com/en/blogs/post/758844 次世代の Strength インジケーターが提供するもの  オリジナルで気に入っていたすべての機能が、新機能と精度の向上によって強化されました。 主な機能: 独自の通貨強度計算式。 すべての時間枠でスムーズかつ正確な強度ライン。 トレンドの特定と正確なエントリーに最適です。 ダイナミックマーケットフィボナッチレベル (マーケットフィボナッチ)。 このインジケーターに固有
Super Signal – Skyblade Edition プロ仕様のノンリペイント / ノーラグ・トレンドシグナルシステム。卓越した勝率を実現 | MT4 / MT5 対応 1分足、5分足、15分足などの低い時間足で最も効果を発揮します。 主な特徴: Super Signal – Skyblade Edition は、トレンド取引に特化したスマートなシグナルシステムです。マルチレイヤーのフィルターロジックを用いて、明確な方向性と実際のモメンタムに支えられた強力なトレンドのみを検出します。 このシステムは 天井や底を予測するものではありません 。次の3つの条件がすべて満たされた場合にのみシグナルを発生させます: 明確なトレンド方向 モメンタムの増加 健全なボラティリティ構造 市場セッションに基づく流動性分析と組み合わせることで、シグナルの精度とタイミングがさらに向上します。 シグナルの特性: すべての矢印シグナルは 100% 非リペイント / 遅延なし 一度出現したシグナルは固定され、点滅・消失しません チャート上の矢印、情報パネル、ポップアップ通知、音声アラート、プッシュ通知
Gold Scalper Super is an easy-to-use trading system. The indicator can be used as a standalone scalping system on the M1 time frame, as well as part of your existing trading system. Bonus: when purchasing an indicator, Trend Arrow Super is provided free of charge, write to us after purchase. The indicator 100% does not repaint!!! If a signal appears, it does not disappear! Unlike indicators with redrawing, which lead to the loss of a deposit, because they can show a signal and then remove it.
現在40%オフ 初心者やエキスパートトレーダーに最適なソリューション! このインジケーターは、独自の機能と新しい計算式を取り入れた、ユニークで高品質、かつ手頃な価格のトレーディングツールです。たった1枚のチャートで28の為替ペアの通貨強度を読み取ることができます。新しいトレンドやスキャルピングチャンスの引き金となるポイントを正確に特定することができるので、あなたのトレードがどのように改善されるか想像してみてください。 ユーザーマニュアルはこちら  https://www.mql5.com/en/blogs/post/697384 これが最初の1本、オリジナルだ! 価値のないクローンを買わないでください。 特別な サブウィンドウの矢印で強い通貨の勢いを表示 GAPがあなたのトレードを導く! 基準通貨や気配値が売られすぎ・買われすぎのゾーン(外相フィボナッチレベル)にあるとき、個別チャートのメインウィンドウに警告表示。 通貨がレンジの外側から反落した場合、プルバック/リバーサルのアラート。 クロスパターンの特別なアラート 複数の時間枠を選択可能で、トレンドを素早く確認できます
Apollo Secret Trend は、任意のペアと時間枠でトレンドを見つけるために使用できるプロのトレンド インジケーターです。インジケーターは、取引するペアや時間枠に関係なく、市場のトレンドを検出するために使用できる主要な取引インジケーターになることができます。インジケーターで特別なパラメーターを使用することにより、シグナルを個人の取引スタイルに適応させることができます。 このインジケーターは、PUSH 通知を含むすべてのタイプのアラートを提供します。インジケータの信号は再描画しないでください!提供されたスクリーンショットでは、アポロ シークレット トレンド インジケーターと買われ過ぎ/売られ過ぎのオシレーター インジケーターを組み合わせて見ることができます。これは完全に無料で提供されます。 購入後、2 番目の買われすぎおよび売られすぎのオシレーター インジケーターを無料で入手するために私に連絡してください!また、システムの使用方法についても説明します。お得な特典もご用意しております!
このインジケーターを購入すると、プロ仕様のトレードマネージャーを無料で差し上げます。 まず第一に、このトレーディングシステムがノンリペイント、ノンリドロー、ノンラグのインジケーターであることを強調する価値がある。これにより、手動取引とロボット取引の両方に理想的なものになっています。 オンラインコース、マニュアル、プリセットのダウンロード。 「スマートトレンドトレーディングシステム MT5」は、新規および経験豊富なトレーダー向けにカスタマイズされた包括的なトレーディングソリューションです。10以上のプレミアムインジケーターを組み合わせ、7つ以上の堅実なトレーディング戦略を備えており、多様な市場状況に対応する多目的な選択肢となっています。 トレンドフォロー戦略:トレンドを効果的に乗り越えるための正確なエントリーとストップロス管理を提供します。 リバーサル戦略:潜在的なトレンドの反転を特定し、トレーダーがレンジ相場を活用できるようにします。 スキャルピング戦略:高速で正確なデイトレードおよび短期取引のために設計されています。 安定性:すべてのインジケーターはノンリペイント、ノンリドロー、ノ
Buy Sell Signal Pro — Market Structure & Pivot based Indicator Looking for a powerful yet lightweight market structure indicator designed to accurately detect swing turning points and visualize trend behavior with clarity . Built for traders who demand precision without chart clutter , it identifies key structural levels and delivers reliable buy/sell signals across any timeframe and instrument . By confirming pivot points before plotting signals, the indicator ensures consistent, non-repaintin
OFFER OFFER! The price of the indicator is kept at 75 dollars only from 20th Feb to 28th Feb. Full Fledged EA and Alert plus for alerts will also be provided in this offer along with the purchase of Indicator. Limited copies only at this price and Ea too. Grab your copy soon Alert plus for indicator with set file is kept in comment section with the image  SMC Blast Signal with FVG, BOS and trend Breakout The SMC Blast Signal is a Precise trading system for Meta Trader 4 that uses Smart Money Con
まず第一に、この取引インジケーターは再描画されず、再描画されず、遅延しないことを強調する価値があります。これにより、手動取引とロボット取引の両方に理想的なものになります。 ユーザーマニュアル:設定、入力、戦略。 アトミックアナリストは、価格の強さとモメンタムを利用して市場でより良いエッジを見つけるためのPA価格アクションインジケーターです。ノイズや誤ったシグナルを除去し、取引ポテンシャルを高めるための高度なフィルターを備えています。複雑なインジケーターの複数のレイヤーを使用して、アトミックアナリストはチャートをスキャンし、複雑な数学的計算をシンプルなシグナルと色に変換します。これにより、どのような初心者トレーダーでも理解して使用し、一貫した取引の決定を行うことができます。 「アトミックアナリスト」は、新規および経験豊富なトレーダー向けにカスタマイズされた包括的な取引ソリューションです。プレミアムインジケーターとトップノッチの機能を1つの取引戦略に組み合わせ、すべてのタイプのトレーダーにとって汎用性のある選択肢にします。 デイリートレーディングとスキャルピング戦略:高速で正確な
KT Trend Trading Suite は、トレンドフォロー戦略と複数のブレイクアウトポイントを組み合わせた多機能インジケーターです。 新たなトレンドが形成されると、このインジケーターは複数のエントリーチャンスを提供し、トレンドにうまく乗ることが可能になります。あまり重要でないエントリーポイントを避けるために、プルバックの閾値が使用されます。 MT5 バージョンはこちらで入手可能です  https://www.mql5.com/en/market/product/46270 機能 市場のさまざまなダイナミクスを1つの方程式にまとめ、トレンドの全体像を明確に描写します。 エントリーシグナルに基づいて、局所的な高値と安値を視覚的に示す長方形を描画します。 シグナルの精度を自動的に測定し、パフォーマンス指標をシンプルに表示します。 複数時間足対応のダッシュボードを搭載し、すべての時間軸をスキャンして、それぞれのトレンド方向を表示します。 入力パラメータ History Bars:   過去のシグナル分析に使用する履歴バーの数。  Signals Period:   エントリ
No Repaint Bext は完全な取引システムです。エントリーとエグジットのタイミング、そして取引の方向を示します。 緑の矢印 が表示されるたびに、 買い注文 を開きます。 赤い矢印 が表示されたら、すべての買い注文を閉じます。 同様に、 赤い矢印 が表示されたら、 売り注文 を開き、 緑の矢印 が表示されたらすべての売り注文を閉じます。 取引には M5(1分足) を使用し、 どの通貨ペアでも取引可能 です。 このインジケーターは 再描画されず 、ほとんど遅延しません。ただし、 ローソク足が確定するまで待つ という自然な条件はあります。 RSI フィルター と**2 つのクラシックな反転パターン(エンゴルフィング、ピンバー)**を使用し、反転の瞬間をほぼリアルタイムで捉えます。 インジケーターの効果的な使い方 どの通貨ペアでも使用可能 (テスト済み: GBPUSD, EURUSD ) 時間足:M5(1分足) 初期資金:500ドル以上 取引ロット:0.01 緑の矢印 が表示されたら、買い注文を開く。 赤い矢印 が表示されたら、すべての買い注文を閉じる。 赤い矢印 が表示されたら、売
M1 Arrow
Oleg Rodin
4.81 (21)
市場の2つの基本原則に基づく日中戦略。 このアルゴリズムは、追加のフィルターを使用したボリュームと価格の波の分析に基づいています。インディケータのインテリジェントアルゴリズムは、2つの市場要因が1つに結合した場合にのみシグナルを出します。インディケータは、より高い時間枠のデータを使用して、M1チャート上の特定の範囲の波を計算します。そして波を確認するために、インジケーターはボリュームによる分析を使用します。 このインディケータはレディトレーディングシステムです。トレーダーが必要とするのは、信号に従うことだけです。また、インジケーターはあなた自身の取引システムの基礎になることができます。取引はミニッツチャートでのみ行われます。 インジケーターがMTFの原則を使用しているという事実にもかかわらず、インジケーターのアルゴリズムは可能な限り安定しています。 購入後、必ず私に書いてください!私の取引設定と推奨事項をあなたと共有します!
Trend indicator AI
Ramil Minniakhmetov
4.57 (82)
Trend Ai indicatorは、トレンドの識別と実用的なエントリポイントと反転アラートを組み合わせることで、トレーダーの市場分析を強化する優れたツールです。 この指標は、ユーザーが自信と正確さで外国為替市場の複雑さをナビゲートすることを可能にします トレンドAiインジケーターは、主要なシグナル以外にも、プルバックやリトレースメント中に発生するセカンダリエントリポイントを識別し、トレーダーが確立されたトレンド内の価格修正を活用できるようにします。 重要な利点: *MT4およびMT5の仕事 *明確な買いまたは売りシグナル *再描画しません ·すべての資産で動作します 私はeaやセットをtelegram it詐欺で販売しないように注意してください。 すべての設定はここでブログで無料です。  重要! 指示とボーナスを得るために購入後すぐに私に連絡してください! 私の他のプロダクトと同様、実質操作の監視はここに見つけることができます: https://www.mql5.com/en/users/mechanic/seller&nbsp ; 設定および入力: すべての
Top Bottom Tracker は、洗練されたアルゴリズムに基づき、市場のトレンドを分析し、トレンドの高値と安値を検出することができるインジケーターです / MT5バージョン 。 価格は500$に達するまで徐々に上昇します。次の価格 --> $99 特徴 リペイントなし このインジケーターは 新しいデータが到着してもその値を変更しません 取引ペア すべてのFXペア 時間枠 すべての時間枠 パラメーター ==== インジケータの設定 設定パラメータ // 40 (値が高いほど、シグナルは少なくなりますが、より正確です) 上レベル値 // 80 (上水平線の値) 下限値 // 20 (下限水平線の値) インジケータ計算バー // 3000 (何本分のインジケータを計算するか。0を指定すると、全てのバーに対してインジケータを計算します) ==== アラーム設定 ポップアップアラート // true (端末にアラームを表示) メールアラート // true (アラームをメールで通知) アラート時間間隔 // 10 (アラーム間隔 (分)) 警告
現在20%OFF! 初心者やエキスパートトレーダーに最適なソリューションです。 このインディケータは、エキゾチックペア・コモディティ・インデックス・先物など、あらゆるシンボルの通貨の強さを表示することに特化したインディケータです。金、銀、原油、DAX、US30、MXN、TRY、CNHなどの通貨の強さを表示するために、9行目にどのシンボルでも追加することができます。独自の機能を多数搭載し、新しい計算式を採用したため、ユニークで高品質、かつ手頃な価格のトレーディングツールとなっています。新しいトレンドやスキャルピングチャンスのトリガーポイントを正確に把握することができるため、あなたのトレードがどのように改善されるか想像してみてください。 ユーザーマニュアル:ここをクリック   https://www.mql5.com/en/blogs/post/708876 すべての時間枠に対応します。あなたはすぐにトレンドを見ることができるようになります! 新しいアルゴリズムに基づいて設計されているため、潜在的な取引の特定と確認がより簡単になります。これは、8つの主要通貨と1つのシンボルの強弱
The Super Arrow Indicator provides non-repainting buy and sell signals with exceptional accuracy. Key Features No repainting – confirmed signals remain fixed Clear visual arrows: green for buy, red for sell Real-time alerts via pop-up, sound, and optional email Clean chart view with no unnecessary clutter Works on all markets: Forex, gold, oil, indices, crypto Adjustable Parameters TimeFrame Default: "current time frame" Function: Sets the time frame for indicator calculation Options: Can be set
作者のその他のプロダクト
Lisek Weis Wave
Darius Hans Lischka
5 (3)
This Weis Wave Volume indicator is a tool to help traders identify the current price trend.  Understanding volume can provide insight into a market's behavior to help you determine its overall health. The most important rule is this: volume precedes price. Typically, before a market price moves, volume comes into play. It has 2 main colors histogram which are green and red. – Green indicates an upward wave. The more the price increases, the bigger the green volume gets. – The red color shows a d
FREE
Lisek ATR Levels
Darius Hans Lischka
5 (3)
Are you looking for  ATR Levels,   ATR Trend, ATR Support and Resistance  Indicators ? Now you have all in one !!!  Info on your chart is showing you: where current price and levels are, what is current trend and signals. Search for an entry with low risk for trading by Lisek ATR Indicator. There are many ways to trade with Lisek ATR Indicator: Trade Support and Resistance Levels. Trade pullbacks (Range trading). Trade breakouts. Trade reversals. Take profit or set stop-loss based on ATR Levels.
FREE
Lisek Waves
Darius Hans Lischka
4 (1)
Search for an entry with low risk for trading by Lisek Waves Indicator. Using Lisek Waves Indicator can improve your trading performance. In it’s simplest form, this trading tool make it easy to s earch for an entry with low risk   and to manage your trade and risk. Lisek Wave analysis is based on the notion that markets follow specific patterns called waves which are the result of a natural rhythm of crowd psychology that exists in all markets. You can avoid the loss from taking trades that are
FREE
Lisek Stochastic
Darius Hans Lischka
2.83 (6)
Lisek Stochastic   oscillator indicator with Alarm, Push Notifications and e-mail  Notifications. The Stochastic indicator is a momentum indicator that shows you how strong or weak the current trend is. It helps you identify overbought and oversold market conditions within a trend. The Stochastic indicator is lagging indicator, which means it don't predict where price is going, it is only providing data on where price has been !!! How to trade with Stochastic indicator: Trend following: As long
FREE
Simple ATR Stop Loss :市場のボラティリティを示す羅針盤です。トレーディングの荒波を乗り切り、より賢い ストップロス を設定し、トレーディングの忍者のように見せてくれます(マントは含まれません)。 トレーディング愛好家と市場の達人の皆さん、注目してください! Simple ATR Stop Loss インジケーターの登場です – 荒々しいトレーディングの世界における新しい親友です。 2ピースパズルよりも簡単で、カフェイン漬けの牛が陶器店に入ったときよりも強力です。 ATRトレーディングチートシート(または市場の波に乗って沈まない方法)‍️: ATR:市場のムードデコーダー ️‍️ ATRを市場のTwitterフィードだと考えてください。高い値?ツイートの嵐モードです。 低い値?サイレントモードです。 この情報を使って、飛び込むか岸から見守るか決めましょう。‍️ サイジングと狙いを正確に ATRをあなたのトレーディングの仕立て屋とターゲット練習のコーチにしましょう。 弟や妹の服を着ているような感
FREE
Lisek Levels EA
Darius Hans Lischka
4.4 (5)
Simple but powerfull Trend and Hedge EA for Lisek Levels and Channels Indicator . 1. Download Lisek Levels and Channels Indicator . 2. Backtest and optimize in Strategy Tester. 3. For Agressive Tick Mode set your Chart to M1 Time Frame. 4. To speed up Strategy Tester, set "Show Info" to   false   ! 5. After backtesting, it’s important to analyse the test results  (best profit and smallest drawdown). 6. Test your EA settings on Demo Account. Happy Trading !!!
FREE
Lisek Multi MA
Darius Hans Lischka
5 (1)
Search for an entry with low risk for trading by Lisek Moving Average Indicator. There are many ways to trade with Lisek Moving Average Indicator: Trend continuation (Trend trading). Trade pullbacks (Range trading). Trade breakouts. Trade reversals. Take profits or set stop-loss based on your MA. Moving Averages are a frequently used technical indicator in forex trading, especially over 10, 50, 100, and 200 periods. Moving Averages are lagging indicators, which means they don't predict where p
FREE
ATR Pyramid ️: ステロイド注射されたジェンガの塔よりも高く利益を積み上げるチケット 、市場のボラティリティをトレンドサーフィン ‍️とポジション追加パーティー に変える、最初のトレードだけが大損のリスクがある中 、残りはストップロスをエレベーターのように上げて守り 、エスプレッソを飲んだウサギより速くあなたのフォレックス口座を増やす唯一の本当の方法となる快適ゾーンを作り出す!!! 利益積み上げ屋とトレンドサーファーの皆さん、注目! ‍️ この ATR Pyramid インジケーターは、金融ピラミッドを構築するのが好きな方々のためのものです(合法的なものだと約束します )。 ATRは市場のボラティリティしか示さないって言われてるの知ってる? でも、どんでん返し - それが全てじゃないんだ! この賢い小さなツールは、カフェイン中毒のブラッドハウンドより速くトレンドの方向を嗅ぎ分けられるんだ。 そして何を思う? 食べ放題バイキングのように、これを使って利益を積み上げているんだ。 ️ でも、まだあ
FREE
フィルタ:
Hendrikus Pelgrim
1202
Hendrikus Pelgrim 2025.03.10 04:53 
 

Not impressed

IK02XXyn
167
IK02XXyn 2024.11.07 00:59 
 

Buen indicador, muy funcional, Gracias por compartir

Armin W
75
Armin W 2024.06.29 20:16 
 

Hi, Darius. thanks for sharing your nice indicator. Unfortunately it is causing an out-of-range error in the Strategie Tester: 2024.01.01 23:01:00 Lisek Levels and Channels Indicator GOLD,M5: array out of range in 'Lisek Levels.mq4' (42,291) Do you prohibit strategie testing intentionally? Can you fix this error? Customization of colors for individual levels in the input tab would be a nice add-on too. 3 stars for now (will lupdate) since i cannot really judge due to lack of experience. Thanks,

fenix trading
254
fenix trading 2023.01.19 10:18 
 

I like it a lot, we wait for updates, very appreciated

Ko-saku Takagita
448
Ko-saku Takagita 2022.11.28 01:09 
 

ユーザーは評価に対して何もコメントを残しませんでした

jiab
436
jiab 2022.10.30 13:54 
 

good job

jerrylew2020
294
jerrylew2020 2022.09.23 09:51 
 

Very good.

Wang Wang Yu
184
Wang Wang Yu 2022.05.17 04:22 
 

the index "Lisek Levels and channel indicator" ,Why can't a message sent to the email?Please answer

topline8000
1144
topline8000 2022.05.03 11:03 
 

prob with lines all the same color but very good

Gregory Knobloch
373
Gregory Knobloch 2022.04.21 17:51 
 

This is a very good indicator. I use it for US30 on 1m chart

Miquel Mir
110
Miquel Mir 2022.04.11 15:57 
 

Nice indicator!!

Izzy Man-2
237
Izzy Man-2 2022.02.04 16:26 
 

Hi Darius, thanks for sharing this. it is great indicator for a glance decision when trading. Ladies and Gentlemen, I recommend this. Happy trading

s466as799
37
s466as799 2021.11.25 05:14 
 

Hello, can you send me the code by email pitonforeks@gmail.com It is downloaded incorrectly from the market, thank you.

Elusive Pimpernel
182
Elusive Pimpernel 2021.11.24 11:39 
 

Good one... Trying it now

Satyam Shivam
31037
Satyam Shivam 2021.11.18 05:32 
 

Nice Indicator, Works really Well!!

Lord John
18
Lord John 2021.11.03 10:52 
 

using this along with few other and works nice , 8/10

ALRAZEEN
130
ALRAZEEN 2021.10.21 00:16 
 

ユーザーは評価に対して何もコメントを残しませんでした

Sebastian Podeswa
332
Sebastian Podeswa 2021.09.17 10:25 
 

ユーザーは評価に対して何もコメントを残しませんでした

Norman Bryon
55
Norman Bryon 2021.09.14 00:38 
 

ユーザーは評価に対して何もコメントを残しませんでした

juk72
25
juk72 2021.09.13 02:45 
 

отличный инди

12
レビューに返信