YouTubeにあるマーケットチュートリアルビデオをご覧ください
ロボットや指標を購入する
仮想ホスティングで
EAを実行
EAを実行
ロボットや指標を購入前にテストする
マーケットで収入を得る
販売のためにプロダクトをプレゼンテーションする方法
MetaTrader 4のためのエキスパートアドバイザーとインディケータ - 16
### Forex Hedging Expert Advisor: No Loss Strategy
#### Overview The Forex Hedging Expert Advisor (EA) with a No Loss Strategy is an advanced automated trading system designed to mitigate risk and protect against adverse market movements. The core principle behind this EA is to implement a sophisticated hedging strategy that aims to lock in profits and minimize losses in volatile forex markets. This EA is ideal for traders who seek a robust, risk-averse trading solution that maintains capital

Торговая система «Tool Max Gold»: Это приглашение к торговле на XAUUSD. Золотой век продолжается! Золото в 2025–2026 годах — это современный инструмент защиты капитала и в этом заключается секрет его волатильности. «Tool Max Gold» — это мощный торговый робот для MT4, созданный специально для внутридневной торговли на XAUUSD. Он объединяет передовые алгоритмы автоматической торговли с расширенными возможностями для ручного управления и интеллектуальной защитой депозита. Прямо на гр

Fx Miracle Are you ready for a new era in the world of trading? The idea behind this expert was formulated over three years of hard work and tests to reach the best results. It is an icon in the world of experts that you will not find like anything else. The expert relies on collecting multiple timeframes and moving between them with a very advanced algorithm to collect information to give quality entry. Its accuracy reaches 99%, as it trades automatically and collects an extremely huge amount o

トレンドラインマップインジケーターは、トレンドスクリーナーインジケーターのアドオンです。トレンドスクリーナー(トレンドラインシグナル)によって生成されたすべてのシグナルのスキャナーとして機能します。
これは、トレンドスクリーナーインジケーターに基づくトレンドラインスキャナーです。 Trend Screener Pro インジケーターがない場合、Trend Line Map Proは機能しません。
ブログにアクセスすると、トレンドラインマップインジケーターの無料バージョンをダウンロードできます。 Metatrader Testerの制限なしで、購入する前に試してみてください。 : ここをクリック
1.簡単になる利点 通貨と時間枠に基づいて売買シグナルを表示します。 チャートに矢印が表示されてから価格が増減したピップ数を評価します。 (トレンドスクリーナーインジケーター矢印) 信号のタイミングを表示します。 アラートを売買するための複数の時間枠と複数の通貨のアラートを取得します。
2.トレンドラインマップの使用方法 売買シグナルダッシュボードを表示する方法は?

MT4 バージョン: https://www.mql5.com/en/market/product/104671 MT5 バージョン: https://www.mql5.com/en/market/product/110506
ヘッジ ブレイクアウト エキスパート アドバイザーは、ヘッジ戦略を通じて堅牢なリスク管理を採用しながら、市場のブレイクアウトを活用するように設計された洗練された取引ツールです。 この EA は、市場の流動性の向上を活用して取引の可能性を最大化し、最適なブレイクアウトの機会を特定するように細心の注意を払って作成されています。 このエキスパートアドバイザーは、ブレイクアウトロジックとヘッジによる効果的なリスク管理を組み合わせることで、全体的な取引パフォーマンスを向上させ、潜在的な反転を防ぐことを目指しています。
主な特徴:
ブレイクアウト検出アルゴリズム:
EA には、主要なサポートとレジスタンスのレベルを特定する強力なブレイクアウト検出アルゴリズムが装備されています。
過去の価格データとボラティリティ指標を利用して、潜在的なブレイクアウトポ

MT4 バージョン: https://www.mql5.com/en/market/product/102622 MT5 バージョン: https://www.mql5.com/en/market/product/102624
「Gold Buster」EA のご紹介: 次世代の動的サポート/レジスタンスおよびリスク管理システム
「Gold Buster」EA は、オープン ポジション管理とリスク分析テクノロジーの最新の進歩を活用して、金融市場でサポートとレジスタンス レベルを識別および使用する方法を再定義する、最先端の自動取引システムです。この革新的なエキスパート アドバイザー (EA) は、さまざまな取引プラットフォームや商品でシームレスに動作するように設計されており、安定した利益とリスク軽減を求める初心者と経験豊富なトレーダーの両方のニーズに対応します。
主な機能:
動的なサポートとレジスタンスの識別:
「Gold Buster」EA の核心は、動的なサポートとレジスタンスの識別アルゴリズムにあります。従来の静的なサポート レベルとレジスタンス レベルは事前に定義され

MT4バージョン: https://www.mql5.com/ja/market/product/90950 MT5バージョン: https://www.mql5.com/ja/market/product/93706
Rebate Hunter – マルチペアヘッジグリッドEA(ダイナミックアダプティブ)
Rebate Hunterは、安定した取引量を確保しながら、バスケット利益をコントロールできるよう設計された、マルチペアヘッジグリッドEAです。このEAは、売買を同時に開始し(ヘッジエントリー)、ダイナミックアダプティブグリッドディスタンスと自動バスケットクローズシステムを用いてポジションを管理します。
このアプローチは、安定した利益サイクルと高い取引量を重視しつつ、様々なボラティリティ状況に対応できるEAを求めるトレーダー向けに構築されており、取引量ベースのリベートプログラムの恩恵を受ける口座に最適です。
主な機能 真のヘッジエントリー(買い+売り) Rebate Hunterは、エクスポージャーのバランスを保ち、方向性への依存を軽減するために、2つのポジションを同時に

"The Squeeze indicator attempts to identify periods of consolidation in a market. In general the market is either in a period of quiet consolidation or vertical price discovery. By identifying these calm periods, we have a better opportunity of getting into trades with the potential for larger moves. Once a market enters into a "squeeze," we watch the overall market momentum to help forecast the market direction and await a release of market energy." Modified TTM Squeeze Indicator is a modifica

Ai Alphaは金取引専用に設計されたインテリジェントなEA(エキスパートアドバイザー)です。 最新の大規模言語モデルを統合して、プログラムの構造とモジュールを全体的に最適化しています 。深層学習技術を活用し、過去のデータから堅牢な特徴量を抽出して戦略ロジックに直接組み込むことで、外部APIへの依存や複雑なトレーニング工程を完全に排除しています。これにより、金の長期的なトレンドを捉え、安定した資金成長を実現します。 Ai Alphaは取引の本質に焦点を当てており、長期的で安定した戦略を求めるユーザーに最適です。 LIVE Signal
私たちが掲げる原則 マーチンゲール戦略は使用しません グリッド取引は採用しません すべての取引には明確な退出ロジックがあります 運任せではなく、論理とリスク管理に基づいています バックテストの操作や実績の偽装は行いません その他の特徴 戦略はインサンプルとアウトサンプルで検証済み(インサンプルのデータ期間は2010年〜2020年) ニュースフィルターに依存せず、市場の変動に強く対応 複雑な設定は不要—すぐに使える設計で、パラメータの最適化も不要

GOLD (XAU) is one of the most volatile assets, and is the most attractive asset for traders.
Use this EA with this simple setup to trade Gold. To use this EA, the user only needs to fill in the Lot , TP , SL , and the EA will work optimally.
Choose the M1 time frame for this EA, to get as many trades as possible.
Even if the user leaves the TP and SL values (TP=0 & SL=0), the EA will automatically determine the best TP and SL values so that trading can be profitable.
As an additional f
FREE

このインディケータは、異なる期間のフラクタルの価格構造を調べて、市場で起こり得る反転ポイントを決定し、すでに基本的または技術的な評価モデルを持っているポジショントレーダーにタイミングを提供します。弟の リバーサルフラクタル とは異なり、このインジケーターは選択された期間のためにリバーサルを逃すことはなく、ジグザグ形式でリバーサルフラクタルを見つけます。 [ インストールガイド | 更新ガイド | トラブルシューティング | よくある質問 | すべての製品 ] ターニングポイントは長いトレンドを開始できます インジケーターは再描画されていません
あらゆる種類のアラートを実装します カスタマイズ可能な色とサイズ フラクタルは奇数番目のバーのフォーメーションであり、フォーメーションの最上位または最下位の中間バーであり、フラクタル内のすべてのバーが閉じるとインディケーターが描画されるため、このインジケーターはリアクティブまたは遅れ信号です。ただし、既存の方向バイアスを持つトレーダーは、この指標が非常に有用であり、早期のエントリポイントを取得します。 このインディケーターは、ボイルダウンされた

この指標は、突然の変動と市場のノイズを無視することにより、比類のない信頼性で市場動向を追跡します。これは、日中のチャートと小さな時間枠をトレンドトレードするように設計されています。その勝率は約85%です。 [ インストールガイド | 更新ガイド | トラブルシューティング | よくある質問 | すべての製品 ] 驚くほど簡単に取引できます 売られ過ぎ/買われ過ぎの状況を見つける 常にノイズのない取引をお楽しみください 日中チャートでむち打ちされるのを避ける この指標は、独自の品質とパフォーマンスを分析します 複数時間枠のダッシュボードを実装します このインディケータは、低価格帯での取引に適しています。なぜなら、平均価格の周りの市場ノイズを減らすことにより、突然の価格の急上昇や修正を無視するからです。 インディケーターは最適化をまったく必要としません 複数時間枠のダッシュボードを実装します 電子メール/サウンド/プッシュアラートを実装します インジケーターは再描画および非バックペインティングではありません この指標は、より高い時間枠で非常に長い傾向に浸透する可能性のある小さな時間枠に適

Think of the rarest pair you can think of. And I assure you that this indicator can compute it's strength. This Currency Meter will literally calculate any currency pairs, either it is the Major Pairs, Metals, CFD's, Commodities, Crypto Currency like Bitcoin/BTC or Ethereum/ETH and even stocks. Just name it and you will get it! There is no currency pair this Currency Meter can solve. No matter how rare or exotic is that currency, it will always be solved by this Currency meter which on a real-ti

チャートを構成し、周期的な価格変動を識別するテクニカル指標。
どのチャートでも動作します。
いくつかの種類の通知。
グラフ自体に追加の矢印があります。
履歴を再描画せずに、キャンドルのクローズに取り組みます。
M5以上のTFを推奨します。
パラメータの使用と設定が簡単です。
異なるパラメータを持つ 2 つのインジケーターを使用する場合、他のインジケーターなしで使用できます。
入力パラメータは2つあります
周期性と信号持続時間
これら 2 つのパラメータは、チャート構造の処理を扱います。
Cyclicity - 反転サイクルが変化する頻度を調整し、サイクルを滑らかにします。 Signal duration - 最小数では価格変動の衝動を検出し、最大数では長期的なトレンドの動きを検出します。

Gann Box インジケーターは、トレーダーが市場の重要なレベルを特定し、活用するのを支援するために設計された強力で多機能なツールです。このインジケーターを使用すると、チャート上に長方形を描くことができ、それが自動的に 0, 0.25, 0.50, 0.75, 1 の戦略的レベルを持つ複数のゾーンに分割されます。価格がこれらのレベルのいずれかに達すると、アラートがトリガーされ、トレーディングの意思決定に貴重な支援を提供します。描いたゾーンに対する市場の動きを即座に把握できます。ゾーンをトレースするには、単純な長方形を描いて名前を GannBox に変更するだけです。 このインジケーターは、 サポートとレジスタンス の概念を使用するトレーダー、 サプライとデマンド 、 ICTテクニック 、または**公正価値ギャップ(FVG)**の専門家など、すべてのタイプのトレーダー向けに設計されています。 デイトレーダー、スイングトレーダー、またはポジショントレーダーであろうと、 Gann Box は市場の動きをより良く理解し予測する手助けをし、反応性とパフォーマンスを向上させます。 MT5バージョ

Background : Forex swing trading is a short-to-medium-term strategy aiming to profit from price "swings" (short uptrends/downtrends) within larger market moves.
This is a simple system that trades the rejection of a previous swing high/low . The system is non repaint and easy to use.Please use with discretion , it gives a decent accuracy and would definitely improve your trades. You can use on any pair and timeframe
FREE

This is an indicator of trading sessions that can display all levels (Open-High-Low-Close) for four sessions. The indicator can also predict session levels. Sessions can be drawn with lines or rectangles (empty or filled), lines can be extended to the next session. You can easily hide/show each session by pressing hotkeys (by default '1', '2', '3', '4'). You can see ASR (Average Session Range) lines (default hotkey 'A'). This is similar to the ADR calculation, only it is calculated based on t

Engulfing Pattern EA v7 - 日本語 Engulfing Pattern EA v7は、MetaTrader 4向けの完全自動売買システムで、クラシックな包み足パターン認識と高度なテクニカル分析、マルチレイヤーフィルターシステムを組み合わせています。このロボットは最大限の柔軟性を持って設計されており、43の設定可能なパラメータにより、取引スタイル、取引商品、市場条件に合わせて戦略のあらゆる側面をカスタマイズできます。 推奨通貨ペア:USD/JPY — EAはUSD/JPY向けに特別に最適化およびテストされており、このペアで優れた結果を示しています。 ️ 重要:通貨ペア間のpip表示の違い 異なる商品でEAを使用する前に注意深くお読みください: ブローカーと通貨ペア間の価格表示システムの違いにより、同じpip値が異なる形で表示される場合があります: USD/JPY、EUR/JPY — 小数点以下2桁または3桁(例:150.00または150.000)— 10 pipsは10または100と表示 EUR/USD、GBP/USD、AUD/USD — 小数点以下4桁または5

My exclusive product. Follow RSI and MA. Automated trading bot with capital from $ 1000. You should run the main currency pairs and the minor pairs like EU, GU, AU, EJ, EC .... The martingale + Grid strategy will be very risky, but very profitable.
The main parameters can be installed: Lot - Startot . Fixlot - 0.01_02_03_04 \ or\ 0.01_02_03_05_08 Auto-BUY-SELL - allows to buy or sell. Auto-Grid - ON/OFF AutoLot - ON/OFF TP - Takeprofit -pips. SL - No Stoploss. Use tralling = ON/OF
FREE

The VWAP Level indicator is a technical analysis tool that calculates the weighted average price for the traded volumes of a specific asset. The VWAP provides traders and investors with the average price of an asset over a specific time frame.
It is commonly used by investors to compare data on "passive" trading operations, such as pension funds and mutual funds, but also by traders who want to check if an asset has been bought or sold at a good market price.
To calculate the VWAP level we us
FREE

平均日次範囲は、特定の期間にわたって測定された外国為替ペアの平均ピップ範囲を示します。トレーダーはADRを使用して、平均的な1日の動き以外の潜在的な価格行動を視覚化できます。 ADRが平均を上回っている場合、それは毎日のボラティリティが通常よりも高いことを意味します。これは、通貨ペアがその基準を超えて拡大している可能性があることを意味します。
ADRアナライザーは5つの主要な機能で構成されています。
範囲(ADR)スクリーナー:複数通貨のADR分析。 ADRゾーン:ADRゾーンの価格ブームの外で日中に予想される市場範囲を示します。 Xバーゾーン:ユーザーが指定したXバーのX量のブレークを表示します。 毎日の高および低ゾーン:前日の高レベルまたは低レベルの休憩を識別します。 ウィークリーハイゾーンとローゾーン:週の休憩日ハイレベルまたはローレベルを識別します。 期間限定オファー:レンジアナライザーインジケーターは、50ドルと寿命でのみご利用いただけます。 (元の価格125 $)
主な機能 マルチ通貨スクリーナー。 ADRゾーンブレイクアウト すべてのタイプのアラート(ポップ、プッ

Welcome to Phoenix EA Generator MQL4! Welcome to the freedom of setting the rules and creating your own EA. Our mission is to provide you the tools you need to build your winning strategy. If you are tired of using EAs with unknown algorithms, if you have trading ideas you want to build, test and optimize, if you want an EA that is only watching the market and notifying you when certain conditions are met - than Phoenix EA Generator is the EA you are looking for. The EA has 2 modes : "Make trade
FREE

MT5版 | FAQ Owl Smart Levels Indicator は、 Bill Williams の高度なフラクタル、市場の正しい波構造を構築する Valable ZigZag、エントリの正確なレベルをマークする Fibonacci レベルなどの一般的な市場分析ツールを含む 1 つのインジケーター内の完全な取引システムです。 利益を得るために市場と場所に。 戦略の詳細な説明 インジケータを操作するための指示 顧問-取引助手 プライベートユーザーチャット ->購入後に私に書いて、私はプライベートチャットにあなたを追加し、あなたはそこにすべてのボーナスをダウンロードすることができます 力はシンプルさにあります!
Owl Smart Levels 取引システムは非常に使いやすいので、専門家にも、市場を勉強し始めて自分で取引戦略を選択し始めたばかりの人にも適しています。 戦略と指標に秘密の数式や計算方法が隠されているわけではなく、すべての戦略指標は公開されています。 Owl Smart Levels を使用すると、取引を開始するためのシグナルをすばやく確認し、注

indicators to facilitate analysis based on Oma Ally's BBMA strategy by displaying CSAK (CSD), CSM and Extreme labels on the chart 1. Displays the Bollinger Band line 2. LWMA 5-10 High and Low 3. EMA 50 4. Fibonacci 5. MHV . area 6. Alert & Show labels BBMA consists of the use of 2 indicators: Moving Averages Bollinger Bands BBMA consists of 3 types of entries: Extreme MHV Re-Entry Moving Average Settings: There are 5 MAs used in the system: 2 High Moving Averages, 2 Low Moving Averages and
FREE

AUTO SF PRO SCALPING EA は、MT4に対応したスワップフリーのマルチペア取引システムです。非常に安全で、安定した成長を誇ります。
これは、あなたの代わりにすべての取引作業をこなしてくれる「設定して忘れる」エキスパートアドバイザーです。7つの通貨ペアに対応した7つのSet_filesをご用意しています。
テストと取引用のEA設定ファイルをダウンロードしてください: GBPCAD Set_file GBPCHF Set_file EURCHF Set_file USDCHF Set_file GBPAUD Set_file EURCAD Set_file EURAUD Set_file
EAの主な特徴: - ロールオーバーの影響を受けません。 - スワップはありません。 - ギャップを避けるため、金曜日から月曜日までの注文を保持する必要はありません。 - スキャルピングテクニックに対応しています。 - システムは安全で、グリッドやマーチンゲール法などの危険な手法は使用していません。アカウント保護のため、各注文には固定のSLが設定されています。 - このEAは非
MACD Trend EA is based on the popular forex indicator MACD (Moving Average Convergence Divergence). It is fully automated trading expert advisor and completely FREE! As the name suggests, this expert advisor uses a trend-following strategy and uses the MACD indicator to detect the beginning of uptrends and downtrends.
MACD Trend EA Top Features - Trend Following Strategy - Money Management - Advanced Exit System + TP and SL - Trailing Stop System - Broker protection System - Custom Magic
Re
FREE
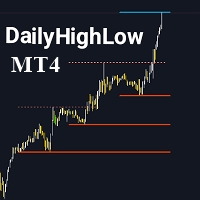
インジケーターを評価して、可視性向上にご協力いただければ幸いです。 DailyHighLow インジケーターは、MetaTrader 4 (MT4) プラットフォーム用に設計されており、トレーダーが日々の価格変動を監視するのに役立ちます。このインジケーターは、指定した期間の最高値と最低値に基づいて自動的にトレンドラインを描画し、正確な市場情報を視覚的に提供します。 主な特徴: トレンドラインのカスタマイズ: トレーダーの好みに合わせて、トレンドラインの色、スタイル、幅を調整できます。トレンドラインには、ブレイクとノンブレイクの両方の設定が可能です。 動的な更新: トレンドラインは最新の市場データに基づいて自動的に調整され、ブレイクの状況を示す視覚的なマーカーが用意されています。 柔軟なパラメータ設定: 表示する日数の設定、ブレイク後のラインの終了時間、および高値と安値のトレンドラインの外観をカスタマイズできます。 明確な視覚効果: ブレイクラインとノンブレイクラインを異なる色とスタイルで区別し、市場の主要レベルを迅速に識別できます。 このインジケーターは、トレンドラインを明確にカスタマ
FREE

Position Calculator calculates how many lots to trade based on: Entry and stop-loss levels Risk tolerance Account size (balance, equity, or even your savings account) Account currency Currency exchange rates - The main tab of the panel provides the primary control over the EA's functions and serves to output the most important calculation results: the position size, risk, reward, and risk-to-reward ratio. - The risk tab can help you assess current and potential risk and reward profile. Using a s
FREE

Dark Breakout is an Indicator for intraday trading. This Indicator is based on Trend Following strategy, providing an entry signal on the breakout. The signal is provided by the arrow, which confirms the breaking of the level. We can enter in good price with this Indicator, in order to follow the main trend on the current instrument. It is advised to use low spread ECN brokers. This Indicator does Not repaint and N ot lag . Recommended timeframes are M5, M15 and H1. Recommended working pairs

前日の終値とバーのシフト - MetaTrader用のツール! 前日の終値とバーのシフトインジケーターは、テクニカル分析とトレードの意思決定を向上させるために設計されたツールです。このインジケーターを使用すると、任意のバーのオープン、ハイ、ロー、クローズの詳細な情報にアクセスでき、市場の動きを正確かつ包括的に分析することができます。 自分のチャート上でタイムフレームを重ねることができると想像してみてください。これにより、現在のタイムフレーム内でさまざまな時間枠の各バーを詳細に分析することができます。前日の終値とバーのシフトインジケーターを使用すると、この素晴らしい機能が手の届くところにあります。 前日の終値がサポートとレジスタンスとしての重要性は、トレーダーのコミュニティで広く認識されています。このツールを使うことで、前回の終値で価格が停止したレベルを明確かつ正確に確認できるため、購入と売却の意思決定に貴重な洞察を提供します。 インジケーターをチャートに適用すると、前日のオープン、ハイ、ロー、クローズの重要な情報にすぐにアクセスできます。これらの情報は視覚的に魅力的に強調表示されます。
FREE
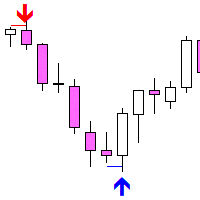
Fakey Detector — False Breakout (Fakey) Indicator Fakey Detector is an indicator that automatically detects the classic Fakey pattern (false breakout of an inside bar) from Price Action and displays it on the chart using an arrow and breakout level. How it works: The Fakey pattern consists of three candles: Mother Bar — the largest by range Inside Bar — fully contained within the Mother Bar's range Fakey Candle — breaks out (up or down), but then closes back inside the range The indicator
FREE
The Pioneer Of Trend Detection! A Powerful Indicator That Avoids Whipsaws And Uncertain Market Noise. Functions mainly as a filter to help you trade in the direction of the trend. It works in any pair or timeframe.
Features Advanced trend detection software using complex algorithms that can be used as the supporting tool or system. Unique trend detection that avoids whipsaws and uncertain market noise Analyzes statistics of maximum profits and calculates possible targets for the next signal Fle

HOT Predator IQ7 – トレーディングにおけるスマートハンター 無料版 – プレミアム版に移行する前に、自分の本能を確かめよう 手頃な価格のパワー。プレミアムなインテリジェンス。100% 無料でお試しいただけます。 「HOT Quantum IQ7 8 Symbols」の プレミアムバージョンをご覧になったことがある方は、ぜひご覧ください。(マーケット/プロダクト/153368)そして「EA Quantum IQ7 ALL in ONE」のプレミアムバージョン もご覧ください 。(マーケット/プロダクト/153369)
この 無料エディションは、 完全なプロフェッショナル スイートにアップグレードする前に、ビジュアル マーケットハンティングの技術を探索、学習、習得できるように作成された ゲートウェイ エクスペリエンス です。 ------------------------------------------------------------------------------------------ コンセプト HOT Predator IQ7 は単なるインジケータ
FREE

MetaTrader4のエキスパートアドバイザーに情報パネルを追加するためのライブラリ。 プログラムの情報とインターフェースが取引で利益をもたらすことを保証することはできませんが、プログラムの最も単純なインターフェースでさえ第一印象を強めることができると断言できます。 エキスパートアドバイザーに パネルを追加するための詳細な説明と手順は、ブログにあります: LIB-EAPADPROステップバイステップの説明 パネルの詳細な説明と EAPADPROの使用手順 MetaTrader5ライブラリバージョン 追加のプロセスは 10のステップで 構成されており、それらについては記事で詳しく説明しています。
ライブラリのインストール このサイトからライブラリをインストールします。 エキスパートアドバイザーを開きます。 コードをインストールするためのサンプルとステップバイステップガイド、ファイル Exp-EAPADPRO LIBRARY TEST(ブログにあります)を開き ます。 推奨事項に記載されているように各ステップを実行するか、サイトからのステップバイステップの説明を使用してください。
FREE

Strategy Bybit Scalper - fully automated cryptocurrency trading algorithm, the main direction of the trading advisor for trading on the Bybit crypto exchange, IC Markets and other crypto exchanges and low spread brokers. The algorithm bybit scalping does not use dangerous trading methods - martingale, grid and averaging, it always uses only fixed stop loss, take profit and built-in trailing stop. To trade, install the adviser on the M1, M5, M15, H1 chart, cryptocurrency (BTCUSD (Bitcoin), BTCUSD
FREE
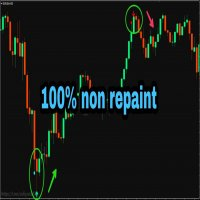
PLEASE NOTE You can customize the settings of K_period value, the oversold and the overbought value is customizable. You can change it as per your requirement. The accuracy will change as per your settings.
100% Non repaint indicator
Pre-alert (get ready) signals
Non-delay indications
24/7 signals
100% No lag
No recalculating The arrows wont repaint even if the signal fails, or you refresh or restart the mt4 Indicator is based on simple crossover strategy of main line and signal line of St
FREE

これはマルチ通貨対応のFXロボットで、1つのチャートからすべての対応通貨ペアの取引を実行します。多くの調査と複数のブローカーと設定でのライブテストを経て、このバージョンがリリースされました。このバージョンは一部のお客様限定です。今後のアップデート版は、このEAの既存購入者と機関投資家のお客様にのみ提供されますので、今すぐ入手してください。このFXロボットは、毎月一定の収入を得られる受動的な収入源として開発されています。 ご紹介オファー: 3ヶ月無料VPS ユーザーマニュアルと無料VPSについてはここをクリックしてください ライブ取引結果: Investor LoginとFXBlueを使用して、いくつかのライブアカウントを確認してください(一部のアカウントは毎月30%〜50%の利益を生み出しています). Click here
独占特集: このマーケットプレイスには、以下の優れた機能の組み合わせを備えたEAは存在しません。このマーケットプレイスにあるほとんどのEAは、ストップロスがテイクプロフィットよりも高く設定されており、長期的には持続可能ではありません。独自の

Indicador SMART MONEY CONCEPTS DRAW Este indicador te permitirá dibujar de forma sencilla, rápida y fácil todos los conceptos de Trading Institucional e Smart Money Concepts basados en la terminología de The Inner Circle Trader (ICT) necesarios para realizar análisis técnico en tus gráficos de Metatrader.
Este indicador ha sido desarrollado por el equipo de TradingForexTV y lo entregamos totalmente gratis para toda nuestra comunidad y seguidores de nuestro canal y redes sociales.
Algunos de lo
FREE

This EA trades using the Heiken Ashi Smoothed Indicator. It offers many trading scenarios and flexible position management settings, plus many useful features like customizable trading sessions, a martingale and inverse martingale mode. [ Installation Guide | Update Guide | Troubleshooting | FAQ | All Products ] Easy to use and supervise It implements three different entry strategies Customizable break-even, SL, TP and trailing-stop Works for ECN/Non-ECN brokers Works for 2-3-4-5 digit symbols T
FREE
製品説明: BBMA Dashboard Guide BBMA Dashboard Guide は、BBMA に基づいたインジケーターで、 MN1 から M1 までのすべてのタイムフレームにわたる マーケット構造 を、ひとつのシンプルで直感的なダッシュボードで確認できるように設計されています。 このツールを使えば、複数のチャートを切り替える必要はありません。重要な情報はすべて 一目で分かるダッシュボード に表示されます。 主な機能: マルチタイムフレーム構造
月足から1分足まで、BBMA 分析を瞬時に表示し、長期トレンドと短期の値動きを同時に把握可能。 ポテンシャルペアオプション
あなたのトレードスタイルに合わせて市場のチャンスを分析: スイングトレード → 中期取引。 デイトレード → 日中取引。 スキャルピング → 短期ターゲットで素早いエントリー。 Fibo Musang ツール
柔軟なフィボナッチ Musang を搭載: 縦型と横型のスタイル に対応。 エントリーゾーンや利益目標をより正確に決定。 ️ カスタムペアセレクター
ダッシュボード

BTCUSD GRID EA は、グリッド取引戦略を使用するように設計された自動プログラムです。 BTCUSD GRID EA は、初心者にも経験豊富なトレーダーにも同様に非常に役立ちます。 使用できる他のタイプの取引ボットもありますが、グリッド取引戦略の論理的性質により、暗号グリッド取引ボットは問題なく自動取引を簡単に実行できます。 BTCUSD GRID EA は、グリッド取引ボットを試してみたい場合に使用するのに最適なプラットフォームです。
BTCUSD GRID EA は、通貨が不安定な場合でも理想的な価格ポイントで自動取引を実行できるため、暗号通貨業界にとって非常に効果的です。 この自動取引戦略の主な目的は、EA 内で事前に設定された値動きで多数の売買注文を行うことです。 この特定の戦略は自動化が容易であるため、暗号通貨取引によく使用されます。 グリッド取引戦略を正しく使用すると、資産の価格が変化したときに利益を得ることができます。 グリッド取引戦略が最も効果的であることが証明されています 。 暗号通貨の価格が変動するため。
-------------------

KALIFX Trailing Stop Utility for MetaTrader 4 The KALIFX Trailing Stop Utility is a tool for automated stop-loss management on the MetaTrader 4 platform.
It monitors open positions and dynamically adjusts the stop-loss level as the price moves in favor of the trade.
The utility can also place initial stop-loss and take-profit levels and apply breakeven rules once the trade reaches a defined profit distance. Core Functionality 1. Trailing Stop Logic When the market moves in the direction of an o
FREE

This is a Multi pair and Multi time frame dashboard. The founder of the system is Mr. Oma Ally, which is a system based from Bollinger Band and Moving Average(BBMA). BBMA consists of the use of 2 indicators: Moving Averages Bollinger Bands BBMA consists of 3 types of entries: Extreme MHV Re-Entry Rejection EMA50 This Dashboard Help you to scan current Extreme, Reentry setup, Rejection EMA50 and also MHV How to read signals:
find the same color in 3 different timeframes in succession
For exampl
FREE
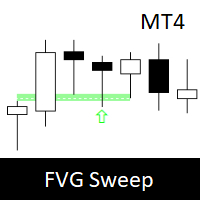
Fair Value Gap Sweep is a unique and powerful indicator that draws fair value gaps on your chart and alerts you when a gap has been swept by the price. A fair value gap is a price gap that occurs when the market opens at a different level than the previous close, creating an imbalance between buyers and sellers. A gap sweep is when the price moves back to fill the gap, indicating a change in market sentiment and a potential trading opportunity.
Fair Value Gap Sweep indicator has the following
FREE
If you can’t beat them, join them.
Trade where institutions seek liquidity. Bank Levels Tracker identifies institutional price zones where stop-hunts commonly occur — just beyond obvious swing highs and lows where retail stops cluster.
These “bank levels” are plotted in real time, never repaint, and trigger instant alerts when price reaches them. Built for traders who trade bank levels directly — or use them as high-probability confluence for better-timed entries.
How Bank Levels Tracker Work

*** 64% DISCOUNT, LAST CHANCE TO BUY THE EA AT $250, ONLY 3 COPIES LEFT AT THIS PRICE ***
Gold High is a complete automated trading robot that has been designed and created based on our best strategies in forex trading. All trades are protected by stop loss. Users can use a fixed lot or auto lot money management. Our team will regularly check the data and will publish updates If needed. Why this EA : T he EA has successfully passed live testing for over 116 weeks Smart entries calculated by

Sunan Giri EA by Victoradhitya Risk Disclosure :
Futures, Forex, Stock, Crypto and Derivative trading contains substantial risk and is not for every investor.
An investor could potentially lose all or more than the initial investment.
I am not responsible for any financial losses you may incur by using this EA!
ea uses a no martingle strategy or martingale strategy depends on your set
every trade always uses a hidden SL
EA has back test for 5 years
Minimum balance $1000
FREE

This is the technical document for GTB (Grid Trader Brazil) for the Market version. It details the strategic operation and the complete dictionary of available parameters. DEFAULT SET.set - DEFAULT ENGLISH SET!
️ IMPORTANT: DEFAULT SETTINGS The default settings of this EA are calibrated to be Ultra-Conservative (Low Frequency) to strictly comply with MQL5 Market Validation rules. For Real Trading Results: You MUST load a valid .set file. Check the Comments Section for the
FREE

ENGLISH DESCRIPTION (MQL5 Standard Optimized) Product Name: Aether Elliott Wave Zigzag Pro (MT4) [Subtitle: Wave 3 Hunter | Fib 0.618 Retracement | Margin Guard] Introduction Aether Elliott Wave Zigzag Pro is a lightweight, market-compliant scalping system designed to automate the classic Elliott Wave theory. Instead of complex wave counting, it uses a precision ZigZag algorithm to identify the high-probability 1-2-3 Structure and targets the Wave 3 impulse. Engineered for MT4 stability, it feat
FREE

/// Theranto V1 /// Strategy basic on support and Resistance and candle pattern also check the value of the market before open Price . Multicurrency Expert Can work on All Forex Pairs Best Pairs AUDCAD,GBPUSD ,AUDNZD,GBPNZD.NZDCHF,NZDCAD,EURNZD Shoot Trade All Trade have 60 pip SL Always Behind Market Super Fast Scalper
URL Link http://nfs.faireconomy.media/ff_calendar_thisweek.xml This Expert Working Whit News analysis whit out the URL Link can not see correc
The Trade Lines EA is an auxiliary Expert Advisor for automated trading based on levels. The EA opens deals at the specified lines when the price crosses them on the chart - the lines are active, they can and must be moved for the EA to operate with the greatest efficiency. The EA also includes the averaging, trailing stop and take profit setting functions. For the EA to work, it is necessary to select the required number of lines and the type of lines for the EA to trade. It is possible to enab
FREE

Description: This indicator draw ZigZag Line in multiple time frame also search for Harmonic patterns before completion of the pattern.
Features: Five instances of ZigZag indicators can be configured to any desired timeframe and inputs. Draw Harmonic pattern before pattern completion. Display Fibonacci retracement ratios. Configurable Fibonacci retracement ratios. Draw AB=CD based on Fibonacci retracement you define. You can define margin of error allowed in Harmonic or Fibonacci calculations
FREE

SMT (Smart Money Technique) Divergence refers to the price divergence between correlated assets or their relationship to inversely correlated assets. By analyzing SMT Divergence, traders can gain insights into the market's institutional structure and identify whether smart money is accumulating or distributing assets. Every price fluctuation should be confirmed by market symmetry, and any price asymmetry indicates an SMT Divergence, suggesting a potential trend reversal. MT5 Version - https:/

Description This Expert Advisor uses a proprietary indicator for market entries and it can generate an average profit of 8% monthly!
It can work with any forex pair but the best performance is achievable with USDCAD.
Not compatible with prop firm accounts. Recommended pairs USDCAD Timeframe
M5 Settings General Open New Trades - allows or inhibits the opening of new trades, does not act on the martingale which is still opened if necessary Risk Level - allows you to select the risk level Max Spre

Metatrader 4 サーバーから東部標準時 (ニューヨーク現地時間) を簡単に識別できるように、Metatrader 4 用に設計したこのカスタム インジケーター。ただし、ドロップダウン メニューからタイム ゾーンを変更することで、これを使用して現地時間を識別することができます。 選択したタイムゾーンの特定の時間に、任意の色の垂直線を追加できます。 選択したタイムゾーンまたは実際のサーバー時間に基づいて、始値、高値、安値、および終値の線を自動計算する水平線を追加できます。 クイック ノート: ニューヨーク東部標準時を使用する場合は、夏時間中は常に夏時間がオンになっていることを確認してください。 English: This custom indicator I designed for Metatrader 4 to be able to easily identify Eastern Standard Time (New York Local Time) from any metatrader 4 server. But, you can use this to identify
FREE

**Price Action Gold Trader** is a sophisticated, non-repainting multi-timeframe Price Action analysis indicator specifically designed for **XAUUSD (Gold)** trading on MetaTrader 4. This professional-grade tool automatically detects Price Action patterns, provides structured entry zones, precise stop-loss levels, dynamic take-profit targets, and comprehensive market state diagnostics.
Built with systematic trading in mind, this indicator transforms complex Price Action analysis into a fully aut

Trade History for MT4 This indicator is specially developed for that traders want to display his trades on the charts. Shows history and current deals on the chart. Trades show on the chart with a dotted line, and profit will show realtime. Buy trades are displayed in bull color, Sell trades in bear color.
Tip: The historical order displayed by the indicator is associated with the "Account History", so please set the historical order display in the "Account History" of MT software.
If you a
FREE

このEAの最初のバージョンは無料でしたが、トレーダーからの高い需要により、Emilian II をより多くのフィルターと高精度で作成しました。MACD、ADX、フラクタルを追加しており、今後のアップデートでお客様の要望に応じた機能がさらに追加される予定です。 今ご購入いただければ、将来のすべてのアップデートとサポートを受け取ることができます。 期間限定で可能な限り低価格で提供しており、今後価格は上がる予定です。 Emilian II は、移動平均線のクロスとオプションのテクニカルインジケーターフィルターを組み合わせた、柔軟なマルチタイムフレームトレーディング用に設計された自動エキスパートアドバイザーです。RSI、CCI、DeMarker、ボリューム、ADX、MACD、フラクタルなどの有名なテクニカル指標を使用して、上位タイムフレームの確認とエントリーロジックの精密な制御を行いたいトレーダーに最適です。 戦略ロジックの概要 Emilian II のコアロジックは次の要素に基づいています: EMAクロス
高速EMAが低速EMAを上または下にクロスしたときに、売買シグナルが発生します。 オ

この指標の背後にある考え方は、すべての時間枠でマレーレベルを見つけ、それらを組み合わせて、強力なマレーレベルに基づくシグナルレベルを含むコンボレベルにすることです (+2, +1, 8, 4, 0, -1, -2) 。 時間枠が短いほど、コンボレベルをすぐに確認する必要がある可能性が高くなります。 色で強調表示されます。 任意の番号にカーソルを合わせると、レベルが属する時間枠にヒントが表示されます。 ただし、常に現在の時間枠が左端の時間枠として表示されます。 スマートアラートは、シグナルコンボレベルに関連する価格を伝えるのに役立ちます。
ビデオのダッシュボードは宣言された機能ではなく、ここには含まれていません! まだ開発中です。
推奨される取引 テクニカル分析を追加することなく、コンボ水準からの反発を取引することは推奨されない。 青と赤のレベルからの反発の確率が高い。 価格はコンボレベルに磁化されているが、このレベルはまだ試されていない(ローソク足128本前)。この場合、レベルテイク(一段高・一段安)を用いたトレンド戦略を推奨する。 価格が赤または青のレベルに向かって

I am glad to welcome you on the page of my product. Ghidorah EA is a conceptually new automated trading advisor using a scalping strategy. Ghidorah is a profitable and fully automated Expert Advisor for both beginners and pros. This EA is excellent for Long-Term Profits. Ghidorah is a proven short term scalping system with outstanding results over many thousands of trades. The EA focuses on short-term intraday trading and places pending orders at a possible break out levels. Also, one of the
This EA trades Classic Pivot Points using pending orders. It offers many trading behaviors and flexible position management settings, plus many useful features like customizable trading sessions and a martingale mode. [ Installation Guide | Update Guide | Troubleshooting | FAQ | All Products ] Easy to use and supervise It implements 4 different trading behaviors Customizable break-even, SL, TP and trailing-stop Works for ECN/Non-ECN brokers Works for 2-3-4-5 digit symbols Trading can be NFA/FIFO
FREE

Upper and Lower Reversal - 反転の瞬間を早期に予測するシステム。上限と下限の価格変動チャネルの境界にある価格の転換点を見つけることができます。
インジケーターの色が変わったり、信号矢印の位置が変更されることはありません。 赤い矢印は買いシグナル、青い矢印は売りシグナルです。
あらゆる時間枠と取引商品に調整します インジケーターは再描画されず、ローソク足が閉じるときにのみ機能します。 信号のアラートにはいくつかの種類があります このインジケーターは使いやすく、構成可能な外部パラメーターは 2 つだけです。
Channel Length - シグナルが構築される価格チャネルの長さを調整します。 Signal Normalization - シグナル矢印の品質レベルを変更します。パラメーターが高くなるほど、誤ったシグナルが減少します (BTC、ゴールド、および揮発性の高い商品では数桁変化します)。 Alerts play sound / Alerts display message / Alerts send notification / Send emai

ADX arrow このインジケーターは、ADXインジケーター(平均方向移動インデックス)の信号をチャート上のポイントとして表示します。
これにより、信号の視覚的識別が容易になります。 インジケータはまた、警告(ポップアップメッセージボックス)プッシュと電子メールに信号を送信する機能します。
パラメータ 期間-期間を平均化します。 計算に使用される価格:終値、始値、高値、安値、中央値(高値+安値)/2、標準値(高値+安値+終値)/3、加重終値(高値+安値+終値)/4。 アラート-アラートを有効/無効にします。 電子メール-電子メールへの信号の送信を有効/無効にします。 Period - averaging period. Apply to - price used for calculations: Close, Open, High, Low, Median (high+low)/2, Typical (high+low+close)/3, Weighted Close (high+low+close+close)/4. Alert - enable/disable a

トライアルをダウンロード
動作原理 EAがアクティブな場合、実行モードパラメータに基づいてチャートを分析します。 チャート上に既存のポジションがない場合、EAはパラメータに基づいて取引を行います。トレンドが上昇トレンドの場合、買い取引を行い、下降トレンドの場合は売り取引を行います。そして、ストップロス変数が0より大きい場合、オープンした取引価格から一定の距離にストップロス注文も設定します。0はストップロスなしを意味します。 チャート上に既存のポジションがあり、最後のポジションが損失の場合、EAは現在の市場価格と注文との間の距離がユーザーが設定した最小距離以上であるかどうかを確認し、それに基づいて取引を行います。ロットサイズはマーチンゲール法を使用して計算され、ストップロス変数が0より大きい場合、オープンした取引価格から一定の距離にストップロス注文も設定します。 Hedging(ヘッジ)がfalseに設定されている場合、EAは一度に1つの方向にしか取引しません。最初のポジションが買い取引の場合、すべての後続のマーチンゲールポジションも買い取引でなければなりません。最初のポジションが売り
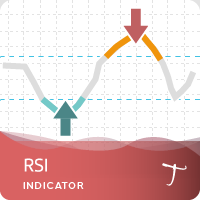
Tipu RSI Features 28 symbols, multi-time frame powerful Dashboard for the full market view Customizable Buy/Sell alerts, push alerts, email alerts, and visual on-screen alerts. Marked overbought and oversold levels. Three colors RSI that marks the normal, oversold and overbought levels. The relative strength index (RSI) is an oscillator devised by J. Welles Wilder in his famous book New Concepts in Technical Trading Systems in 1978.1 He also introduced Parabolic SAR (see Tipu Parabollic SAR Pane
FREE

PRO ADVANCED MULTI SCALPING EA は、完全自動のマルチペア取引システムで、非常に安全で着実な成長を遂げています。
この収益性の高いスキャルピングEAは、現在市場で最も安定したシステムの一つです。月間約60~90回の取引で運用可能です。
テストと取引用のEA設定ファイルをダウンロードしてください: USDCHF Set_file GBPCHF Set_file GBPCAD Set_file GBPAUD Set_file EURCHF Set_file EURCAD Set_file EURAUD Set_file AUDCAD Set_file
EAの特徴: - 調整可能なボラティリティ - 適応型ストップロス - 固定ストップロスオプション - システムは安全で、グリッドやマーチンゲール法などの危険な手法は使用していません。各注文には、アカウント保護のための独自のストップロスが設定されています。 - このEAは非常に使いやすく、FXのプロと初心者の両方が使用できます。 - ロボットがすべてを自動的に実行します。必要なのは、適切なリスク(デフォルト

Comprehensive on chart trade panel with the unique ability to be controllable from mobile as well. Plus has a library of downloadable configuration, e.g. exit rules, extra panel buttons, pending order setup and more. Please see our product video. Works with all symbols not just currency pairs. Features On chart panel plus controllable from free app for Windows, iPhone and Android Built-in script engine with library of downloadable configuration, e.g. add 'Close All Trades in Profit' button, exit

Heikin Ashi Smoothed – MT4インジケーター Heikin Ashi Smoothed(平均足スムースド) は、従来の平均足チャートに独自のスムージング処理(移動平均の組み合わせ)を加えることで、相場のトレンドをよりなめらかに、かつ直感的に可視化するためのMT4用カスタムインジケーターです。通常のローソク足や平均足よりも、無駄な値動き(ノイズ)を大きく除去でき、トレンドの持続や転換を判断しやすくなります。 主な特徴 平均足の値をさらに移動平均でスムージングし、滑らかなローソク足としてチャート上に表示 小さな値動きやヒゲのノイズを自動で除去し、主要なトレンドの方向性が一目で分かる トレンド転換点を見つけやすく、無駄な売買サインを抑えることでエントリー・エグジット判断の精度向上 全ての時間足・通貨ペア(FXはもちろんCFDや株価指数など)で使用可能 動作が非常に軽快で、多数チャートへの同時表示も負荷が少ない インジケーターの仕組み Heikin Ashi Smoothedは、まず通常の平均足(Heikin Ashi)の計算で4本値(始値・高値・安値・終値)を生成し、さ
FREE

可能であれば購入をご検討ください 私が開発を続ける MT5 バージョン (この MT4 バージョンの今後の更新はありません)。こちらもお読みになることをお勧めします 製品のブログ (マニュアル) を最初から最後まで参照して、EA が提供するものを最初から明確にします。 このエキスパートアドバイザー (EA) の主な戦略は、3 つの移動平均 (MA) が連続して整列し、互いに一定の距離にある場合に取引を行うことです (たとえば、一部の機関投資家が使用するあまり知られていない戦略に使用できます)。 、これには D1 時間枠の MA 10、20、および 30 が含まれます)。 EA は、H1 以降の時間枠で最適に機能します。トリプル MA 戦略 (使用される MA: に関係なく) は、長期的な戦略と見なす必要があります。悪い月が続くかもしれません。したがって、この EA は、頻繁な取引と短期的な一定の利益を求めるトレーダー向けではありません。デフォルト設定は EURUSD H1 用に最適化されています (2015.01.01 から 2022.03.31 までのバックテスト、22

BBRSI Quantum (Free Edition) BBRSI Quantum is a powerful, 100% Non-Repainting indicator for MetaTrader 4 that generates clear Buy and Sell arrows based on an advanced momentum strategy. This tool is designed for traders who want to identify precise entry points during overbought or oversold conditions. This is the fully functional FREE edition. The Core Strategy: Bollinger Bands on RSI Unlike standard indicators, BBRSI Quantum does not apply Bollinger Bands to the price. Instead, it applies th
FREE
MetaTraderマーケットはトレーダーのための自動売買ロボットやテクニカル指標を備えており、 ターミナルから直接利用することができます。
MQL5.community支払いシステムはMetaTraderサービス上のトランザクションのためにMQL5.comサイトに登録したすべてのユーザーに利用可能です。WebMoney、PayPal または銀行カードを使っての入金や出金が可能です。
取引の機会を逃しています。
- 無料取引アプリ
- 8千を超えるシグナルをコピー
- 金融ニュースで金融マーケットを探索
新規登録
ログイン