M1 Signal Scanner MT4
- インディケータ
- バージョン: 1.5
- アップデート済み: 27 2月 2026
- アクティベーション: 20

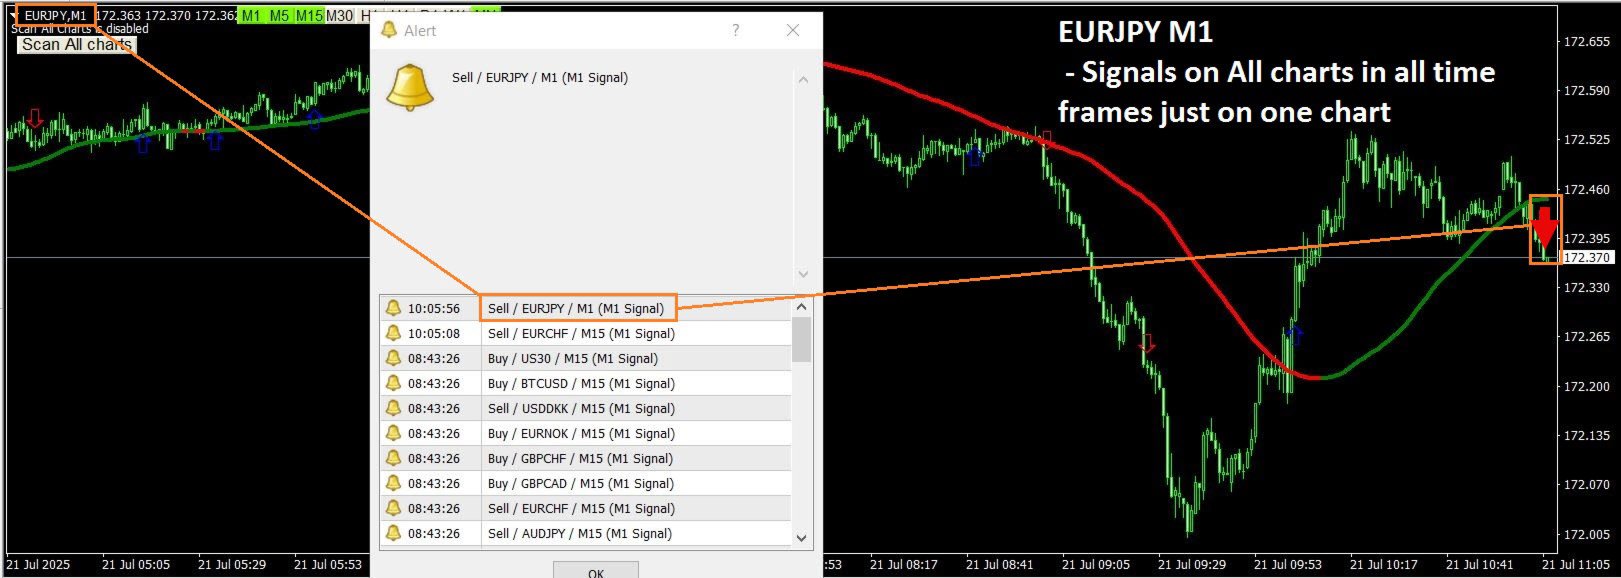
** All Symbols x All Time frames scan just by pressing scanner button **
After 18 years of experience in the markets and programming, Winner indicator is ready. I would like to share with you!
*** Contact me to send you "Trend Finder indicator" free, instruction and add you in "M1 Signal Scanner group" for sharing or seeing experiences with other users.
Introduction:
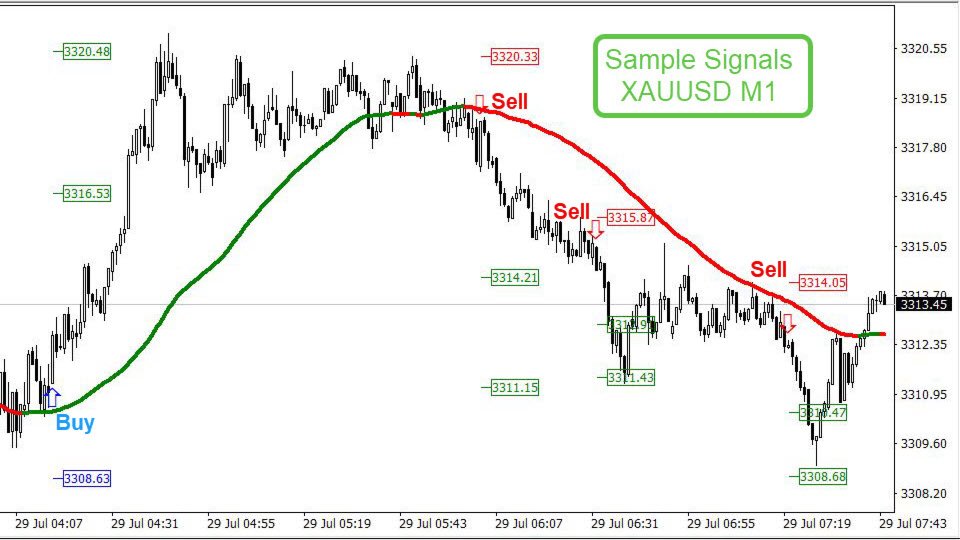
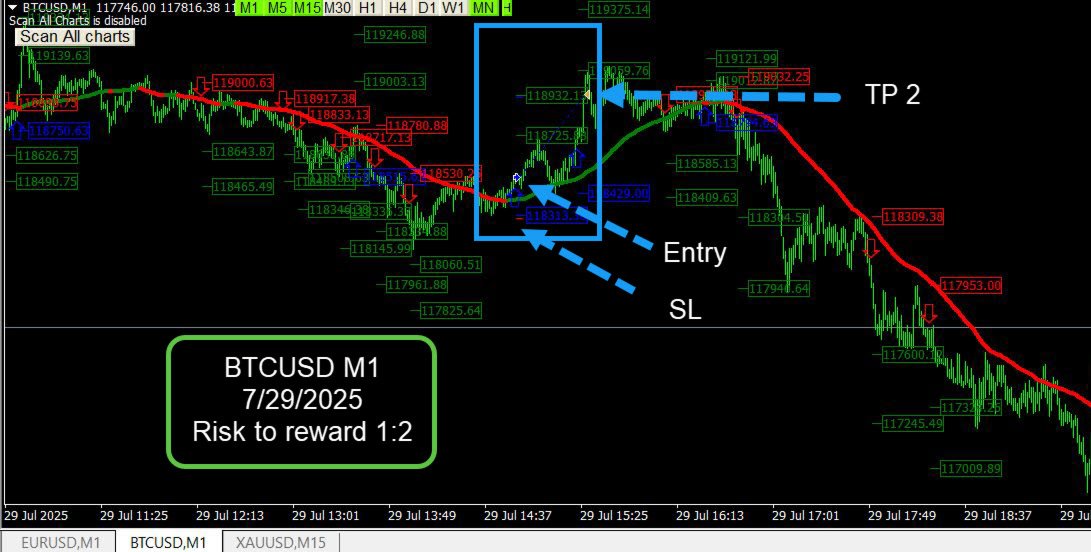
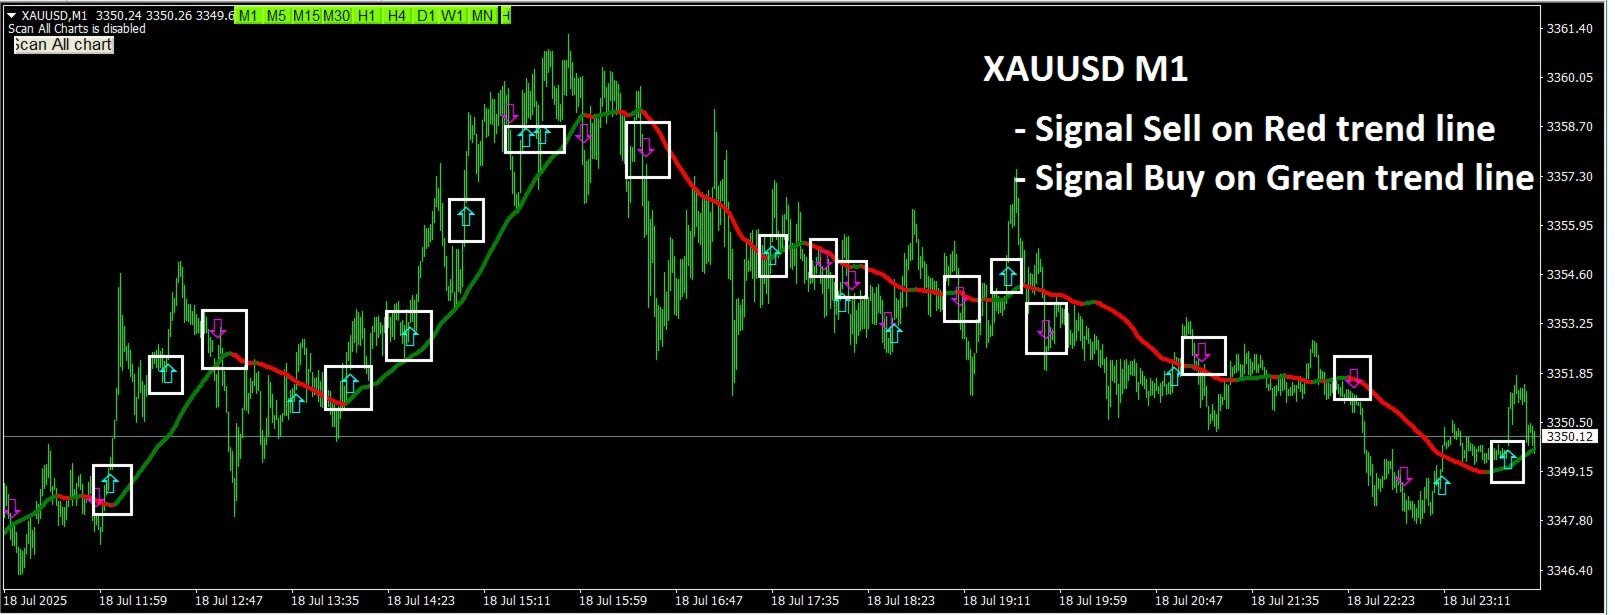
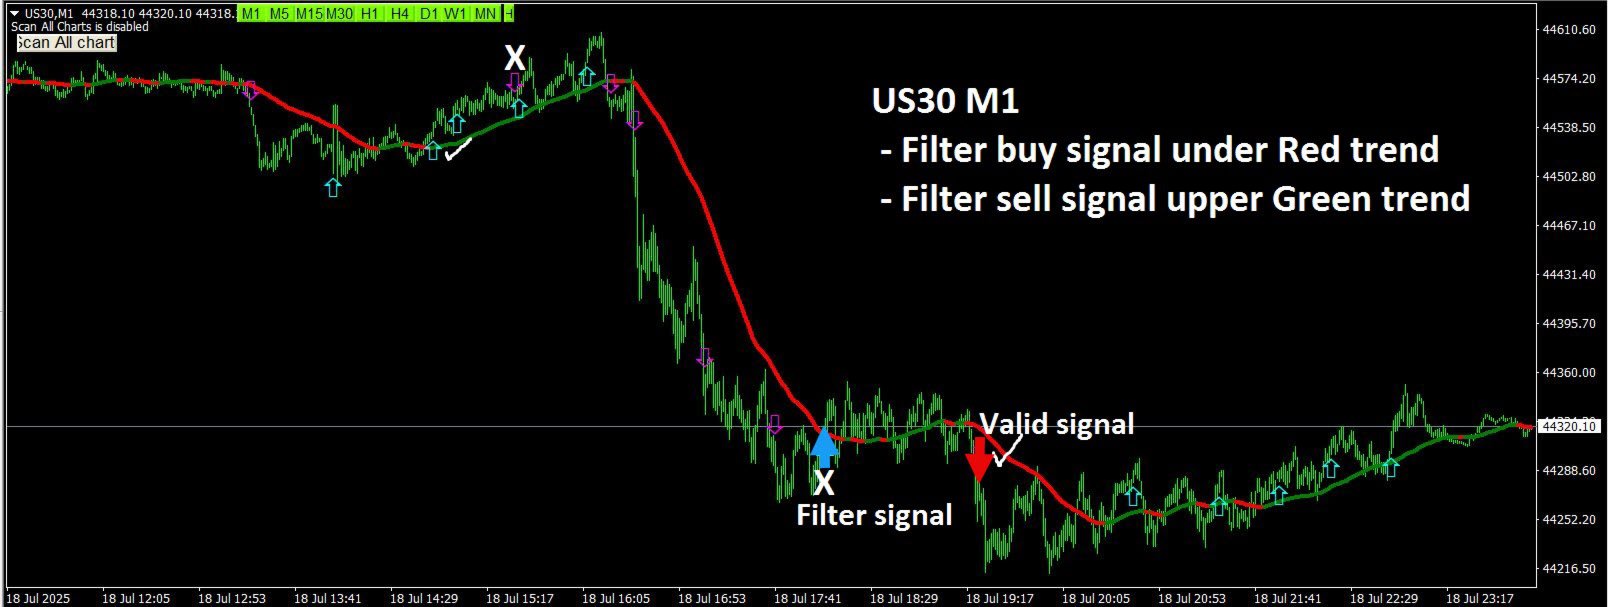
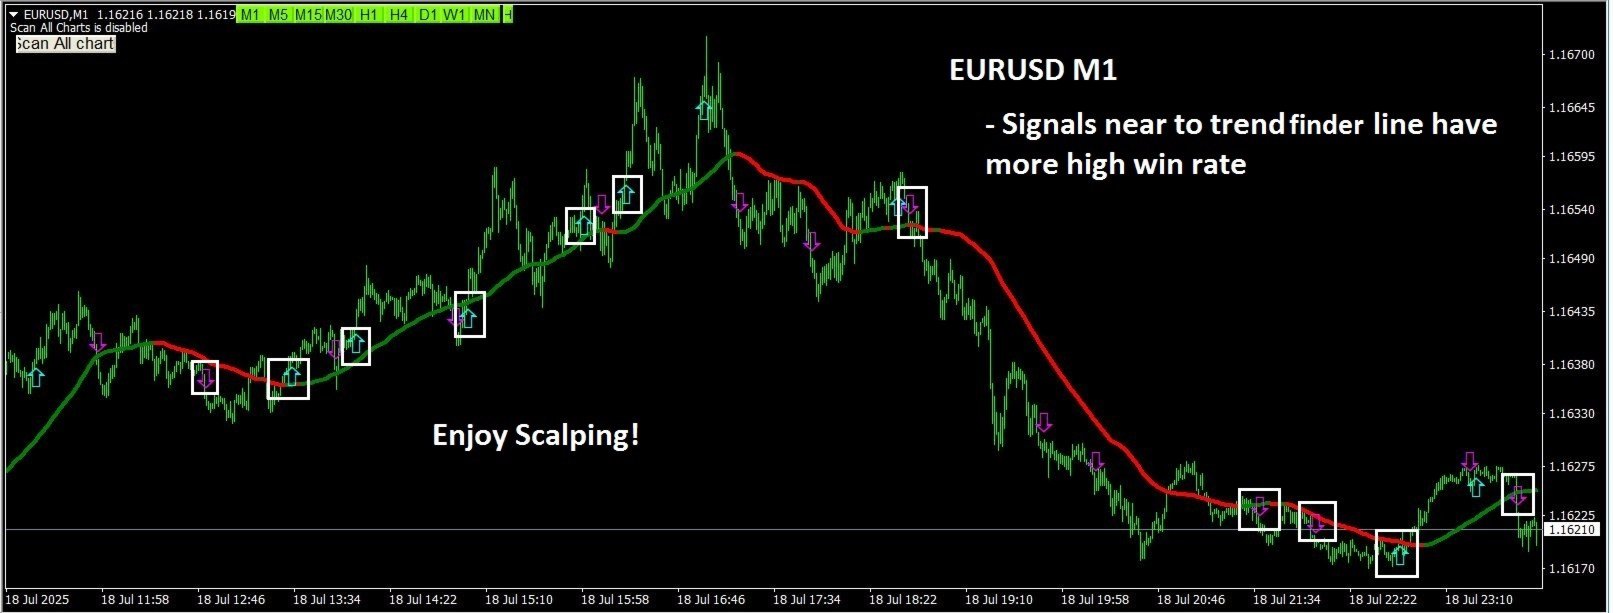
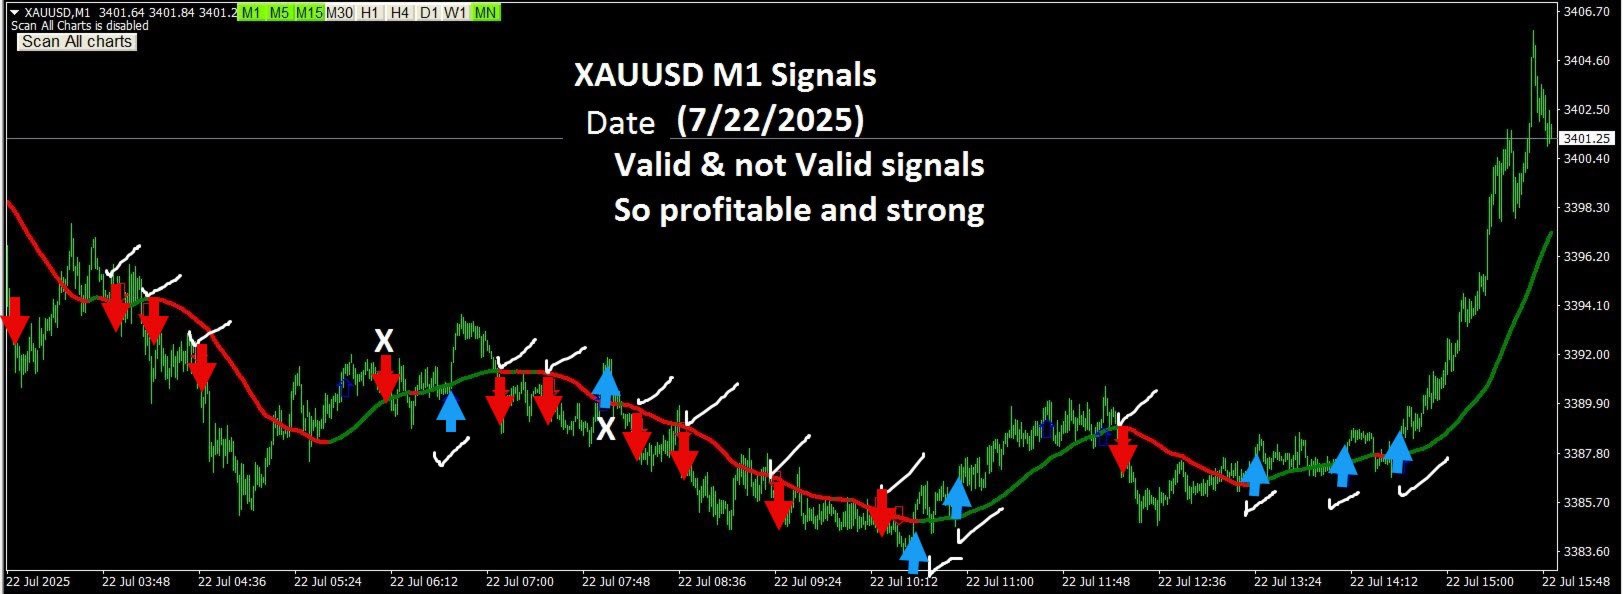
M1 Signal Scanner is the indicator designed scalping M1 time frame to detect Small trend switching in the direction of the trend and possible reversal. The indicator studies several price and time vectors to track the aggregate trend direction and detects situations in which the market is oversold or overbought and ready to correct.
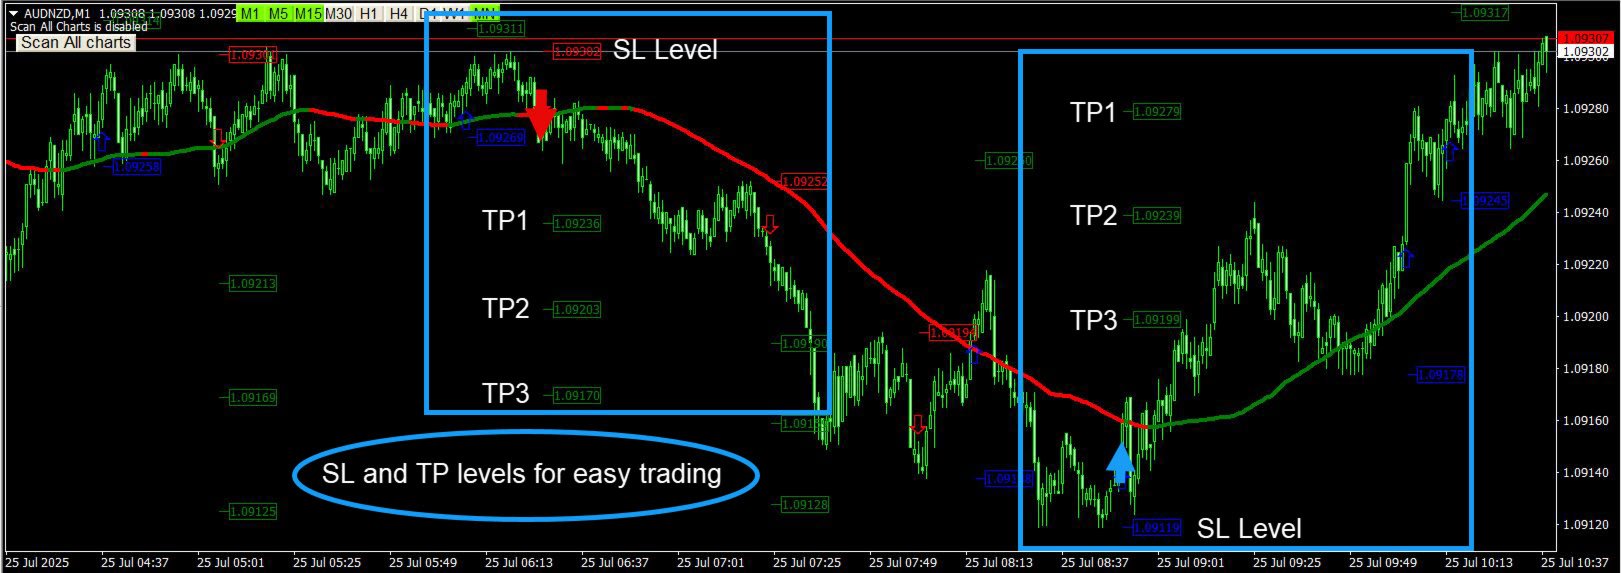
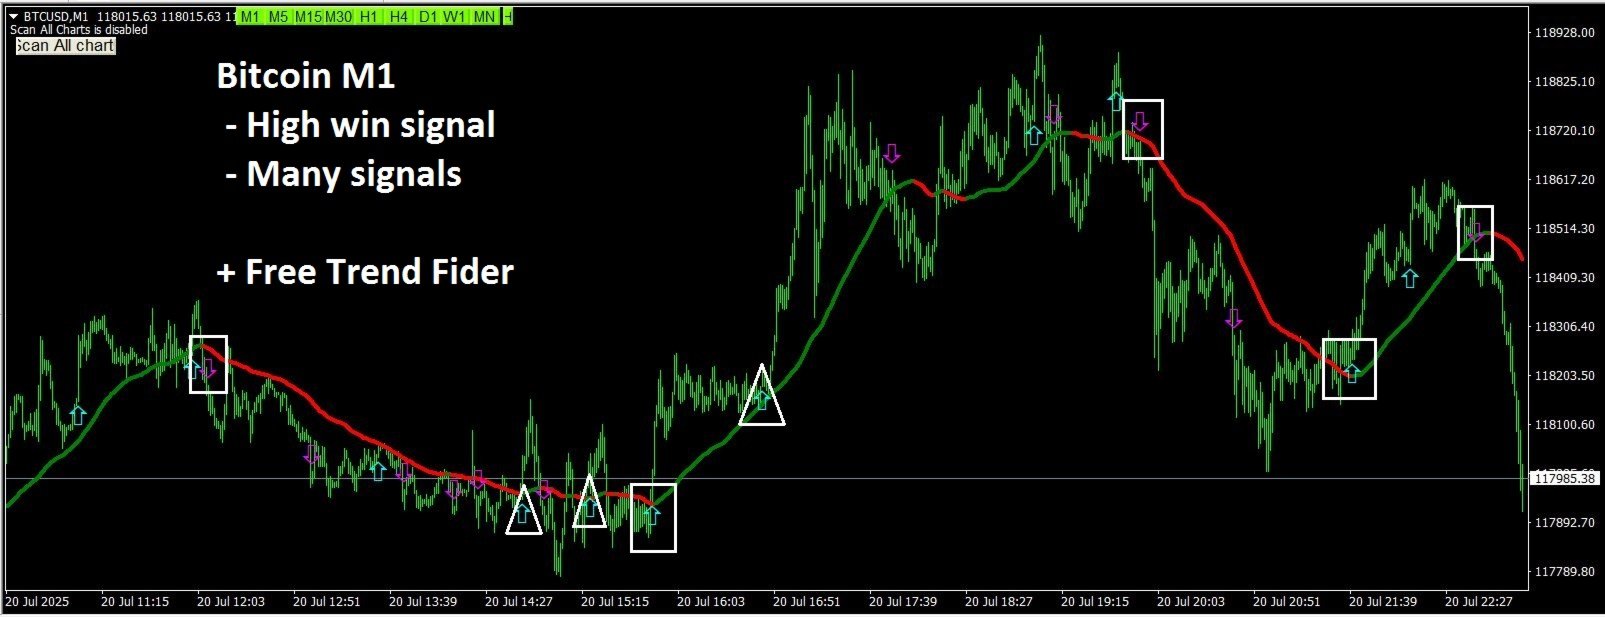
This indicator shows many signals that is a strong hint for an excellent entry point and finds immediately with alarm and notification and also has stop loss, take profits and entry point with candlestick checking for easy trading.
It is suitable for trading in all time frames.
+ Trend Finder indicator FREE
Main Features:
- Detect the best and most successful signals for scalping
- Easy-to-use and user-friendly indicator
- NO repaint
- NO delay
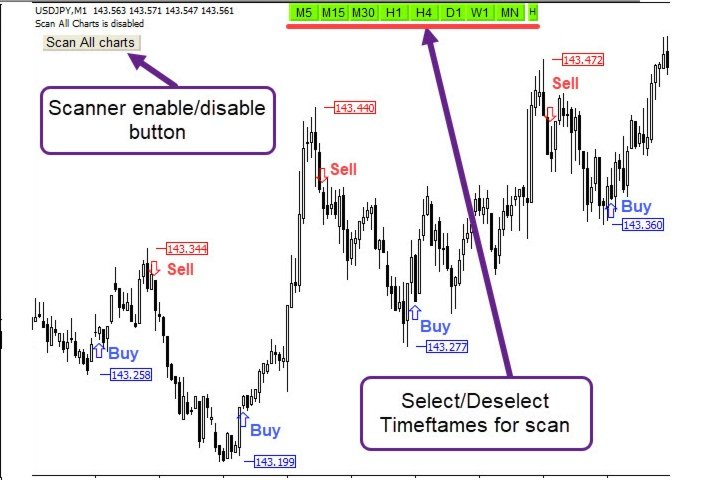
- Scan All charts button ( Forex, Crypto, Indices and commodities )
- Select and deselect time frames button for scan (M1,M5,M15,M30,H1,H4,D1,W1,MN)
- Candlestick check for the best entry point
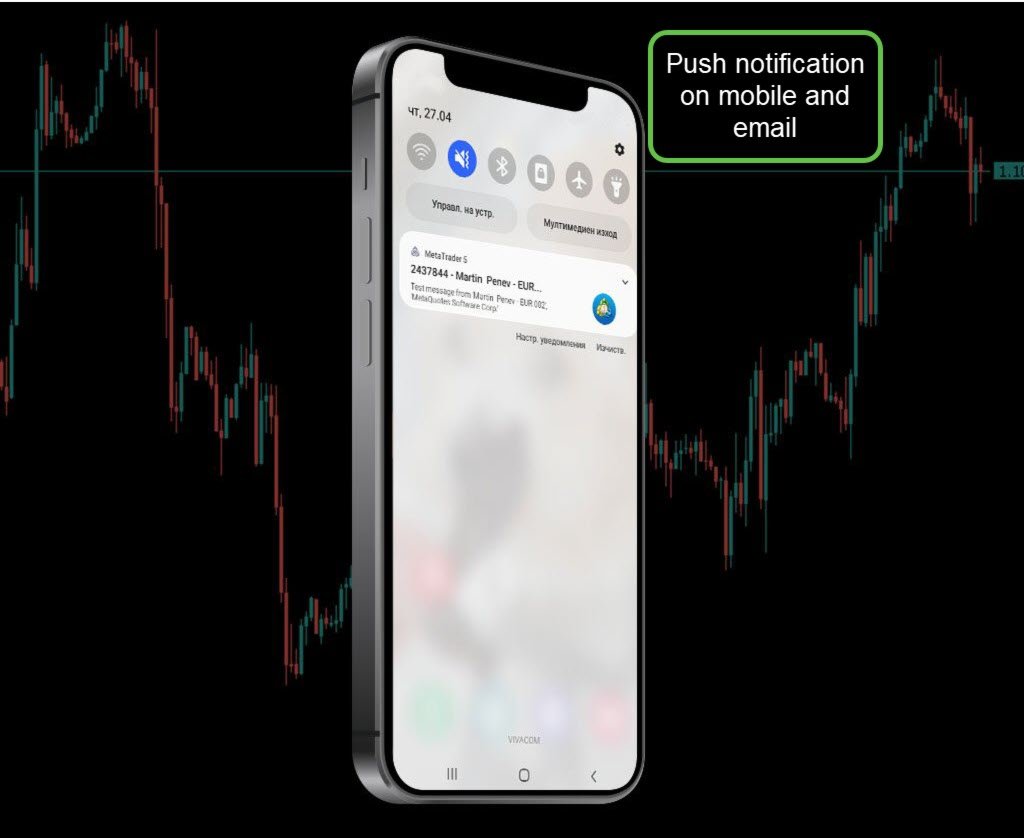
- Sending the alert, push and email notification
- Alert enable/disable base on your setting time
- Adjust the pattern setting
How to test

Simple and functional, I recommend it.