YouTubeにあるマーケットチュートリアルビデオをご覧ください
ロボットや指標を購入する
仮想ホスティングで
EAを実行
EAを実行
ロボットや指標を購入前にテストする
マーケットで収入を得る
販売のためにプロダクトをプレゼンテーションする方法
MetaTrader 4のためのエキスパートアドバイザーとインディケータ - 27
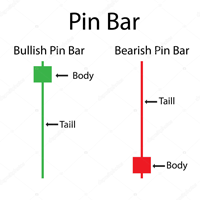
Pin bar pattern is characterized by a long upper or lower wick with a small body relative to the size of the wick with little to no lower or upper shadows. Pin bars are not to be traded in isolation , but need to be considered within the larger context of the chart analysis. A pin bar entry signal, in a trending market, can offer a very high-probability entry and a good risk to reward scenario.
Inputs MinimumTailPips- Minimum size of Tail in pips; TailBodyCandle- means how many times Tail grea
FREE

The Super Arrow PRT Indicator generates high-probability trading signals by using multiple indicators such as Moving Averages, Bull/Bear power, Relative Strength Index (RSI), Bollinger Bands, and Magic Filter. It filters out false signals and provides good trade signals by combining these indicators. The Supper Arrow PRT indicator is a trend reversal system that paints buy/sell signal arrows at the potential reversal zone of the price. The buy/sell signal arrows are painted directly on the ch
FREE

EA All-Seeing Eye is the latest trading robot for Forex and Gold market. Programmed with advanced and unique algorithms, the strategy identifies distinct volatility patterns for entry and exit to optimize performance, control risk and take advantage of short-term trends. Combines scalping and Trailing methods to quickly capture small profits and quickly exit the market. Stop Loss, Trailing parameters are customizable in the settings. EA has been optimized with default settings, users can start w

Introducing the latest automated trading system for the Gold market (XAUUSD) - EA Deep Gold - programmed with the latest advanced algorithms. The strategy analyzes price movements and correlates them with indicators to find high probability signals and enter trades. Combined with the Trailing method to optimize profits along with tight Stop Loss to control risks. Stop Loss, Trailing parameters... are available for users to customize according to their own plans. The EA's strategy is suitable fo

The Golden Engine EA is an advanced automated trading system designed exclusively for Gold (XAUUSD). Powered by proprietary algorithms, it continuously monitors short-term price dynamics to identify high-probability trading patterns. Each position is executed with carefully calculated Stop Loss and Take Profit parameters, without Trailing.
The EA has been optimized for default settings on Gold with 2 digits for simple installation and use without the need for set files. Settings: Max Sprea

This is an unconventional version of the Heiken Ashi Smoothed indicator implemented as lines rather than a histogram. Unlike a usual histogram, the indicator draws the readings of the two moving averages in the form of colored lines.
Example If the candle crosses two indicator lines upwards, a trend is assumed to be changing from bearish to bullish. If the candle crosses two indicator lines downwards, a trend is assumed to be changing from bullish to bearish. The indicator is good at displaying
FREE

Live Signal (Real Trading Data) https://www.mql5.com/zh/signals/2341050 Live Signal (Real Trading Data) : https://www.mql5.com/zh/signals/2346893 Smart Trend and Range EA Smart Trend and Range EA is an automated trading program designed to operate based on market structure analysis under different market conditions. The EA analyzes price behavior and market structure to apply different trading logic in trending markets and ranging markets.
It does not use martingale, grid, averaging, or recover
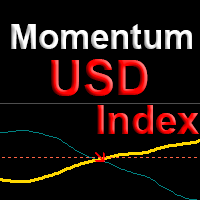
The indicator shows points for the continuation of the trend for currency pairs with the participation of the USD dollar with a probability of more than 80%. The algorithm is based on comparing the momentum of the current currency pair with the momentum of the DX dollar index at the current time. Using the dollar index allows us to evaluate not only the current pair, but the entire picture for all major currencies at once. This approach increases the reliability and reduces the number of false p

AIP – MT4/MT5 To Telegram 1 Main features of MT4/MT5 EA To Telegram: Send all types of orders (Open Order/Close Order/Partial Close/Modify Order/Pending Order/Delete Order) Close and Modify Order with replies to the corresponding Open Order Support sending to both private, public channels and group, topic group Support sending to multiple channels simultaneously Send Chart Screenshots Manage all symbols with a single EA on one terminal Automatic loading of templates, logos, and screen

Volume Profile Order Blocks - A smarter way to visualize liquidity, volume, and key levels. Volume Profile Order Blocks is a cutting-edge indicator that enhances traditional order block strategies by embedding a detailed volume profile directly within each zone. This provides traders with a clear, data-driven view of where institutional interest may lie — not just in price, but in volume distribution. MT5 Version - https://www.mql5.com/en/market/product/146215/ Join To Learn Market Depth
Local Trade Copier is an advanced tool designed for efficiently copying trades between accounts in the local mode. It allows for lightning-fast order replication from a master account to a slave account. In local mode, trades are copied instantly, while in remote mode, the copying process takes less than 1 second. MT5 Version MT5 Full Version (Local & Remote) MT4 Full Version (Local & Remote) Local mode refers to both MetaTrader platforms being installed on the same system. It fully suppo
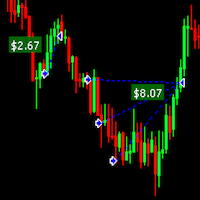
Draw Profit indicator can efficiently help those traders who want to see on the chart all closed positions output: profit or loss. If set DrawProfit on your chart managed by an Expert Advisor (EA) you will see clearly it’s performance by its profits & losses. My other products: https://www.mql5.com/en/users/hoangvudb/seller
Input parameters: Show Profit Labels : show profit of orders with a label (true/false). Profit Mode : available options: Show in currency. Show in pips. Show in currency a
FREE

Gold Pro Scalper
Precise entry points for currencies, crypto, metals, stocks, indices! Indicator 100% does not repaint!!!
If a signal appeared, it does not disappear! Unlike indicators with redrawing, which lead to loss of deposit, because they can show a signal, and then remove it.
Trading with this indicator is very easy.
Wait for a signal from the indicator and enter the deal, according to the arrow
(Blue arrow - Buy, Red - Sell).
I recommend using it with the Trend Filter (download

Scalping indicator. It takes into account volatility, price movement in the local interval and the direction of the current trend. Recommended timeframe - M5. Advantages: Low volatility when a signal appears ensures minimal movement against an open position. The indicator does not redraw its signals. There are alert signals. It is a great tool for day trading.
Settings: Name Description Period Indicator period Range of each bar in the period (pp.) The maximum size of each candle in the indicato
FREE

It is a system with many options to help each user find their own settings. There are possibilities to use a filter based on two averages, as well as the choice of whether the system will work at certain hours of the market. The default settings are tested for the eurusd pair. I would recommend that each user do their own testing and find settings that suit their preferences. This is not a ready-made system that you will use without working on it. But it is a good tool to build each user a strat
FREE

RSI TheTrendWaveは、MQL4のエキスパートアドバイザー用のダブルRSIとスマートマーチンゲール戦略を組み合わせたもので、RSIベースのトレンド識別と、修正されたマーチンゲールシステムを使用してドローダウンを減らすリスク管理アプローチを提供します。以下がその仕組みです: ダブルRSIシグナル: 短期RSIが長期RSIを上回り、両方が特定の売られ過ぎの閾値(例: 30)を下回った場合、買いシグナルが発生します。 短期RSIが長期RSIを下回り、両方が買われ過ぎの閾値(例: 70)を上回った場合、売りシグナルが発生します。 このエキスパートアドバイザー(EA)は、すべての通貨ペアに同じダブルRSIロジックを適用し、各通貨ペアに特有の買われ過ぎと売られ過ぎの条件に基づいて売買の機会を特定します。EURUSD、GBPUSD、USDCADの流動性とボラティリティの違いにより、EAはトレンドや反転を効果的に検出します。 スマートマーチンゲールアプローチ: 初期ポジション : RSIシグナルに基づいて取引を開き、初期ロットサイズは小さく設定されます。 マーチンゲールの乗数 : 取引がE
FREE

The three white soldiers and the three black crows candlestick patterns are reversal patterns that predict a change in the direction of a trend. The pattern consists of three consecutive long-bodied candlesticks that open within the previous candle's real body and a close that exceeds the previous candle's. It's important to note that both formations are only valid when they appear after a strong uptrend or a downtrend, while their efficiency decreases in choppy markets.
Inputs AlertOn - en
FREE

Defines extremes. This indicator consists of two parts. The first draws lines on the chart indicating low volatility in relative daily market activity. The second is responsible for determining the extremum and gives signals to buy or sell. This system is suitable for all instruments. It is recommended to use a timeframe from m15 to h4. Before using, you need to choose the settings for yourself. Configure lines deviation. Specify volatility coefficient. Advantages The indicator does not repaint
FREE

Introduction To Time Box Indicator Time Box Indicator is a must have indicator for any trader. It will display daily, weekly and Monthly box according to your preferences. Yet, you can extend any important price levels in your chart automatically. You can use them as the significant support and resistance levels. It is very simple but effective tool for your trading.
Graphic Setting Use White Chart Line Style for Current Open price
Daily Setting Update Timeframe for daily box Number of days to
FREE

This comprehensive technical indicator calculates and plots up to 3 moving averages with 3 different periods. By employing three moving averages of distinct lookback periods, the trader can confirm whether the market has indeed experienced a change in trend or whether it is merely pausing momentarily before resuming its prior state. SX Golden MA Pack for MT5 is available here . The shorter the moving average period, the more closely it tracks the price curve. When a security initiates an upt
FREE
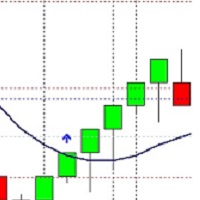
Renko Booster Choose to open a position, buy or sell, or both. Open a position with one, two or any number of reverse blocks. Close the position one, two, or any number of upside down blocks. Close position after pips. Specify the exact trading time. In my opinion, the EURUSD pair works best. 10 or 20 pips box. It also works on other pairs. Parameters in points: 10 pips = 100 points etc. My strategy EURUSD H4 box 200 points (200 points Stop Loss and 200 points TP, One reverse block, opening).
FREE

Just another plain Super Trend indicator.
On this one i have added another buffer (on index 2) which can be used on EA; the values is -1 to identify a bearish trend while for bullish trend the value is 1.
Here a code snippet:
int trend = ( int ) iCustom ( NULL , Timeframe, "SuperTrend" , Period , Multiplier, 2 , 1 ); It work on every timeframe.
If you need help to integrate it on your EA, don't hesitate to contact me.
FREE

Multi Time Frame Indicator acts as a Scanner based on the Ichimoku Trading System. The outcome is displayed on a board. This helps you to make "at a glance" a mental picture of the System without having to open the chart. Up to 10 Currencies can be watched. Scanned elements And Legend "KUMO Futur" - Green : The Kumo Futur is Bullish. "KUMO Futur" - Red : The Kumo Futur is Bearish. "PRICE Cross KJ" - Green : The Price is Above the Kijun Sen. "PRICE Cross KJ" - Red : The Price is Below the Kijun
FREE

CandleStick Countdown – ローソク足残り時間表示インジケーター CandleStick Countdownは、現在のローソク足があと何分何秒で確定するかをリアルタイムでカウントダウン表示するシンプルで実用的なMT4用インジケーターです。トレードのタイミング精度向上に役立ち、多くのトレーダーに支持されています。 主な機能 現在のローソク足の残り時間を「分:秒」形式で表示 チャート上にテキスト形式で表示され、高い視認性を実現 表示位置は現在のレート付近に自動調整されるため見やすい フォントサイズや文字色を自由にカスタマイズ可能 チャートの時間足に関係なく対応(M1からMNまで使用可能) インジケーターの活用ポイント ローソク足の確定タイミングを一目で把握できるため、エントリーやエグジットの判断に役立つ 短期トレードやスキャルピングなど、タイミング重視のトレードスタイルに最適 トレードの精度向上に寄与し、無駄なエントリーや早すぎる決済を防ぐサポートをする パラメーター設定 パラメーター名 説明 初期値 LabelColor 表示されるテキストの色 Yellow Font
FREE

ENGLISH DESCRIPTION (MQL5 Standard Optimized) Product Name: Aether GannFlow – Scalper Market v2 (MT4) [Subtitle: Gann Fan Logic | Trend Pullback | Margin Guard Protection] Introduction Aether GannFlow is a lightweight M5/M15 scalping system that bridges the gap between classical momentum trading and geometric market analysis. It combines a robust EMA Trend + RSI Pullback engine with the unique directional filter of the Gann Fan . Designed for stability on MT4, it features a "Margin-Guard" proce
FREE

Was: $99 Now: $49
Blahtech Daily Range indicator displays the average daily range alongside the individual session ranges. Using the daily open price as a reference the indicator shows fixed range and dynamic range targets as lines on the charts. These lines clearly show when the average range has been exhausted. Daily and session ranges can be useful for confirming entries or setting targets and is an excellent odds enhancer for many trading systems. Links [ Documentation | Install

Genghis Khan Dominion EA: Conquer the Markets with Unmatched Power Hello Traders! Prepare to dominate the financial battlefield with the Genghis Khan Dominion EA – an unstoppable force combining strategic brilliance with cutting-edge technology. This Expert Advisor is your ultimate weapon for mastering high-frequency trading, bringing the relentless precision and unmatched dominance of Genghis Khan to your trading strategy. Join the Conversation: Telegram Channel for Genghis Khan Dominion E
FREE

简介
不重绘入场信号的趋势指标 显示精确的价格反转指标。是可以添加到任何图表中的交易武器。 反转信号有高度准确性,适合在5分钟进行剥头皮交易,或在30分钟波段交易。买入和卖出箭头在图表上显示为进入信号,但在K线结束后形成带有警报的确认选项。 很多交易者在Super Trend MT4指标的帮助下,在第一个交易周内改善了交易结果。 优点
不重新绘制仪表板箭头 仅适用于台式机MT5 适合剥头皮 适合波段交易 仪表板箭头输入警报 仪表板箭头信号严格警告“蜡烛图收盘关闭” 移动警报、桌面警报、电子邮件警报 显示任意时间段的箭头 适用于任何Mt4货币对 适合新手和专家交易员 设置 Period: 周期 Multiplier: 倍增器 Show Trend Line : 显示趋势线 Show Arrow: 显示箭头 关于我们 欲了解更多我们产品信息,请 点击这里
FREE
Advanced Breakout Scanner Dashboard Stop missing powerful breakout opportunities! The Advanced Breakout Scanner Dashboard is a professional-grade trading tool that monitors up to 28 currency pairs in real-time, scanning for ten unique high-probability breakout strategies simultaneously. Attach it to a single chart to get a complete overview of the entire market, instantly identifying the best trading setups as they happen. This is not just a signal indicator; it's a complete trading dashboard d
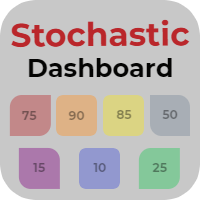
Stochastic Dashboard is an information panel which allows you to have a global market vision through a stochastic indicator. Stochastic Dashboard analyzes and tracks all the assets you want to invest in. Take advantage of this useful dashboard where you can open in a few seconds the chart and quickly invest in it.
Main features of Stochastic Dashboard Graphical panel that allows you to know the situation of many assets. 7 different stochastic situations to discover when an asset is overbought o
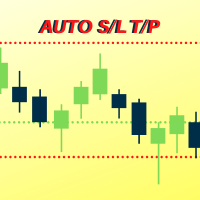
Number one rule to investing is to protect your capital. Never worry about trading without stop loss or take profit with Auto S/L T/P. Auto S/L T/P will automatically add your preset default stop loss and take profit to any order on the chart it's installed. Be sure to enable auto trading in order for the EA to work.
Entering a trade on the go from your mobile is breeze with Auto S/L T/P running on the chart on your desktop. Just enter a trade and your default stop loss and take profit will be
FREE

The FVG MT4 Bot, or Fair Value Gap Trading strategy, is a method used in trading financial instruments, typically in the context of the MetaTrader 4 (MT4) platform. This strategy focuses on exploiting discrepancies between the current market price and its perceived fair value, usually identified through technical indicators and analysis. Here's a description of the Fair Value Gap Trading strategy: Timeframe (H1) : This strategy operates on the one-hour (H1) timeframe, meaning it analyzes price m
FREE

Fractal is one of the main indicators in a number of strategies. Volume Fractals has expanded the functionality of the standard indicator version. The product features fractals sorting and displaying fractals representing both price and volume extreme points.
Application Stop losses Reversal signals Placing pending orders for a fractal breakout
Options Bars of history - number of chart bars the indicator is displayed for Left side minimum bars - minimum number of bars to the left of the fracta
FREE

インジケーターは、任意の時間枠からの任意のシンボルの最小化されたチャートを表示します。表示されるチャートの最大数は28です。チャートはメインウィンドウと下部ウィンドウの両方に配置できます。 2つの表示モード:キャンドルとバー。表示されるデータ(バーとキャンドル)の量とチャートのサイズは調整可能です。 パラメーター: Corner-開始コーナーを表示します(リストから選択) CandleMode-表示モード:true-キャンドル、false-バー ShowLastBid-最終価格表示を有効/無効にします LastBidShiftX-X軸による最終価格ラインシフト(すべてのシフトはより正確な表示のために使用されます) LastBidShiftY-Y軸による最後の価格ラインシフト ColorLB-最終価格ラインの色 BarsToDisplay-現在のものなしで表示されたバー/キャンドルの量 LineColor-線の色(同事キャンドル) BullColor-強気のバー/キャンドルの色 BearColor-弱気のバー/キャンドルの色 ScaleColor-スケールカラー WindowNumber
FREE

Hello This EA (expert advisor) will open orders from Telegram "Auto Open orders from Telegram" (Telegram to MT4). Please watch our video for more details: https://www.youtube.com/watch?v=p06o1xgsD5c
download instructions from here https://drive.google.com/file/d/1rwZnvgaWoi3gSkEwsi7s5jeatjJLGTWc/view?usp=sharing
Good luck -------------------------------------------------------------- السلام عليكم هذا الاكسبيرت سيفتح صفقات آلية وفورية من تليجرام (Telegram إلى MT4) يرجى مشاهدة الفيديو لمزيد من ا

10 COPIES AT $ 99 ! After that, the price will be raised to $ 150 .
After years of painstaking research and development, we are offering the opportunity for you to have this incredible tool in your automated trading portfolio.
SHOGUN RX is a strategy that has a very advanced secret trading algorithm. It is a safe EA that trades using pending orders with a defined Stop Loss, Take Profit and 2 smart Trailing capabilities.
LIVE ACCOUNT ---> CLICK HERE Pair: USDJPY TimeFrame: H4. Minimum deposit
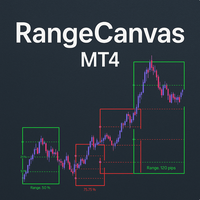
Daily Range Boxes : The indicator draws rectangular boxes around each day's high and low prices, creating a clear visual boundary for the daily trading range. Color-Coded Logic : Green boxes when the current price (or close) is above the daily open Red boxes when the current price is below the daily open Percentage Level Lines : Inside each box, it draws three horizontal lines at: 25% of the daily range 50% of the daily range (midpoint) 75% of the daily range Range Information : Each box displa
FREE

Gold Assassin is an automatic trading robot to trade XAUUSD . The algorithm includes a filter of behavioral factors, it analyzes the depth of market, and makes a decision about entering the trade based on the analyzer's filter data. Thus, the Expert Advisor finds optimal points to enter the market, filtering out false entries not supported by stable market behavioral patterns. This allows the Expert Advisor to achieve a large number of profitable trades. The algorithm does not use dangerou

This EA uses the following Built-in indicators: Channels indicator Supply and demand indicator Trend indicator It is based on multi-directional grid system, not the normal martingale you are familiar with. When the price is in supply or demand zones, the EA will wait for a confirmation before entering a position. The confirmation is through the three above indicators together. You don't need to purchase any of the indicators mentioned above if you don't want to see them on the live chart.

FOTSI is an indicator that analyzes the relative strength of currencies in major Forex pairs. It aims to anticipate corrections in currency pairs following strong trends by identifying potential entry signals through overbought and oversold target areas. Theoretical Logic of Construction: Calculation of Individual Currency Momentum: FOTSI starts by calculating the momentum for each currency pair that includes a specific currency, then aggregates by the currency of interest (EUR, USD, GBP, CHF,
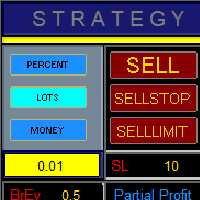
Market Order Management Utility and strategy Tester in one solution. The software is equipped with a simple and intuitive interface, with risk management in lots, but also in money or percentage. Management of the market position trough BE and split of the profit and monitoring of the profits in money and percentage. Also usable for MT4 BactTest system with 4 different speed.
FREE

Indicator designed for both beginners and professionals. RECOMMEHDATION Trade with this indicator for 2-3 weeks and you will feel significant progress in your trading. This indicator is developed based on the use of HMA, Laguerre, CCI . The indicator is clear and does not require any setting. Does not redraw and works by opening bar. It works on timeframes M1-D1. I use timeframe M5 to enter the market.
FREE
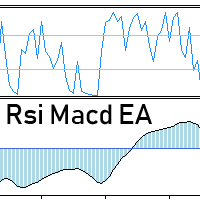
Rsi Macd Expert Advisor uses combined signal from 2 indicators (Rsi / Macd). Minimum trading account 500. best pairs: GBPCAD / EURUSD / CADJPY / USDCHF / GBPUSD / GBPJPY / USDJPY best timeframe: 1H Setting can be define by the user: rsi levels / rsi period / macd period / risk /
there are no stop loss or take profit and the expert closes orders by the indicator signal.
developed, tested and optimized on " VantageMarkets " platform. Recommended broker > Vantage
FREE
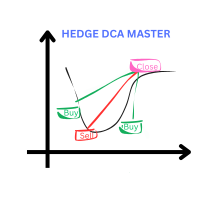
Wealth gained hastily will dwindle, but whoever gathers little by little will increase it.
This Expert is using DCA and Hedging Strategy. Live Account with startlot 0.04 : Hedge DCA Master HighRisk x4 Live Account with Middle Risk and recovery from loss other EA : https://www.mql5.com/en/signals/2289704 www.myfxbook. com/portfolio/hedge-dca-master/11230507 delete space before com
The Key point: Use my custom free indicator, you can download here and place it under folder mql4/Indicators Us
FREE

Virtual SL TP Trailing Pro for MT4 – Client-Side Stop Loss / Take Profit and Trade Management Looking for MetaTrader 5 version? I t is available separately in the Market: Virtual SL TP Trailing Pro MT5 Public channel: CLICK HERE
Virtual SL TP Trailing Pro for MT4 is a trade management utility that keeps Stop Loss (SL) and Take Profit (TP) levels on the client side instead of sending them to the trading server. It is designed to help you manage exits in a structured way using a clear on-cha

Moving Average Trend Alert is a triple MA indicator that helps traders to identify potential market trends based on 3 MAs alignment and crossover.
Moving Average Trend Alert features: Customizable short-term, medium-term, and long-term MAs. Option to filter signals based on a minimum distance between moving averages to avoid premature MAs alignment. Optional Filter of signals with RSI indicator overbought/oversold levels. Optional Filter of signals with ADX indicator. Popup, email, and phone no
FREE

Overview: Golden Buzzer is a two-in-one Expert Advisor (EA) designed specifically for trading XAUUSD (Gold) on the MetaTrader 4 platform. It executes trades using two complementary strategies , referred to as Strategy 1 and Strategy 2 . Both strategies are built on similar trading principles but differ in execution style, allowing for dynamic and diversified trading behavior. You can configure the EA to run Strategy 1 , Strategy 2 , or both simultaneously , giving traders full flexibility over
FREE

RoundNumbers indicator is a simple and powerful psychological price levels. Trader usually use these levels as a Support and Resistance (SnR). Indicator Input: Levels - Numbers of levels drawn on chart. Default 30 levels. BoxSize - Box size drawn on each levels, indicate buffers around levels. Default value 1pips (10point) above and below each levels. ZoneSize - Distance between each levels, default value 10pips (100point). Style & Colours - User inputs customization.
For MT5 version, please re
FREE

The Keltner Channel is a volatility-based technical indicator composed of three separate lines. The middle line is an exponential moving average (EMA) of the price. Additional lines are placed above and below the EMA. The upper band is typically set two times the Average True Range (ATR) above the EMA, and the lower band is typically set two times the ATR below the EMA. The bands expand and contract as volatility (measured by ATR) expands and contracts. Since most price action will be encompasse
FREE
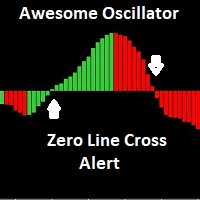
The Awesome Oscillator (AO) is an indicator used to measure market momentum. AO calculates the difference between a 34 Period and 5 Period Simple Moving Average. The Simple Moving Averages that are used are not calculated using closing price but rather each bar's midpoints. This indicator has email and pushup "mobile" features Alert, for any suggestions, please don't hesitate, thanks
FREE

[NEW RELEASE] Horse All in Signal – WinWiFi Robot Series ต้อนรับปีใหม่ 2026 ด้วยความมั่งคั่งและพลังที่คึกคักเหมือนม้าศึก! สัมผัสประสบการณ์การเทรดเหนือระดับกับอินดิเคเตอร์ตัวล่าสุดจาก WinWiFi Robot Series ในชื่อ "Horse All in Signal" เครื่องมือที่จะเปลี่ยนกราฟของคุณให้กลายเป็นสนามทำกำไร ด้วยระบบ AI อัจฉริยะที่สแกน Price Action ในทุกช่วงเวลา คุณสมบัติเด่น (Key Features): AI Price Action Engine: วิเคราะห์พฤติกรรมราคาแบบ Real-time แม่นยำทั้งในช่วงตลาดมีเทรนด์ (Trend) และช่วงพักตัว (Sideway)
FREE

GAP DETECTOR
FVG in trading refers to "Fair Value Gap", . It is a concept used in technical analysis to identify areas on a price chart where there is a discrepancy or gap between supply and demand. These gaps can occur due to rapid movements in price, usually as a result of important news or economic events, and are usually filled later as the market stabilizes. The GAP DETECTOR indicator is designed to identify fair value gaps (FVG) on the price chart and filter them using volatility to dete
FREE

Overview:
The Drawdown Control Limiter MT4 is a robust and efficient tool designed for traders who aim to monitor and limit drawdown levels in their MetaTrader4 Live/Demo accounts. This Expert Advisor provides real-time tracking of drawdown percentages or amounts and automatically closes positions if the specified limits are exceeded, helping protect your capital. EA account drawdown protector is designed for normal trading Live and Demo accounts (not for Prop Firms) . Key Features: Customizab

In the volatile world of financial markets, finding the best trading opportunities and minimizing risks is always a significant challenge for every investor. GoldCenta EA is a strategy that uses a stop-loss but carries some risk due to its use of martingale and grid techniques. It is best suited for Cent accounts. Use it only with money you can afford to risk. Test it with a backtest or on a demo account before going live, Enjoy it after understanding the incredible results. The key advantag
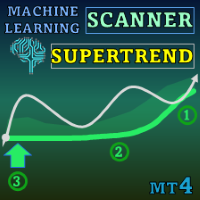
Special offer : ALL TOOLS , just $35 each! New tools will be $30 for the first week or the first 3 purchases ! Trading Tools Channel on MQL5 : Join my MQL5 channel to update the latest news from me Machine Learning Adaptive SuperTrend という先進的なインジケーターを使って、最新の機械学習の力を体験してください。このインジケーターは、変化する市場環境にシームレスに適応するように設計されています。k-meansクラスタリングをSuperTrendメソッドと組み合わせることで、精確なトレンドの識別とボラティリティの評価を実現し、トレーダーにダイナミックな市場での貴重な優位性を提供します。 MT5バージョンはこちら: Machine Learning Adaptive SuperTrend MT5 他の製品を見るには: 全製品 機械

パーシャルクローズアンドトレイル-アシスタントEA。ロールバック中にポジションの一部を閉じます(ロットの一部を閉じます)。 EAは、価格が最初に利益の方向に移動し、次に戻ってきたときに、部分的なクローズで収益性の高いポジションをクローズします。 完全な説明 +PDF 購入する方法
インストールする方法
ログファイルの取得方法 テストと最適化の方法 Expforex のすべての製品 EAは位置を監視します。 価格が利益の方向に移動する場合、eaは距離を置いてロールバック価格の最初のレベルを確立します。 価格が利益の方向に動き続ける場合、このレベルの利益はこのレベルのロールバックを変更し続けます。 価格が指定されたポイント数に戻ると、eaはポジションの一部をクローズします。 EAは、ポジションの次の部分がクローズされる次の価格レベルを設定します。 EAには、ポジションの一部がクローズされたときのストップロスのTrailingStopが含まれています。 EAは、ポジション全体がクローズされる限り機能し続けます。 ストラテジーテスターでエキスパートアドバイザーをテ
FREE

RSI / TDIアラートダッシュボードを使用すると、取引するすべての主要ペアでRSIを一度に(ユーザーが選択可能に)監視できます。
次の2つの方法で使用できます。
1.複数の時間枠を選択すると、通常の取引条件を超えて延長された複数の時間枠がある場合にダッシュが表示されます。複数の時間枠にわたって買われ過ぎまたは売られ過ぎのレベルを達成したため、価格が最近激しく押し上げられたため、引き戻しまたは逆転が間もなく行われることを示す優れた指標です。
2. 1つの時間枠(トレードするのが好き)と複数のRSIレベルを使用して、その時間枠でのRSIの延長の強さを示します。これは、価格が一方向に非常に長く押し込まれ、市場が利益を得ることになっている場合に、平均回帰取引を行うための優れた戦略です。スクリーンショットの例では、H4 RSIが25レベルを超えて2ペアで拡張されていることがわかります。これは、通常の価格アクションよりもはるかに遠いため、長く行く良い機会です。
ダッシュボードは、選択した時間枠でろうそくが閉じたときに、選択したレベルでの延長された状態(買われ過ぎと売られ過ぎ)を警告

外国為替トレーダーは、テクニカル分析における フィボナッチ 取引戦略の価値を理解しています。ただし、フィボナッチ レベルを手動で描画および調整するには時間がかかる場合があります。そこで、 Fibonacci Of Yesterday Ultimate インジケーターが登場します。これは、前日の価格変動に基づいてフィボナッチ戦略を使用するトレーダー向けに特別に設計されており、時間と労力を節約します。 この革新的なインジケーターは、フィボナッチレベルに基づいてエントリー、ストップロス、テイクプロフィットのレベルを自動的に識別します。また、好みに合わせて簡単にカスタマイズできる、使いやすいフィボナッチ ツールも含まれています。特徴的なのは、チャート上の実際のトレンド チャネルを識別する機能で、反転、リトレースメント、トレンドの機会を簡単に見つけることができます。 Fibonacci Of Yesterday Ultimate インジケーターの使用は簡単です。主要なニュースリリースを待ち、トレンドを判断し、それに応じてフィボナッチレベルを描画します。 50% と 38.2% のレベルの間で

Infi Trade:先進のオートメーションであなたのトレーディングを革新 自動トレーディングの力を解き放ちましょう: Infi Tradeは、Forex市場で効率と利益を求めるトレーダー向けに設計された最先端のエキスパートアドバイザー(EA)です。当社のEAは、取引機会を最大化するために複雑なグリッドヘッジ戦略を利用し、シームレスな自動取引体験を提供します。 インテリジェントなグリッドヘッジ戦略: Infi Tradeの核となるのは、私たちの革新的なグリッドヘッジ戦略です。このアプローチは、市場の変動を利用して様々な価格レベルでポジションのグリッドを作成し、トレードを賢く配置および管理します。EAは市場状況にダイナミックに適応し、リスクを最小限に抑えながら利益を確保することを目指します。 完全自動化でストレスフリーなトレーディング: Infi Tradeは完全に自動化されています。設定後、24時間365日市場を分析し、取引プロセスを引き継ぎます。これは、常に市場を監視する必要なく取引のメリットを楽しむことができることを意味し、他の重要な活動のための時間を解放します。 **ユーザーフレ

このユーティリティの仕事は、デポジットのドローダウンを防ぐために、すべての金融商品に関する他のアドバイザーの仕事を分析することです。指定されたパラメーターを超えた場合、「エクイティ・プロテクション」はポジションをロックし、クローズし、それに関する通知を送信できます。 「株式プロテクション 」は 現在のシンボルまたはすべてのシンボルに対して機能し、組み込み機能により保留中のポジションを削除したり、アカウントで作業している他のアドバイザーを閉じることもできます。 機会:
アカウントでアクションが開始されたときにあらゆる種類の通知を送信します。 アカウント上のすべての商品を操作するには、1 つのチャートにアップロードするだけで十分です。 選択したマジック ナンバーまたはすべて、現在のシンボルまたはすべてのシンボルを操作します。 ブロックしたり、損失をクローズしたり、単に損失について通知したりできます。 必要に応じて、すべてのシンボルまたは現在のシンボルで他のアドバイザを無効にします。 未決注文だけでなく、ストップロスやテイクプロフィットも削除できます。 カスタマイズ可能なパネル。パネル

Multicurrency and multitimeframe modification of the indicator Bollinger Bands. On the dashboard you can see breakouts and touches of the Bollinger Bands. In the parameters you can specify any desired currencies and timeframes. The indicator can also send notifications when the price touches the Bollinger Bands, when the current volatility changes (expands or falls), and when the price touches all the bands. By clicking on a cell with a period, this symbol and period will be opened. This is MTF
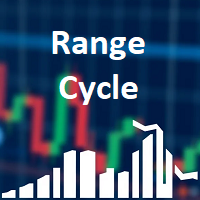
Range Cycle Indicator. Gives signal on price range cycling smoothed by moving average. It is better to use it on H1+ timeframes and avoid side markets. Because if market is flat this indicator will give too many zero profit or even losing signals. Parameters: PopUpAlert - to allow it to alert when trend changes; EMailAlert - for email alerts; period - this is a smoothing criteria, use higher values on lower timeframes; TimeFrame(new) - higher timeframe (or the same) to use for calculation, defa
FREE

Bitcoin Predictor は、価格の反転を予測するために設計された矢印ベースのインジケーターです。 このツールは、BTC やその他の暗号で使用できます。また、通貨にも使用できます。ただし、どのペアが最も効果的かを最初に確認する必要があります。一部のペアと時間枠は、非常にうまく機能します。ご自身で自由にテストして確認してください。 インジケーターは非常に使いやすいです。必要なのは矢印に従うことだけです。インジケーターは、スタンドアロン システムとして機能することも、既に使用しているシステムの一部として機能することもできます。 信号は再描画しないでください! 購入後ご連絡ください!私の取引の推奨事項とボーナスをあなたと共有します!

This automated DOJI BAR FINDER INDICATOR can be utilized to manage trades and identify potential areas of support and resistance for both buying and selling. It is designed to identify zones for Sell/Buy trades and can be effectively used in conjunction with other indicators, such as order block indicators, and more. Currently designed for MT4, it will later be adapted to function on MT5. We also offer the opportunity to customize the robot according to your trading strategy.
FREE

Pocioli X The Smart AI That Trades for You
Trade Smarter. Profit Faster. Relax More.
Say hello to Pocioli X, the next-generation AI trading robot designed to think, learn, and adapt just like a professional trader.
Unlike traditional robots that follow fixed rules, Pocioli X evolves with the market. It studies patterns, learns from every move, and adjusts its strategy automatically to keep you ahead whether you trade Forex, Crypto, Indices, or Commodities.
Why Traders Love Pocioli
IceFX VelocityMeter is a very unique indicator on MetaTrader 4 platform which measures the speed of the forex market. It's not a normal volume or other measurement indicator because IceFX VelocityMeter is capable to understand market speed movements which are hidden in ticks and those valuable information cannot be read in an ordinary way from the candles. The software monitors the received ticks (frequency, magnitude of change) within a specified time range, analyzes these info and defines, dis
FREE
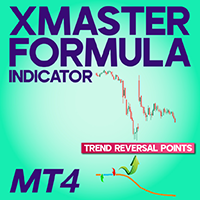
XMaster XHMaster Formula MT4 Indicator – No Repaint Strategy The XMaster / XHMaster Formula Indicator for MetaTrader 4 (MT4) is one of the most popular non-repaint tools used in Forex trading. According to sources like XS.com and TradingFinder, the indicator is designed to detect market direction, momentum strength, and potential reversal areas with high accuracy. This MT4 version blends multiple technical elements—such as EMA-based trend analysis, MACD momentum, RSI and Stochastic oscillators,
FREE

MT4用NAS100 Auto SL and TP Makerをご紹介します: MetaTrader4でナスダック100市場をナビゲートするトレーダーにとって不可欠なアシスタントであるNAS100オートSLおよびTPメーカーで、ストップロスおよびテイクプロフィットの設定をもう見逃すことはありません。このツールは、ストップロスとテイクプロフィットのレベル管理を自動化するシームレスなソリューションを求める方々のために設計されています。 主な特徴 簡単な自動化: ストップロスやテイクプロフィットのないナスダック100取引を自動的に監視します。 ユーザーが構成した設定に基づいてレベルを動的に調整します。 注文タイプの多様性: Nasdaq100の成行注文と未決済注文の両方に対応。 MetaTrader 4で利用可能な様々な注文タイプをサポートします。 カスタマイズされた設定: ユーザーフレンドリーなパラメータ設定により、トラッキング設定とストップロス/テイクプロフィットレベルのカスタマイズが可能です。 柔軟な範囲: 実行する特定のNAS100商品、または取引されるすべての商品に対してStop
FREE

This indicator is a multifunctional technical analysis tool based on the combination of an adaptive exponential moving average and volatility filters calculated through the Average True Range (ATR). It is designed to accurately identify the current price direction, highlight key trend reversal areas, and visualize potential turning zones. The algorithm is built upon the dynamic construction of a trend ribbon using two levels of volatility — outer and inner ranges. The outer boundaries serve as i

PositionClose|MT4 ポジション一括決済スクリプト PositionCloseは、MetaTrader 4(MT4)上で稼働するユーティリティスクリプトです。 全ての保有ポジションをワンクリックで一括決済 できるだけでなく、「買いポジションのみ」「売りポジションのみ」の選択的決済もサポートします。急激な相場変動や重要経済指標の発表時など、 迅速なリスク回避やポジション整理が必要な場面で特に活躍 します。裁量トレードだけでなく、自動売買(EA)運用時の緊急手動決済や、デモ環境でのトレード検証など幅広く利用できます。 主な機能と特長 ワンクリックで全ポジションを一括決済
保有しているすべてのポジションを瞬時に決済。複数通貨・複数ポジションでも対応可能です。 買い/売りポジションのみの個別決済
「買いだけ」「売りだけ」といった片側だけの一括決済も選択できます。ヘッジや戦略変更時にも便利です。 2段階確認ダイアログで誤操作防止
実行前に決済内容の確認メッセージを2回表示し、誤操作による意図しない全決済を防ぎます。 エラー発生時の詳細ログ出力
決済が失敗した場合は、原因やエ
FREE
MetaTraderマーケットは、他に類のない自動売買ロボットやテクニカル指標の販売場所です。
MQL5.community ユーザーメモを読んで、取引シグナルのコピー、フリーランサーによるカスタムアプリの開発、支払いシステムを経由した自動支払い、MQL5Cloud Networkなど、当社がトレーダーに対して提供するユニークなサービスについて詳しくご覧ください。
取引の機会を逃しています。
- 無料取引アプリ
- 8千を超えるシグナルをコピー
- 金融ニュースで金融マーケットを探索
新規登録
ログイン