 MetaTrader 5
 エキスパート
 インディケータ
 ライブラリ
ライブラリ
 ユーティリティ
 ウィジェット
 ルール
ルール
YouTubeにあるマーケットチュートリアルビデオをご覧ください
ロボットや指標を購入する
仮想ホスティングで
EAを実行
EAを実行
ロボットや指標を購入前にテストする
マーケットで収入を得る
販売のためにプロダクトをプレゼンテーションする方法
MetaTrader 4のためのエキスパートアドバイザーとインディケータ - 17
 自動売買ロボットは市場取引を自動的に実行しますが、インジケータを使用すると、相場をより適切に分析し、価格行動を予測できます。
これらのアプリケーションを使用すると、より多くの機会を獲得しながら、より多くの情報に基づいた方法でMetaTrader4で取引を実行できるようになります。
自動売買ロボットは市場取引を自動的に実行しますが、インジケータを使用すると、相場をより適切に分析し、価格行動を予測できます。
これらのアプリケーションを使用すると、より多くの機会を獲得しながら、より多くの情報に基づいた方法でMetaTrader4で取引を実行できるようになります。 
The arrow indicator for Forex and Binary options is based on tick volumes. Unlike many volume indicators, the "Super volumes" indicator calculates bullish and bearish volumes and gives signals based on the predominance of any of them. If, say, there was an advantage of bullish volumes in this range at the moment, then the signal will be on Buy. Or if the predominance was bearish volumes, then, accordingly, the signal will be on Sell.
In the indicator settings in the "volumes" variable, you can

Торговый робот предназначен для торговли криптовалютой по уровням Фибоначчи на рынке Форекс. Безопасность в торговле: постоянный стоплосс, тейкпрофит, защита от повышенного спреда, а лгоритм не использует опасные методы торговли - мартингейл, сетку и усреднение . Достоинством советника является торговля Мани Менеджмент (система управления капиталом) автоматический расчет лота на основе размера вашего депозита, автоматическая установка и перемещение уровней Фибоначчи. Установка отложенных ордеров
FREE

ドローダウンプロテクターは、希望する最大日次ドローダウンを管理するために使用されます。これはトレーダー、特にプロップファームのトレーダーにとって非常に価値のあるツールであるため、ドローダウン制限に注意する必要があります。 これは、株式ドローダウン管理の目的で簡単に使用できる効果的な EA です。 これは、変動株式(残高ではなく)が設定した日次損失制限を超えた場合に、新しい取引をブロックし、既存の取引を閉じることによって機能します。また、単一取引の最大損失制限を設定することもできます。これを超えると、次の暦日まで取引がブロックされます。
ユーザーは 3 つのパラメータの値を挿入します。 1 日あたりの損失限度額 (ドル単位): 名目通貨単位の最大損失額 (例として「$」を使用しています)。これは、 口座残高 の名目値で許容される最大ドローダウンです 。これを超えると、EA は翌日まで取引をブロックします。 $での取引ごとの損失制限: 名目通貨での最大損失(例として「$」を使用します)。これは、 単一取引 の名目値で許容される最大ドローダウンです 。これを超えると、EA は翌日まで

It identifies the pivot, support, and resistance price levels of the selected timeframe and then draws lines onto the chart. FEATURES: Option to specify the Timeframe Period in the PivotSR calculation. Option to display the PivotSR of the last candle, of every candle, or of the current candle. Options for displaying labels, line thickness, and line color. PivotSR can be interpreted as reversal levels or past price reactions that can be used as the basis for current price analysis. Some traders b
FREE

MetaTrader 4 用 Averager — プロフェッショナルな平均化とポジションシリーズ管理システム ドローダウンに入ったポジションを整理し、平均価格を改善しながら、ポジションシリーズ全体をひとつの戦略的な構造として管理するために設計された Expert Advisor です。 単なるナンピン補助ツールではなく、既存ポジションをより計画的に立て直し、損益分岐点や利益目標を現実的な位置へ引き寄せるための実用的な管理システムです。 Averager は独立した自動売買ロボットではありません。自動で新しいエントリーシグナルを探すのではなく、すでに保有しているポジションを監視し、平均化・追加エントリー・共通トレーリングストップによって、ポジション全体の管理精度を高めることを目的としています。 手動取引を行うトレーダー、自分自身のシグナルを使うトレーダー、あるいは他の売買ロジックと組み合わせて運用したいトレーダーに適した設計です。単発のポジションではなく、複数ポジションをひとつのシリーズとして扱いたい方に特に有効です。 MT5 のバージョン | 完全な説明 + DEMO + PDF
This expert advisor trades using the famous super trend indicator: it is completely loyal to the original algorithm and implements many other useful features for the exigent trader, like customizable trading sessions, multi-timeframe filters and many others. [ Installation Guide | Update Guide | Troubleshooting | FAQ | All Products ] Easy to use and supervise Fully configurable indicator settings Customizable break-even, stop-loss, take-profit and trailing-stop settings Works for ECN/Non-ECN br
FREE
コピー機->便利で高速なインターフェースインタラクション、ユーザーはすぐに使用できます ->>>> WindowsコンピュータまたはVPS Windowsでの使用を推奨 基本機能: コピートレードの通常のインタラクション速度は0.5秒未満です。 シグナルソースを自動的に検出し、シグナルソースアカウントのリストを表示します シンボルを自動的に一致させます。異なるプラットフォームでよく使用される取引シンボルの95%(異なるサフィックスなどの特別なケース)が自動的に一致し、基本的に手動設定は必要なく、シンボルマッピングテーブルをダブルクリックして対応するシンボルを変更できます。(マッピングテーブルにはクイック検索シンボル機能があります) 4つのロット計算モード(1. 乗数 2. 固定ロット 3. 適応リスク 4. シグナル 適応リスク ) 特別ロットモード: ストップロス資本リスクに基づいてロットサイズを計算できます (ストップロスが小さすぎる場合や、計算されたロットサイズが大きすぎる場合がありますので、注意して使用してください) 複数のプラットフォーム、複数の信号源(マスター)、複
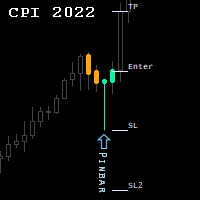
Candlestick Patterns Indicator.
NEW! FREE Candlestick Patterns Expert Advisor > https://www.mql5.com/en/market/product/105634?source=Site +Profile
The Indicator draws colored candlestick patterns, their description and future levels of Stop Loss / Take Profit. Combined with other market analysis, can greatly improve trading results. Indicator can be highly customized by the user including change of colors, fonts, levels, candle sizes etc...
developed, tested and optimized on " VantageMarke
FREE

このインジケーターはタートル システムに従って機能し、古典的に 20 ローソク足と 55 ローソク足の時間間隔を想定しています。傾向は、指定された時間間隔にわたって監視されます。エントリーはサポートまたはレジスタンスレベルを下抜けた瞬間に行われます。出口シグナルは、同じ時間間隔のトレンドの反対方向への価格ブレイクアウトです。 利点:
金融商品: 通貨ペア、株式、商品、指数、暗号通貨 タイムフレーム: 古典的には D1、あらゆるタイムフレームでの作業にも適しています 取引時間: 24時間 資金管理戦略: 取引あたりのリスクは 1% 以下 追加注文を使用する場合、追加ポジションごとのリスクは 0.25% MT5 indicator version -> HERE / More products -> HERE エントリールール: 1) 短いエントリー: エントリー条件は20日間の高値または安値をブレイクアウトすることです。
前のシグナルが成功した場合、取引はスキップされます。
注記!以前の取引が利益で終了した場合は、エントリをスキップします。ブレイクアウトが利益を生むことが
FREE

Interactive Structure Dashboard (SMC Engine) FREE TRIAL
IMPORTANT NOTE: SEND ME YOUR MT4 ACCOUNT NUMBER TO GET YOUR ACCESS KEY UNPON DOWNLOAD. The Interactive Structure Dashboard is an advanced, institutional-grade Market Structure and Smart Money Concepts (SMC) indicator designed to automate your top-down analysis. By tracking raw liquidity shifts and order flows in real-time, it strips away market noise to reveal true high-probability trading zones. Equipped with a live, multi-pair dash
FREE

VWAP クロスオーバーシグナルインジケーター for MetaTrader 4
VWAP クロスオーバーシグナルインジケーターで精密なトレードを解き放つ!
VWAP クロスオーバーシグナルインジケーターでトレード戦略を向上させましょう。このMetaTrader 4向けに設計された強力で直感的なツールは、精度と明確さを求めるトレーダー向けに作られています。このカスタムインジケーターは、出来高加重平均価格(VWAP)を活用し、チャート上に直接アクション可能な買いと売りのシグナルを提供します。デイトレーダー、スキャルパー、スイングトレーダーにとって理想的で、高確率のエントリーとエグジットポイントを簡単に特定できます。 主な機能: 動的VWAP計算:カスタマイズ可能な期間(デフォルト:14)に基づいてVWAPを計算し、出来高で加重された平均価格を正確に反映します。 明確な視覚的シグナル:価格がVWAPを上抜けすると緑色のアップアローが「買い」ラベルと共に表示され、下抜けすると赤色のダウンアローが「売り」ラベルと共に表示され、トレード判断が簡単になります。 高いカスタマイズ性:VWAP期
FREE
Deal Trading Trend オールインワン・プロフェッショナルトレンドシステム トレンドフォロー、動的サポート&レジスタンス、押し目・戻り目シグナル&アラート機能 Deal Trading Trend は、MetaTrader 4 向けに開発されたテクニカルインジケーターです。トレンド方向の分析、動的サポート&レジスタンスライン、そしてストキャスティクスによるモメンタムの押し目・戻り目シグナルを、構造化された見やすいチャートレイアウトに統合しています。
スキャルピング、デイトレード、スイングトレードに適しており、方向性を示すトレンドライン、シグナル矢印、動的なターゲット価格(TP1、TP2)、および確定したセットアップに対する計算済みストップロス価格を表示します。
主な特徴 リペイントなしのシグナル(Non-Repainting Signals): すべての計算およびシグナルはローソク足の確定時(Bar Close)にロックされます。ローソク足が確定した後は、インジケーターの数値が再描画・変化することはありません。
4-in-1 の分析構造: トレンド方向、動的サポー
MT5 Version
Advanced Daily Breakout
Advanced Daily Breakout allows you to trade session breakouts in an automatic way and with an accurate order and risk managing. This EA focuses on defining the session range and trading its breakout. You can let the trade run until the end of the session or keep a tight trailing stop loss (TSL) to catch as much as possible of breakouts' characteristic explosive price movements while protecting the trade if it turns out to be a fakeout. There are three main w

Crypto_Forex MT4用インジケーター「マイクロMパターンとマイクロWパターン」。リペイントなし、遅延なし。 - インジケーター「マイクロMパターンとマイクロWパターン」は、プライスアクショントレードに非常に強力なインジケーターです。 - インジケーターはチャート上のマイクロMパターンとマイクロWパターンを検出します。 - 強気のマイクロWパターン - チャート上に青い矢印シグナルを表示します(画像参照)。 - 弱気のマイクロMパターン - チャート上に赤い矢印シグナルを表示します(画像参照)。 - PCとモバイルの両方でアラート機能を搭載しています。 - インジケーター「マイクロMパターンとマイクロWパターン」は、サポートレベル/レジスタンスレベルとの組み合わせにも最適です。 - どの時間足でも使用できます。 - トレンドの転換や調整の終了を検知するのに最適なインジケーターです。 Click here to see high quality Trading Robots and Indicators! これは、このMQL5ウェブサイトでのみ提供されるオリジナル製品です。

本インジケーターは 累積出来高デルタ(CVD) ——各バーの出来高に、そのバーが終値でどちらに引けたかに応じた符号を付けて積み上げた累計——を、適応型の標準偏差バンドの中に描画します。価格だけでは分からないことに答えます。その値動きは参加によって支えられているのか、それとも漂っているだけなのか、という問いです。 累計は、お選びいただいた アンカー ——日次、週次、月次——で再び始まります。したがって表示される値は、チャート履歴の先頭ではなく、常に現在のセッション、週、月に対する相対値になります。この一つの設定こそが、同じインジケーターを為替の1分足チャートでも株価指数の日足チャートでも役立つものにしており、履歴がたまたま始まった地点から増え続けるだけの単純な累積出来高ラインとの違いでもあります。 計算の仕組み 各バーはその出来高を累計に寄与させます。前のバーの終値より高く引ければ加算、低く引ければ減算、同値であれば累計は変わりません。 次に、この累積系列に対して20期間の中心線とその標準偏差を計算し、上下のバンドを標準偏差の指定倍数の位置に置きます。バンドは系列自身のばらつきから構成さ
FREE

Trade Copier Professional — ローカルコピーソリューション
Trade Copier Professional は、MetaTrader 4/5 用の信頼性の高いローカル取引コピーシステムです。同一コンピュータ上の複数アカウント間でポジションを即座に複製でき、内蔵の安全管理機能とプロフェッショナルなダッシュボードを備えています。
概要 この EA は単一ファイルから Master モードと Slave モードの両方で動作し、シームレスに切り替え可能です。MT4 と MT5 の間でインターネットに依存せずに取引をコピーでき、ローカルファイル通信を利用することで最大限の速度と信頼性を実現します。リアルタイムダッシュボードには接続状態、コピー統計、日次パフォーマンスが表示されます。
ロットとリスク管理 4 種類のロット計算モードを提供します:固定ロット、乗数、リスク割合、残高割合。ストップロスやテイクプロフィットはスケーリングや調整が可能で、必要に応じてシグナルを反転させることもできます。安全機能には日次損失・取引制限、最小/最大ロット制御、
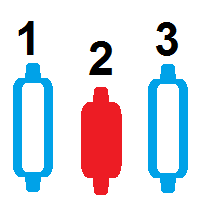
燭台カウンターインジケーター このインジケーターは、任意の時間枠のチャート上にあるキャンドルをカウントします mt4でダウンロードできる無料のバーカウンター ローソク足カウンターは、大きなチャート内にあるキャンドルの数をカウントします このローソク足カウンターを使用すると、自動ローソク足カウントを実行できます バーを自動的にダウンロードしてカウントするための無料のローソク足カウントインジケーター bar counter to count the bars count candle counter indicator mt4 count candle MT5のキャンドルカウンター この指標に興味がある場合は、コメントを残してください。改善を続けます
FREE

ADRアラートダッシュボードは、価格が通常の1日の平均範囲に関連して現在取引されている場所を一目で示します。価格が選択した平均範囲とレベルを超えると、ポップアップ、電子メール、またはプッシュを介して即座にアラートを受け取るため、プルバックと逆転にすばやくジャンプできます。ダッシュは空白のチャートに配置されるように設計されており、バックグラウンドに座ってレベルに達したときに警告を発するので、座って見たり、まったく見たりする必要はありません。 ここで利用可能なMT5バージョン:https:// www.mql5.com/en/market/product/66316
NEW:毎週と毎月の平均範囲とそれらへのアラートも表示されるようになりました!
ここでチャートのレベルを下げるADRリバースインジケーターを入手してください:https:// www.mql5.com/en/market/product/62757
通常の1日平均レンジ(ADR)内で価格が取引され、これらのレベルを上回っている時間の約60%は、通常、その後の引き戻し(利益確定)の動きを伴う急激な価格の動きの指標です。毎

Malaysian SNRは、マレーシアのトレーダーによって使用されているサポートおよびレジスタンスのシステムであり、スキャルパーやデイトレーダーが素早くレベルを見つけるための方法です。 このインジケーターの機能: サポート・レジスタンスの表示/非表示パネル ヒゲリジェクション(Wick Rejection)フィルターにより、検証されたSNRのみ表示 レベルの価格表示/非表示 チャートの表示範囲内でのみ動作し、ウィンドウサイズを調整してリアルタイム分析が可能 チャートの移動に応じて自動更新 Malaysian SNRは、マレーシアのトレーダーによって使用されているサポートおよびレジスタンスのシステムであり、スキャルパーやデイトレーダーが素早くレベルを見つけるための方法です。 このインジケーターの機能: サポート・レジスタンスの表示/非表示パネル ヒゲリジェクション(Wick Rejection)フィルターにより、検証されたSNRのみ表示 レベルの価格表示/非表示 チャートの表示範囲内でのみ動作し、ウィンドウサイズを調整してリアルタイム分析が可能 チャートの移動に応じて自動更新

TrendBite v1.5 - プロフェッショナルトレンド追跡インジケーター 開発者: 8aLt4 バージョン: 1.5 プラットフォーム: MetaTrader 4
概要 TrendBite v1.5 は、市場のトレンドの変化を検知し、投資家に明確な売買シグナルを提供するために設計された、高度なテクニカル分析インジケーターです。ボリンジャーバンドのアルゴリズムに基づいて、トレンドの転換を正確に捉えるこのツールは、初心者にも経験豊富なトレーダーにも最適です。
主な機能 トレンドの検知 自動トレンド分析:市場の上昇トレンドと下降トレンドを瞬時に検出 ボリンジャーバンドベース:信頼性の高い数学的モデルに基づく計算システム 視覚的な明瞭さ:緑(上昇)と黄色(下降)のヒストグラムバーでトレンド状況を明確に表示 売買シグナル 緑色の矢印(↑):買い機会を示します 赤色の矢印(↓):売り機会を示します 明確な視覚化:トレンドラインにより、ポジションの方向を簡単に追跡できます ヒストグラム表示:トレンドの強さを視覚的に評価可能 警告システム 音声警告:新しいシグナルが発生すると自動
FREE

Astra BB RSI Arrows — ボリンジャーバンドとRSIを使用した視覚的なトレードシグナルインジケーター Astra BB RSI Arrowsは、市場における潜在的なエントリーポイントと決済ポイントを、分かりやすく素早く見つけたいトレーダー向けに開発されたインジケーターです。 このインジケーターは、テクニカル分析で広く使用されている2つの手法、ボリンジャーバンド(Bollinger Bands)と相対力指数(RSI)を組み合わせています。 複数のウィンドウを切り替えながら、クロス、買われすぎ、売られすぎの状態を手動で監視する必要はありません。必要な情報が、視覚的なシグナルとしてチャート上に直接表示されます。 インジケーターは不要な要素でチャートを埋め尽くしません。ボリンジャーバンド、エントリー矢印、決済マーク、重要なタイミングを見逃さないための通知など、必要な情報だけを表示します。 Astra BB RSI Arrowsの基本的な考え方 価格が極端な領域に入り、その後通常の範囲へ戻り始めるとき、市場ではトレード機会が発生することがあります。このインジケーターは、そのよう
FREE

ATC Candle Timerは、現在のローソク足の残り時間と主要なシンボル情報を1つの小さなパネルに表示します。
このツールは、ポジションツール、トレード管理、パフォーマンス分析とともに、 All In One Trade Management Panel MT4 の一部でもあります。
ローソク足タイマー: チャートのタイムフレームまたは選択した任意のタイムフレーム(週足・月足を含む)のローソク足確定までのカウントダウン。
ローソク足がどれだけ経過したかを示すプログレスバー。
現在のローソク足の横に表示されるオプションのカウントダウンラベル。パネルのボタンでオン/オフを切り替え。
ローソク足確定の設定秒数前にオプションのアラート。 シンボル情報: ポイントとピップスでのスプレッド。
ピップスでの今日のレンジ。
選択した日数における平均日足レンジ(ADR)。今日のレンジをその割合として表示:75%未満は緑、75%からは琥珀色、100%からは赤。
ロングとショートのスワップ。
ブローカーのサーバー時間、およびオプションでお使いのコンピュータのローカル時間。 入力: カ
FREE
Binary Deal Trading Indicator is designed for MetaTrader 4 to assist traders in identifying potential market reversal and exhaustion zones, based on overbought and oversold conditions as well as fractal swing points.
The indicator provides visual reversal signals on the chart and can be applied to any timeframe, with M5 and M15 being the primary recommended charts.
Key Features
Designed for reversal and swing analysis on multiple timeframes.
Displays a preliminary warning alert one candle pr
FREE

THE BRAIN SMC ULTIMATE "Trade Like an Institution, Analyze Like a Professional" Are you tired of cluttered charts, lagging indicators, and conflicting signals? Welcome to the era of Clean Trading.
The Brain SMC Ultimate is engineered for traders who prioritize visual clarity without sacrificing data accuracy. Utilizing the latest Smart Money Concepts (SMC) algorithms, this indicator maps institutional footprints directly onto your MetaTrader 5 chart.
CORE PREMIUM FEATURES Smart Entry Guidan
FREE

The Supertrend indicator available on the MQL5 Market for MetaTrader 4 is an exceptional tool for traders seeking to identify prevailing trends in specific trading instruments. This indicator boasts two built-in indicators, Average True Range and Standard Deviation, allowing traders to choose the most suitable indicator based on their preferred trading strategy. Additionally, users can customize the period of these indicators and select the price (Close, High, Low, Open, Weighted) to which it s
FREE

マルチタイムフレーム・サプライ&デマンド・ヒストグラム
説明:
マルチタイムフレーム・サプライ&デマンド・ヒストグラムは、強力で見やすいインジケーターで、H4およびD1の複数時間軸における市場の需給の強さを表示します。買い手と売り手が優勢なタイミングをヒストグラムで視覚化することで、トレーダーは重要な市場圧力ゾーンを迅速に特定できます。 主な特徴: H4およびD1ヒストグラム: 上位時間軸での市場の強さを明確に表示。 ヒストグラム変化アラート: 需給の変化時に通知(オプション)。 チャートの最小限化: 重要なシグナルのみを表示。 カスタマイズ可能な表示: 時間軸ごとにヒストグラムの表示/非表示、アラートは任意。 15分足推奨: デイトレードや短期スイングの設定に最適。 Ultimate Scalpers Zoneインジケーターとの併用で最適: 複数の確認を伴うエントリーに有効。 メリット: 高確率のサポート・レジスタンスゾーンを素早く特定。 複数時間軸の市場モメンタムを一目で把握。 アクティブトレーダーに明確で精度の高い、実践的なインサイトを提供。
FREE
The Bollinger Scalper EA is a fully automated Expert Advisor that trades based on Bollinger Band and RSI entry signals. The EA trades using market orders and uses averaging to safely turn otherwise negative trades positive. This EA works best on EURUSD using the M5 timeframe. A VPS is advisable when trading this system. Check the comments for back test results and optimized settings. Please note: I have made the decision to give this EA away and many more for free with limited support so that I
FREE

### ADX and DI v1.00
TradingViewで43,000人以上のユーザーに利用されているBeikabuOyajiの「ADX and DI」インジケーターをMQL4/MQL5に忠実に移植したものです。+DI、−DI、ADXを一つのサブウィンドウに表示し、方向性指数にはワイルダーの平滑化、ADXラインには単純移動平均というハイブリッドな平滑化手法を使用しています。
#### 計算ロジック
ウエルズ・ワイルダーの方向性移動システムを実装していますが、ADXの最終計算に注目すべき違いがあります:
- **True Range、+DM、−DM** はワイルダーのオリジナル定義に従い、方向性移動の相互排他ルールを適用して計算 - **TR、+DM、−DMの平滑化** はワイルダーの累積和方式を使用:S(i) = S(i−1) − S(i−1)/N + 値 - **+DIと−DI** は平滑化された方向性移動と平滑化されたTrue Rangeの比率をパーセンテージで算出 - **DX** は+DIと−DIの正規化された差分を測定 - **ADX** は選択期間における
FREE

これは無料でご利用いただける製品です。お客様のニーズに合わせてご利用ください。
このインジケーターが気に入ったら、ぜひ短い肯定的なフィードバックを残してください!ありがとうございます!
高品質のトレーディングロボットとインジケーターをご覧になるにはここをクリックしてください!
Crypto_Forex MT4用インジケーター「 DeMarker with Alerts 」(リペイント機能なし) - DeMarkerオシレーターラインは、過去の高値と安値に対する現在の価格ポジションを示します。 - PCとモバイルの両方に、売られ過ぎ/買われ過ぎゾーンへのエントリーと、売られ過ぎ/買われ過ぎゾーンからの決済の両方に対応したアラート機能を搭載しています。 - アラート発動のトリガーレベルを調整可能。 - DeMarkerは、他のオシレーターの中でも最も効率的な定期的なダイバージェンスシグナルを提供します。 - 買われ過ぎゾーンとは、DeMarkerが0.7を超える場合、売られ過ぎゾーンとは0.3を下回る場合を指します。 - このインジケーターはどの時間枠でも使用できます。 - このイ
FREE

Smart Band Classic An adaptive multi-layer trading indicator combining dynamic price zones, intelligent BUY and SELL signals, and professional chart visualization in one streamlined MetaTrader 5 workspace. Smart Band Classic is a technical analysis indicator designed to help traders navigate market movements, recognize potential trading opportunities, and evaluate price behavior through a clean and coordinated visual environment. The indicator brings together an adaptive band system and a propri
FREE

VR Stealth Pro は、取引の利便性と効率性を向上させるために開発された専門の無料取引パネルです。このツールの主な目的は、ストップロスとテイクプロフィットのレベルを非表示にすることで、これらの取引レベルに関する情報の漏洩リスクを最小限に抑えることです。 セットファイル、製品のデモ版、説明書、特典が入手可能 [ブログ]
のバージョン [MetaTrader 5] VR Stealth Pro は無料の取引パネルであり、現状有姿で提供されます。 より多くの機能を利用するには、 VR Trade Panel 取引パネルをご利用ください。 パネルはシンプルで使いやすいインターフェースを備え、トレーダーの目の前に必要なすべてのツールに迅速にアクセスできます。実際のレベルを隠すために仮想化技術が使用され、それらをグラフィック要素(トレンドライン)で置き換えることで、ターミナルの作業スペース内で直接操作が可能です。 このプログラムでは、マウスを1回クリックするだけで、ポジションの開設、閉鎖、変更など、あらゆる取引操作を簡単かつ迅速に行うことができます。インターフェースは、トレーダーとター
FREE

Trading Viewで見かけたTMA - RSI DivergenceをMT4でも使えるように作成しました。 TMA RSI Divergence(TMA-RSIダイバージェンス)とは、 TMA( Triple Moving Average :三重加重移動平均) と RSI(Relative Strength Index:相対力指数) を組み合わせたテクニカル指標で、 価格とRSIの動きが逆行する「ダイバージェンス(逆行現象)」を検出する際に使われる手法です 。 通常RSI単体で見るのではなく、 RSIをTMAで平滑化(スムージング) し、 TMAライン自体をRSIの代わりに使う ことで、相場の転換点やトレンドの弱まりを、より明確に、そして長期的な視点で捉えることを目指します。 仕組みと特徴 RSIの平滑化 : 通常のRSIのノイズ(小さな値動き)を、TMAで平均化することで、トレンドの方向性や強い転換シグナルを際立たせます。 TMAをRSIの代わりに : TMA自体をオシレーター(買われすぎ・売られすぎを示す指標)として使い、価格とのダイバージェンスを見ることもあります。 5
FREE
** All Symbols x All Timeframes scan just by pressing scanner button ** After 18 years of experience in the markets and programming, Winner indicator is ready. I would like to share with you! *** Contact me to send you instruction and add you in "123 scanner group" for sharing or seeing experiences with other users. Big Update: 2026/10/15
Introduction The 123 Pattern Scanner indicator with a special enhanced algorithm is a very repetitive common pattern finder with a high success rate . Inter

磁気価格ファインダーインジケーターは、価格が回帰する傾向にある平均価格です。 XAUUSD H1向けに最適化されています。3本のラインがあり、中央のラインは焦点を当てるべき価格です。 過去のデータに基づくと、デフォルト設定での平均価格への回帰成功率は92%を超えました。その他のケースでは、デフォルトで設定されているストップロスが発動しました。 エントリーポイントとエントリー時間は、概ね一日の始まりであり、便宜上、新日最初のローソク足は、磁気ラインより下で開いたか上で開いたかに応じて矢印でマークされます。 このインジケーターは、日中の単一エントリーで回帰に重点を置く取引戦略や、グリッド戦略に適しています。 利用可能な設定: Candles:微調整のためのローソク足の数。12-24-48の値を使用するか、デフォルトのままにすることをお勧めします。 ATR設定:ご自身の戦略に合わせてストップロスを微調整するために必要です。 ShowLabels:ラインの右側にマーカーテキストを表示します。 LabelOffsetBars:テキストのオフセット。 ArrowOffset_Multiplier:
FREE

MarketSessions Indicator The Essential Tool for Global Market Session Visualization The MarketSessions indicator is a powerful MT4 tool designed to help traders visualize major forex market sessions directly on their charts. By clearly displaying the active trading hours of Sydney, Tokyo, London, and New York markets, this indicator helps you identify optimal trading periods and understand market volatility patterns. Key Features: Clear visualization of all four major trading sessions (Sydney, T
FREE

The ZUP is based on two ideas. Idea 1 - combine a variety of methods for identifying extremums (minimums and maximums) on the market price charts in a single indicator. Idea 2 - make it possible to easily bind various graphical tools, which allow to analyze the market behavior, to the identified extremums. To implement the first idea , the following has been made in the indicator. Included multiple ZigZag algorithms. Standard ZIGZAG algorithm. The basis of this algorithm is taken from the ZigZag
FREE
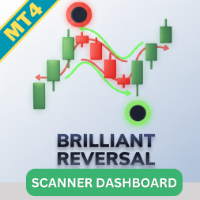
Brilliant Reversals MultiCurrency Scanner MT4は、複数の通貨ペアにおける潜在的な反転ポイントを特定しようとするトレーダーのために設計された最先端のトレーディングインジケーターです。高度なアルゴリズムを活用することで、このツールは瞬時に洞察を提供し、初心者と経験豊富なトレーダーの両方にとって、トレーディング戦略を最適化するために不可欠なものとなります。 このインジケーターは、市場の状況に基づいてリアルタイムの売買シグナルを提供することで、トレーダーの意思決定を強化し、取引パフォーマンスを向上させます。包括的なダッシュボードとアラート機能を備えており、主要な通貨ペアを簡単に監視し、市場の機会に迅速に対応できます。 MQL製品のインストールガイド | MT4/MT5で購入したMQL製品の更新 | 一般的なトラブルシューティングガイド | インジケーター設定 / ガイド 主な機能 バッファ統合: インジケーターの値をアクセス可能なバッファとして公開し、Expert Advisorがシグナルベースのトレーディングを効果的に活用できるようにします。 視覚

ハーモニックパターンは市場の転換点を予測するのに最適です。これらのパターンは高い勝率と1日の中での多くの取引機会を提供します。当社のインジケーターは、ハーモニックトレーディングの原則に基づいて、市場反転ポイントを予測する最も一般的なハーモニックパターンを特定します。 重要な注意事項: インジケーターは再描画されず、遅れることはありません(パターンはDポイントで検出されます);再描画されることはありません(パターンは有効またはキャンセルされます)。 使用方法: インジケーターをMT5チャートにドラッグアンドドロップします。 パターン検出をTRUE(ABCD;Gartley)に設定します。 任意のデバイスを設定します(高いデバイス=より多くのパターン;低いデバイス=より少ないパターン)。 好みに合わせて色を調整します。 バルブ/エントリーポイント、TP、SLの警告を有効または無効にします。 パターンが検出された場合: アルゴリズムはDポイントでパターンを検出します。 警告が有効になっている場合、パターン検出を通知します。 パターンが無効になった場合、「パターンがキャンセルされました」という
FREE
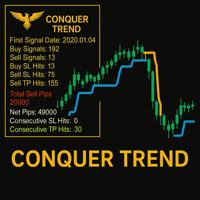
Conquer Trend – Master the Trend Like Never Before! Conquer Trend is your ultimate solution for dominating the markets with precision and simplicity. Built for traders who want to ride the strongest trends across any pair and any time frame, this powerful indicator brings together trend detection, retest confirmation, and performance tracking — all in one streamlined tool.
free expert Group: https://www.mql5.com/en/messages/01d5acd1bb56dd01/edit
Multi-Timeframe Trend Analysis Get a clear view
FREE
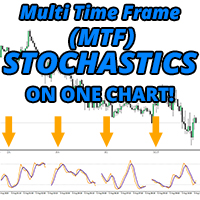
やっと! 1つのチャートに複数の時間枠を示すMT4の確率的インジケーター! 4つの別々の時間枠でメインラインとシグナルラインの実際の位置を即座に確認して、知識に基づいたトレーディングの意思決定を支援します。
インジケーターが複数の時間枠で何を示しているかを視覚的に確認する必要があるトレーダー向けの真のMTF確率的インジケーター。 他の確率論が配置されている場所を確認するために時間枠間をフリックする必要はもうありません!あなたの好きな時間枠に留まり、それらすべての概要を入手してください!
他の確率的インジケーターの上向き矢印または下向き矢印がメインまたは信号線なのか、それとも実際にどのような角度を指しているのか疑問に思わないでください!
伸びたり不正確だったりして貴重なチャートスペースを占有するため、正しく見えないMTF確率論はもうありません。
あなたの取引表からのすべての時間枠でクロスが発生したかどうかを確認してください!
特徴
M1から月次まで、ご希望の期間(合計4つまで)を選択してください 並んで表示されたそれぞれの確率の最新部分を表示します MT4に付属する在庫イン
FREE

Pulse Echo インジケーターは、MetaTrader 4 向けの 非リペイント型・ボラティリティ適応型 トレンドエンベロープです。固定期間の移動平均 1 本に頼るのではなく、短期実現ボラティリティと長期実現ボラティリティの比率に基づいて、短期 EMA(デフォルト 7)と長期 EMA(デフォルト 34)のウェイトを継続的にリバランスし、単一の「トレンドスパイン(脊柱)」を生成します。スパインは静かな相場では価格に密着し、ボラティリティが高まる局面ではノイズを抑えるようにフラット化します。スパインと現在のシグマに比例してサイズが決まる EWMA 分散バンドが強気/弱気ブレイクアウトを定義し、3 状態レジームマシン(強気 / 弱気 / 中立)が、可視トレンド色・着色ローソク足・各確定転換ごとの Buy/Sell ラベルを制御します。
MT5 版はこちら: Pulse Echo MT5 その他の製品はこちら: すべての商 品 リアル口座での使用例や新ツールをチェックしたい方は、プロフィールを訪問してフレンドリクエストを送り、最新アップデートを見逃さないようにしてください。 動作
FREE

DrawDown Limiter v5.0 — Advanced Account Protection Controller DrawDown Limiter v5.0 is a client-side account protection controller designed to supervise your trading account and automatically react when configured risk, profit, news, schedule, rollover, or position limits are reached. It can monitor manual trades, automated strategies, multiple Expert Advisors, pending orders and floating positions from one dedicated chart. It can protect the complete account or be configured to supervise a spe

Binary Options Support Resistance Indicator This indicator is designed for binary options trading and effectively shows retracements from support and resistance levels. Signals appear on the current candle. A red arrow pointing downwards indicates a potential selling opportunity, while a blue arrow pointing upwards suggests buying opportunities. All that needs adjustment is the color of the signal arrows. It is recommended to use it on the M1-M5 timeframes as signals are frequent on these timef

Zakirulbd Candle Timer V7 Professional trader utilities. Minimal design. Maximum clarity.
Zakirulbd Candle Timer V7 is a professional MT5 indicator designed to display the remaining time of the current candle directly on your chart in a clean, distraction-free format. One of the most common frustrations among traders is not knowing exactly how much time remains before a candle closes. Many traders moving from other platforms actively look for a reliable candle countdown timer before fully ado
FREE
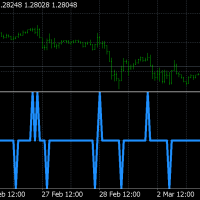
Pulse Scalping Line - an indicator for identifying potential pivot points. Based on this indicator, you can build an effective Martingale system. According to our statistics, the indicator gives a maximum of 4 erroneous pivot points in a series. On average, these are 2 pivot points. That is, the indicator shows a reversal, it is erroneous. This means that the second signal of the indicator will be highly accurate. Based on this information, you can build a trading system based on the Martingale
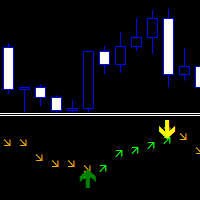
Direction Change Detector - 強気の動きと弱気の動きのバランスを分離するトレンドインジケーター。方向を確認する信号が付いた 2 列の矢印があります。
トレンドを見つけるためのスタンドアロンインジケーターとして、または取引を開始してシグナルの方向に従うための追加ツールとして機能します。
あらゆる市場と時間枠に適応します。 歴史に彼の証言を塗り替えることはない。 通知にはいくつかの種類があります。 上向きの緑の矢印は、価格が強気の方向であることを示します。 下向きのオレンジ色の矢印は、価格が弱気な方向であることを示しています。 読み取り値を変更するためのカスタマイズ可能なパラメータが 1 つあります。方向の数が増えると、価格はよりスムーズになり(低いタイム フレームに使用)、方向の数が減ると、価格はより早くなります(高いタイム フレームに使用)。
Length Directions - 方向の変化を計算するためのローソク足の数。
FREE

Renko charts. This is not timeframe based indicator. Works with close prices. External parameters: BrickSize - each brick size, 10 by default. PriceColor - Bid line color, white by default. UpColor - up brick color, LimeGreen by default. DnColor - down brick color, Crimson by default. BarsCount - bars amount to work with (0 by default - for all available). Alerts - alerts on trend change (true/false), false by default.
FREE

Williams Precision Prime – Precision Meets Legend Williams Precision Prime is a high-performance trend-following indicator that bridges the gap between Larry Williams' time-tested logic and modern algorithmic filtering, all wrapped in the exclusive Peak Precision design. Engineered for traders who demand clarity, stability, and mathematically sound entries, this system utilizes a triple-layer EMA strategy (100, 50, and 21) to identify high-probability "Cross-Momentum" setups within a confirmed d
FREE

QCL Adaptive Band Oscillator — MetaTrader 4 A smooth 0–100 oscillator with adaptive reference bands for a clearer view of price momentum. QCL Adaptive Band Oscillator combines smoothed price calculations with dynamic upper and lower bands. Displayed in a separate indicator window, it helps you examine momentum swings, potential turning points, and divergences between price and the oscillator. A smooth transformation keeps the oscillator and both bands within the 0–100 range , with a center refer
FREE

Vault Depth Indicator は、MetaTrader 4 向けの 非リペイント 型トレンドツールであり、3 つの測定可能なコンセプトを軸に構成されています。すなわち、パルスエンジンによるバーごとの「確信度」トラッキング、平均絶対偏差(Mean Absolute Deviation)を用いたボラティリティ適応型バンド、そして飽和ピーク崩壊を利用した構造レベル(重要価格帯)の検出です。各バーで買い手・売り手の関与度を追跡し、確信度が最も強くなった価格帯に自動でゾーンを設置し、価格がクールダウン条件を満たしたうえでそのゾーンを再テストしたときにシグナルを発します。トレンド反転矢印は、バンドの確定クロスが起きたタイミングで決定論的に表示されます。シグナルロジックは任意の平滑化表示ラインではなく「生の」バンド値を使用するため、再読み込みや時間足変更後でもシグナル位置は再現可能です。 MT5 版はこちら: Vault Depth MT5 その他の製品はこちら: 全プロダクト リアルタイムの使用例や新ツールについては、プロフィールを訪問してフレンド申請をお送りください。最新情報
FREE

Risk manager
Risk manager - it will simplify the tracking of drawdown and will notify you (alert) when the specified risk is reached, and close/lock orders when the critical DD risk level is reached.
If the specified drawdown is exceeded, you can choose two options for actions: All orders will be closed that mean loss will be fixed on depo. The terminal also closes. Instead of fixing the loss on depo, the opposite order will be opened - orders locking will occure. Not a single order will be c

Channel Scalper Pro インジケーターは、価格チャネルとシグナル矢印に基づく高度な市場分析ツールです。このインジケーターは MetaTrader 4 (MT4) プラットフォーム用に設計されています。チャネルと視覚的なシグナルの組み合わせを使用して、市場でのエントリーポイントとエグジットポイントを非常に正確に提供します。以下に、インジケーターの詳細な説明、その機能、および使用戦略を示します。 技術的な説明 チャネル: インジケーターが表示するチャネルは、価格範囲の上限と下限を示します。これらの限界は、トレーダーがサポートレベルとレジスタンスレベルを特定するのに役立ちます。 チャネルの上限は青色で示され、価格が通常上回らないレジスタンスレベルを表します。 チャネルの下限は赤色で示され、価格が通常下回らないサポートレベルを表します。 シグナル矢印: インジケーターには、市場への潜在的なエントリーポイントを示すシグナル矢印も含まれています。 下向きの赤い矢印は売り(ショートポジション)の可能性を示し、価格がチャネルの上限に達しており、下方への反転が予想されることを示します。
FREE

Automatic fibonacci with alerts is an indicator that automatically plots a fibonacci retracement based on the number of bars you select on the BarsToScan setting in the indicator. The fibonacci is automatically updated in real time as new highest and lowest values appear amongst the selected bars. You can select which level values to be displayed in the indicator settings. You can also select the color of the levels thus enabling the trader to be able to attach the indicator several times with d
FREE

Wonder 8 は Wonder コレクションの一つで、私自身のポートフォリオから選んだ戦略です。 H1 時間足で USDJPY を取引し、適応型ボラティリティフィルターを備えたトレンド消耗モデルを用います。 何であり、何でないか すべての取引は固定のストップロスとテイクプロフィットで開きます。リスクは常に明確です。 グリッドなし、マーチンゲールなし、ナンピンなし。同時に一つのポジション、低い証拠金使用。 ニューラルネットなし、AIなし、量子という言葉なし。ルールベースで、検証済みかつ誠実なシステムです。 最適化するものはありません。デフォルト設定が検証済みの設定です。 構築方法 単一チャートへのカーブフィッティングではなく体系的な手順:遺伝的生成、構築に使っていないデータでの検証、他市場での確認、スプレッドストレス、モンテカルロ。2026年に最新データで再確認しました。 バックテスト(固定0.01ロット、モデリング品質99%) 2020-2026:149 取引、プロフィットファクター 1.74、リターン/ドローダウン 7.4 直近24か月:37 取引、プロフィットファクター 1.1
FREE

Индикатор строит блоки заказов (БЗ) по торговой системе (ТС) Романа. Поиск блоков осуществляется одновременно на двух таймфремах: текущем и старшем (определяемым в настройках). Для оптимизации и игнорирования устаревших блоков в настройках задается ограничение количества дней в пределах которых осуществляется поиск блоков. Блоки строятся по правилам ТС состоящем из трех шагов: какую свечу вынесли (что?); какой свечой вынесли (чем?); правило отрисовки (как?).
FREE
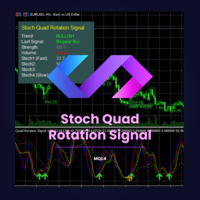
Stoch Quad Rotation Signal (MQL4)は、MetaTrader 4向けの高度なテクニカルインジケーターで、複数のストキャスティックオシレーターと強力なトレンドフィルター、ボリュームフィルター、パターンフィルターを統合し、スコアリングシステムやマルチタイムフレーム分析も備えています。高確率のトレード機会を明確かつ正確に特定することを目的として設計されています。 主要機能: 四重ストキャスティック分析: ストキャスティックオシレーターの異なる4つの設定(カスタマイズ可能なK、D、スムージング期間)を同時に使用し、オーバー売買状況の詳細な多感度な視点を提供します。これにより、市場のさまざまな「スピード」での動きを捉えることができます。 スマートトレンドフィルター: ファスト、ミディアム、スロウの指数移動平均線(EMA)に基づく堅牢なシステムを採用しています。主なトレンドに対して逆方向の信号をフィルタリングしたり、EMAの傾きを確認したり、価格が重要なEMAとの位置関係を検証することができます。 多様なトレード信号: 次のようなさまざまなタイプの信号を生成します:

Perfect for one minutes high trading and scalping. This indicator is very effective for trading on one minutes, in the hour. A combination of moving averages and STOCHASTICS calculation to produce a very convincing signal every hour. Blue colour signals a buy opportunity. Follow the X signs for possible buy points. The Blue average line serves as possible trend direction and support. Red colour signals a sell opportunity. Follow the X signs for possible sell points. The Red average line serves a
FREE

SMT (Smart Money Technique) Divergence refers to the price divergence between correlated assets or their relationship to inversely correlated assets. By analyzing SMT Divergence, traders can gain insights into the market's institutional structure and identify whether smart money is accumulating or distributing assets. Every price fluctuation should be confirmed by market symmetry, and any price asymmetry indicates an SMT Divergence, suggesting a potential trend reversal. MT5 Version - https:/

Alpha Trend signは私たちの取引システムを検証し、取引信号を明確に提示し、信号がドリフトすることはありません。
主な機能:
•市場が活況を示している地域に応じて、指標に基づいて現在の相場がトレンド相場に属しているか、それとも揺れ相場に属しているかを直感的に判断することができる。
そして、指標の指示矢印に基づいて市場に切り込み、緑の矢印は購入を提示し、赤の矢印は販売を提示する。
•小周期変動による頻繁な取引信号の発生を回避するために、5分以上の時間周期で取引を行うことを推奨します。
•最適な取引タイミングを逃さないために、シグナルプロンプトをオンにすることもできます。
•本指標はトレンド相場をよく予測するだけでなく、幅広振動相場でも利益を得ることができる。
•本指標は大道至簡の原則に基づいており、異なる段階のトレーダーが使用するのに適している。
注意事項:
•Alpha Trend signには明確な入退場信号があり、損失を与えないように逆位相操作を提案しない。
•Alpha Trend signは特に成熟した指標であり、デルのチー

The popular "SuperTrend" indicator is a technical analysis tool designed to help identify trend direction and potential entry or exit points in financial markets. This indicator is built upon the Average True Range (ATR) , which gauges market volatility based on price ranges. It is available for free on other platforms, and this should be no exception! Common Use Cases The SuperTrend is typically utilized in three primary ways: Trend Identification: When the price is trading above the indicator
FREE

What is the FVG Scalper EA?
I would suggest this bot is best for people who have a good understanding of a certain market and how the FVG and retracements work in that said market. Anyone who can share profitable .set files with me, i'd be happy to collaborate with.
Let's be totally honest for one moment. Many of the products on MQL5 are very slippery promising crazy returns, sharing the most amazing backtests you have ever seen and so forth. But, they typically either overcomplicate how the
FREE

G2 SIGNAL INDICATOR by Ida Bagus Putu Mahardika STRATEGY DESCRIPTION The EA G2 Signal Indicator is an advanced multi-timeframe system that combines 3 layers of analysis to generate high-quality entry signals with exceptional accuracy. Developed with a professional approach, this indicator is designed for traders seeking a competitive edge in the forex market. STRATEGY ADVANTAGES 1. 3-LAYER MULTI-TIMEFRAME SYSTEM Layer 1 (M15): Market Structure Filtering identifies the primary trend using
FREE

ウォーターマーク MT4 バージョン: https://www.mql5.com/ja/market/product/120783 MT5 バージョン: https://www.mql5.com/ja/market/product/120784
ロゴ MT4 バージョン: https://www.mql5.com/ja/market/product/121289 MT5 バージョン: https://www.mql5.com/ja/market/product/121290
「ウォーターマーク」スクリプトは、チャートの背景に重要な情報を直接表示することで、取引チャートをより魅力的に見せるように設計されています。このスクリプトは、現在の取引ペア、時間枠、各種時間指標などの重要な情報を、明確かつ目立たないように把握できる方法を提供します。
機能:
取引ペア表示:
このスクリプトは、チャートに表示されている現在の取引ペア(例: EUR/USD、BTC/USD)を自動的に検出し、表示します。これにより、トレーダーは常にどの資産を分析しているかを把握でき、間違ったペアに基づいて意思決
FREE

Trendline EA MT4 Trendline EA MT4は、ユーザーが描いたトレンドラインに基づいて取引操作またはアラートを実行するために設計された、MetaTrader 4用のセミ自動型エキスパートアドバイザー(Expert Advisor)です。 MetaTrader 4には、トレンドラインから直接取引を発注したり管理したりするネイティブ機能はありません。本EAは、ユーザーが定義したトレンドラインを監視し、価格がそれらと相互作用した際に事前に定義されたアクションを実行することで、標準的なプラットフォーム機能を拡張します。 本EAは取引戦略を定義したり適用したりしません。すべての取引ロジックと意思決定は完全にユーザーの管理下にあります。 追加資料 ユーザーガイドおよびドキュメント MT5版 機能概要 トレンドラインに基づく取引実行 価格がトレンドラインにタッチ、ブレイク、またはプルバックした際に買いまたは売りを実行 各トレンドラインごとにストップロス、テイクプロフィット、取引数量を設定 ローソク足の終値またはトレンドラインからの価格距離に基づいてアクションをトリガー 監視と

SimpleGridBot – transparent grid trading with separate Buy/Sell control, basket exit and RSI logic A grid EA you can fully understand and control. No black box: you set the distances, lot sizes and exits, and the EA does exactly that. No hidden logic. What sets it apart Separate Buy and Sell settings: distance, start lot and take profit are set independently for each side. Basket take profit with auto-restart: when the current grid run reaches your profit target, everything is closed and a fresh

Enhanced TP/SL MT4
Short description
Shows the Take Profit and Stop Loss levels of open positions on the chart, with the distance in pips, the value in account currency, the percentage of account balance and the risk to reward ratio.
Full description
The Enhanced TP/SL indicator draws the entry price, Take Profit and Stop Loss levels of each open position on the chart. Next to the Take Profit and Stop Loss lines, the indicator can show: the distance from the open price in pips, the value i
FREE
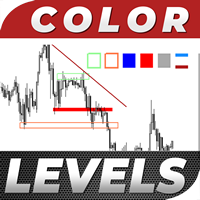
Color Levels is a convenient tool for traders using a Trendline and a Rectangle in their technical analysis. It allows setting two empty rectangles, three filled ones, and two tredlines. The indicator parameters are very simple and divided into numbered blocks: The ones beginning with 1 and 2 - empty rectangle (frame) parameters; 3, 4, and 5 - filled rectangle parameters; 6 and 7 - trendline parameters. Simply click a desired object and it will appear in the upper left corner. Main Adjustable Pa
FREE

BlueDigitsFx公式エコシステムへのアクセス インフラ更新情報、トレーディングリソース、製品リリース情報、およびBlueDigitsFx公式エコシステムへのアクセスを取得できます。 Telegramエコシステム
ウェブサイト
MT5版
BlueDigitsFx OBV Divergence MT4 — 市場反転を特定するための出来高ダイバージェンスインジケーター BlueDigitsFx OBV Divergenceは、価格変動とOn-Balance Volume(OBV)との間に発生する強気および弱気ダイバージェンスを検出するために設計されたMT4インジケーターです。 価格の動きと出来高の挙動を比較することで、このインジケーターはトレンドの失速、反転局面、モメンタムの変化を特定するのに役立ちます。 ダイバージェンスパターンはチャート上に直接表示されるため、出来高ベースの追加確認とともに市場構造を分析することができます。
主な機能 自動ダイバージェンス検出 — 強気・弱気のOBVダイバージェンスを自動的に検出します。 出来高と価格の比較 — 価格変動とOn-Balan

Pinpoint は、 xauusd の正確な売買シグナルのために設計された、再描画せずに遅延することなく、非常に効率的な取引指標です。 この指標は、急速に変化する市場で、リアルタイムで、迅速かつ正確かつ視覚的なソリューションを必要とするトレーダーのために設計されています。 この指標は既製の取引戦略として機能します。 これは、組み込みのアルゴリズムに従って資産の価格の動作を分析し、理想的なエントリポイントを決定するだけでなく、利益をロックする場所を示しています。
潜在的な変化をより正確に識別するために、指標には、現在の市場の状況に応じて動的に調整するインテリジェントなトレンドラインツールが組み込まれています。 標準的なライン設定に従って: 緑-イニシアチブを購入します。 赤は販売イニシアチブです。 オレンジ-以前のイニシアチブを傍受することは可能です。
Pinpoint mt5
Pinpoint Blog
Pinpoint にはさまざまなフィルタが含まれており、誤った信号を減らし、入力の品質を向上させるのに役立ちます。 デフォルトの設定は、 TF m15、m30、および1時間の

Harvest FX USES THE TREND WAVE INDICATOR AND IT CAN IDENTIFY THE BEGINNING AND THE END OF A NEW WAVE TREND MOVEMENT.
AS AN OSCILLATOR, THE INDICATOR IDENTIFIES THE OVERBOUGHT AND OVERSOLD ZONES.
IT WORKS GREAT TO CATCH THE SHORT TERM PRICE REVERSALS AND USES A MARTINGALE STRATEGY TO CLOSE ALL TRADES IN PROFIT.
USE DEFAULT SETTINGS ON H1 OR HIGHER TIME FRAME ON ANY PAIR FOR MORE ACCURATE TRADES
WHY THIS EA :
Smart entries calculated by 3 great strategies The EA can be run on even a $30000 a
FREE
MetaTraderプラットフォームのためのアプリのストアであるMetaTraderアプリストアで自動売買ロボットを購入する方法をご覧ください。
MQL5.community支払いシステムでは、PayPalや銀行カードおよび人気の支払いシステムを通してトランザクションをすることができます。ご満足いただけるように購入前に自動売買ロボットをテストすることを強くお勧めします。

取引の機会を逃しています。
- 無料取引アプリ
- 8千を超えるシグナルをコピー
- 金融ニュースで金融マーケットを探索