私たちのファンページに参加してください
- ビュー:
- 88613
- 評価:
- パブリッシュ済み:
- アップデート済み:
-
このコードに基づいたロボットまたはインジケーターが必要なら、フリーランスでご注文ください フリーランスに移動
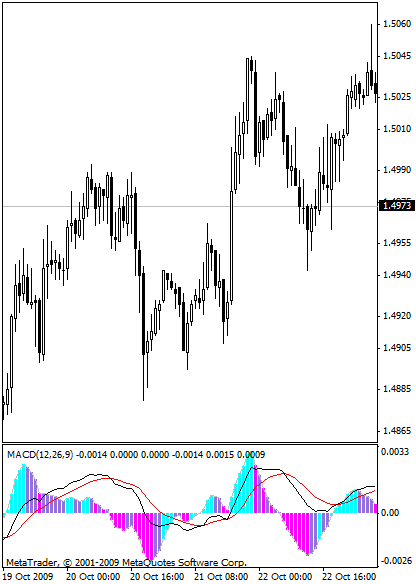
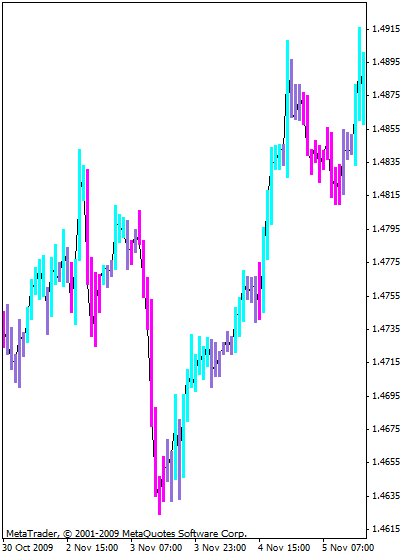
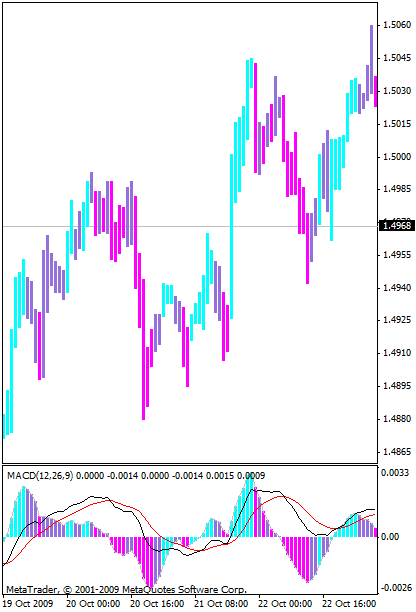
Classical MACD lines with filled OSMA on the chart.
Slow MA is calculated using ЕМА.
Histogram can be scaled by changing parameter OsmaX.
Draw buffer ordering has changed, so MACD line draws above.
OSMA indicator has added to chart.
Images:


MetaQuotes Ltdによってロシア語から翻訳されました。
元のコード: https://www.mql5.com/ru/code/9318
 Candlestick models for GBP/JPY for 9 years
An Expert Advisor uses the Candlestick Models for trading: Blending Candlesticks (Engulfing) and Hammer(inverted Hammer)/Shooting Star models
 Informer
Indicator shows entry and exit points for all deals and account statistics on the chart. It is very useful for trade analysis.
 LineMA
Indicator shows color lines between two MA crosses
 StatementToGraph
Graphic displaying of the statement, carring of a data from the *.htm table to the graph, for the convenience of analysis.