私たちのファンページに参加してください
- ビュー:
- 55392
- 評価:
- パブリッシュ済み:
- アップデート済み:
-
 取引の機会を逃しています。
- 無料取引アプリ
- 8千を超えるシグナルをコピー
- 金融ニュースで金融マーケットを探索
-
 このコードに基づいたロボットまたはインジケーターが必要なら、フリーランスでご注文ください
フリーランスに移動
このコードに基づいたロボットまたはインジケーターが必要なら、フリーランスでご注文ください
フリーランスに移動
Author:
Description:
An interesting EA that works on GBP pairs and also teaches you how to make your EAs faster
Inputs are:
|
Parameter |
Description |
|---|---|
Lots |
:+/- standard / %risk |
TakeProfit |
self explanatory |
StopLoss |
|
TrailingStop |
|
cciPeriod |
iCCI() bars |
cciLimit |
+/- iCCI() upper/lower threshold |
MaxPos |
open positions allowed in one direction |
Interval |
minutes before sending a new order (o=not used) |
Reduce |
minutes before reducing TP by one pip (0=not used) |
Live |
minutes before closing an order regardless profit (0=not used) |
Volatility |
volatility minute bars (+directional or -non dir.) |
Threshold |
pip threshold for volatility |
FridayClose |
the time to close all orders on Friday (0=not used) |
Slippage |
the slippage for opening or closing an order |
Spreadlimit |
the maximum spread allowed for opening an order |
Magic |
self explanatory |
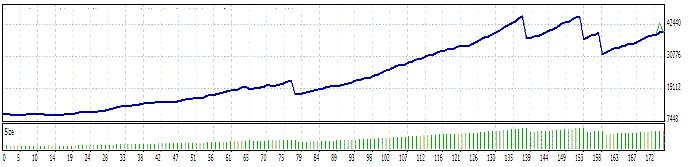
Here's a tester graph for EURGBP M1 3yrs to date
 Create your own neural network predictor easily (example: MA and RSI Predictors)
I've modified the "Next price predictor" posted by gpwr to allow any developer to create its own BPNN predictor easily, even without understanding how a neural network works. So easy even beginners can do it. Included: MA predictor and RSI predictor.
Two Pole Smoothed Ehlers Oscillator
This oscillator is based on Ehlers' Two Pole Super Smoother, converted as an oscillator, and smoothed using Ehlers' Instantaneous trendline.
 AIS5 Trade Machine
Alfa Release English
Trend Indicator for several timeframes
It shows a trend table for a several timeframes in the bottom left corner of the chart.