私たちのファンページに参加してください
- ビュー:
- 37877
- 評価:
- パブリッシュ済み:
- アップデート済み:
-
このコードに基づいたロボットまたはインジケーターが必要なら、フリーランスでご注文ください フリーランスに移動
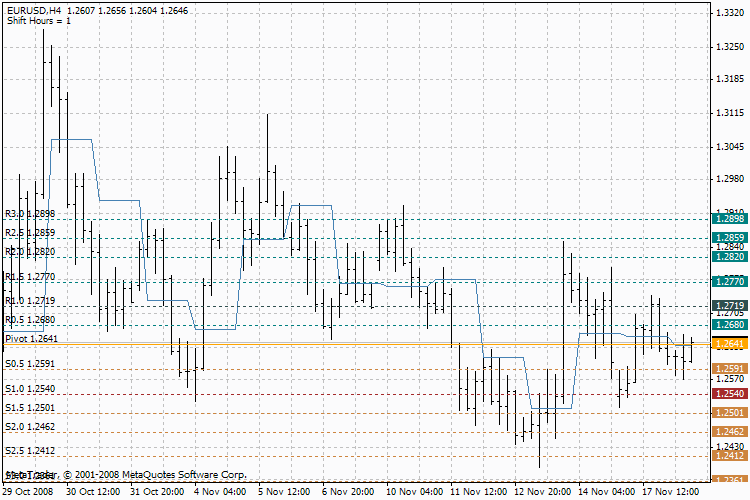
Using indicator DailyPivot_Shift the main levels can be calculated based on shifted beginning of day. Thus it is possible to calculate levels using local time, instead of server time. For example, GMT-8. Also DailyPivot_Shift indicator does not take the quotes of Saturday and Sunday during calculation of levels on Monday.

The DailyPivot Points indicator helps to get the
idea of the future market movements, unlike other tools that are
usually behind the market. Information that has become available during
the previous day is used to calculate reference points for short trends
of the current day.
Pivot Point (PP) is the balance point, a
level to which the price gravitates during the day. Having got three
values of the previous day (High, Low, Close), one can calculate 13
levels for smaller timeframes: balance point, 6 resistance levels, and
6 support levels. These levels are named reference points. Reference
points allow easy determination of changes in the short trend. The most
important are the following three values: pivot point levels,
Resistance1 (RES1.0), and Support1 (SUP1.0). When the price moves
between these values, breaks are often to be seen in the movement, even
returns.
Thus, the DailyPivot Points indicator:
forecasts the range of price fluctuations;
shows where the price can stop;
shows possible point of changes in the price movement direction.
If the market at the current day is opened above the pivot point level, that this is a signal for opening long position. If the market is opened below the pivot point level, that current day is favouring for opening short position.
MetaQuotes Ltdによってロシア語から翻訳されました。
元のコード: https://www.mql5.com/ru/code/8864

