私たちのファンページに参加してください
- ビュー:
- 19353
- 評価:
- パブリッシュ済み:
- アップデート済み:
-
このコードに基づいたロボットまたはインジケーターが必要なら、フリーランスでご注文ください フリーランスに移動
Description:
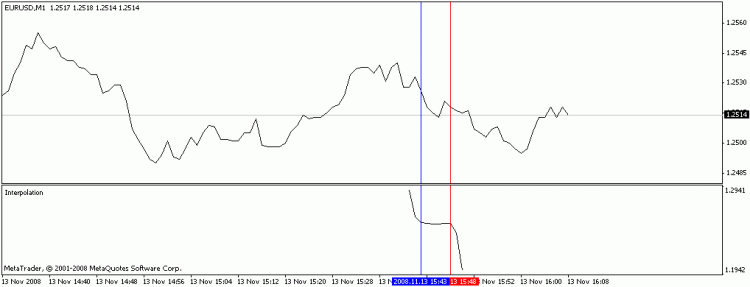
Lagrange's interpolation polynomial is used for the determination of the function on the basis of the given points. In point of fact, the indicator takes the coordinates of the points located between extern int begin and extern int end (marked with the red and blue lines on the chart), and calculates the coordinates of the next points using the Lagrange's interpolation polynomial.
Parameters:
begin - the number of the bar the selection of points' coordinates for the interpolation is begun with. It is marked with the red line;
end - the number of the bar the selection of points' coordinates for the interpolation is finished with. It is marked with the blue line;
numPrognoz - the number of the points located to the left and to the right of the begin and end, that are calculated using the Lagrange's interpolation polynomial.
Picture:
Notes:
- (end-begin)=the degree of the polynomial. I.e. if the distance between "begin" and "end" is equal to two, then the chart will appear as a parabola, if it is equal to three, then it will be a hyperbola, etc.
- (begin-numPrognoz) must be greater than zero, because the numbers from the "begin" to "begin-numPrognoz" determine the number of bars the function will be drawn for. By the way, does anybody know how to draw on the -1-st bar?
MetaQuotes Ltdによってロシア語から翻訳されました。
元のコード: https://www.mql5.com/ru/code/8566
 Indicator Volumes Buy-Sell
This indicator signal buys and sell in the market.
 LotsRisk
The calculation of the amount of lots considering the possible loss. The maximum loss volume is specified in percents of the current balance.
 Traders Dynamic Index with Visual and Audible Alerts
I added audible alerts so that when a strong buy or strong sell signal it can generate alerts when the "SoundOn" input variable is set to true.
 Murrey Math Lines (Support and Resistance)
MM Lines are drawn where support and resistance is.
