無料でロボットをダウンロードする方法を見る
Facebook上で私たちを見つけてください。
私たちのファンページに参加してください
私たちのファンページに参加してください
スクリプトを気に入りましたか?MetaTrader 5ターミナルの中でそれを試してみてください。
- ビュー:
- 51432
- 評価:
- パブリッシュ済み:
- アップデート済み:
-
 取引の機会を逃しています。
- 無料取引アプリ
- 8千を超えるシグナルをコピー
- 金融ニュースで金融マーケットを探索
-
 このコードに基づいたロボットまたはインジケーターが必要なら、フリーランスでご注文ください
フリーランスに移動
このコードに基づいたロボットまたはインジケーターが必要なら、フリーランスでご注文ください
フリーランスに移動
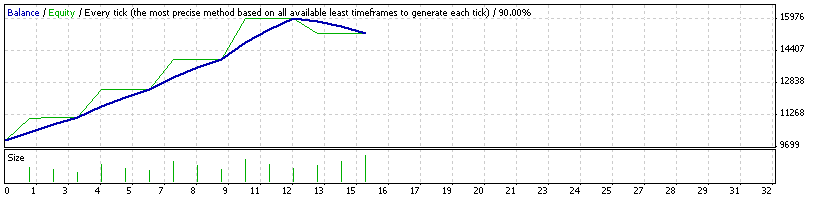
Strategy Tester Report
TheMasterMind3(Champion Edition)
AlpariUS-Demo (Build 218)
| Symbol | EURUSD (Euro vs US Dollar) | ||||
| Period | 5 Minutes (M5) 2008.10.01 00:00 - 2008.10.01 13:10 (2008.10.01 - 2008.12.31) | ||||
| Model | Every tick (the most precise method based on all available least timeframes) | ||||
| Parameters | Lots=200; StopLoss=2000; TakeProfit=0; TradeAtCloseBar=true; TrailingStop=0; TrailingStep=1; BreakEven=0; MagicNumber=0; Repeat=3; Periods=5; UseAlert=false; SendEmail=true; TradeLog="MasterMind2"; Slippage=3; Indicator_Setting="---------- Indicator Setting"; Crash=false; TimeFrame=0; Length=5; Method=3; Smoothing=1; Filter=5; RealTime=true; Steady=false; Color=true; Alerts=true; EmailON=false; SignalPrice=true; SignalPriceBUY=Yellow; SignalPriceSELL=Aqua; CountBars=1485; | ||||
| Bars in test | 1159 | Ticks modelled | 10977 | Modelling quality | 90.00% |
| Mismatched charts errors | 0 | ||||
| Initial deposit | 10000.00 | ||||
| Total net profit | 5262.00 | Gross profit | 6012.00 | Gross loss | -750.00 |
| Profit factor | 8.02 | Expected payoff | 350.80 | ||
| Absolute drawdown | 627.00 | Maximal drawdown | 4876.00 (25.77%) | Relative drawdown | 25.77% (4876.00) |
| Total trades | 15 | Short positions (won %) | 9 (66.67%) | Long positions (won %) | 6 (100.00%) |
| Profit trades (% of total) | 12 (80.00%) | Loss trades (% of total) | 3 (20.00%) | ||
| Largest | profit trade | 817.00 | loss trade | -330.00 | |
| Average | profit trade | 501.00 | loss trade | -250.00 | |
| Maximum | consecutive wins (profit in money) | 12 (6012.00) | consecutive losses (loss in money) | 3 (-750.00) | |
| Maximal | consecutive profit (count of wins) | 6012.00 (12) | consecutive loss (count of losses) | -750.00 (3) | |
| Average | consecutive wins | 12 | consecutive losses | 3 | |
")
The MasterMind3(Champion Edition)
| # | Time | Type | Order | Size | Price | S / L | T / P | Profit | Balance |
| 1 | 2008.10.01 01:37 | sell | 1 | 1.30 | 1.4127 | 1.6127 | 0.0000 | ||
| 2 | 2008.10.01 01:38 | sell | 2 | 1.10 | 1.4127 | 1.6127 | 0.0000 | ||
| 3 | 2008.10.01 01:39 | sell | 3 | 0.90 | 1.4127 | 1.6127 | 0.0000 | ||
| 4 | 2008.10.01 03:49 | close | 1 | 1.30 | 1.4094 | 1.6127 | 0.0000 | 429.00 | 10429.00 |
| 5 | 2008.10.01 03:50 | close | 2 | 1.10 | 1.4092 | 1.6127 | 0.0000 | 385.00 | 10814.00 |
| 6 | 2008.10.01 04:10 | close | 3 | 0.90 | 1.4092 | 1.6127 | 0.0000 | 315.00 | 11129.00 |
| 7 | 2008.10.01 04:11 | buy | 4 | 1.50 | 1.4091 | 1.2091 | 0.0000 | ||
| 8 | 2008.10.01 04:12 | buy | 5 | 1.20 | 1.4091 | 1.2091 | 0.0000 | ||
| 9 | 2008.10.01 04:12 | buy | 6 | 1.00 | 1.4089 | 1.2089 | 0.0000 | ||
| 10 | 2008.10.01 05:25 | close | 4 | 1.50 | 1.4128 | 1.2091 | 0.0000 | 555.00 | 11684.00 |
| 11 | 2008.10.01 05:25 | close | 5 | 1.20 | 1.4128 | 1.2091 | 0.0000 | 444.00 | 12128.00 |
| 12 | 2008.10.01 05:26 | close | 6 | 1.00 | 1.4128 | 1.2089 | 0.0000 | 390.00 | 12518.00 |
| 13 | 2008.10.01 05:26 | sell | 7 | 1.70 | 1.4129 | 1.6129 | 0.0000 | ||
| 14 | 2008.10.01 05:47 | sell | 8 | 1.40 | 1.4129 | 1.6129 | 0.0000 | ||
| 15 | 2008.10.01 05:48 | sell | 9 | 1.10 | 1.4129 | 1.6129 | 0.0000 | ||
| 16 | 2008.10.01 07:07 | close | 7 | 1.70 | 1.4094 | 1.6129 | 0.0000 | 595.00 | 13113.00 |
| 17 | 2008.10.01 07:08 | close | 8 | 1.40 | 1.4094 | 1.6129 | 0.0000 | 490.00 | 13603.00 |
| 18 | 2008.10.01 07:08 | close | 9 | 1.10 | 1.4092 | 1.6129 | 0.0000 | 407.00 | 14010.00 |
| 19 | 2008.10.01 07:08 | buy | 10 | 1.90 | 1.4092 | 1.2092 | 0.0000 | ||
| 20 | 2008.10.01 07:09 | buy | 11 | 1.50 | 1.4092 | 1.2092 | 0.0000 | ||
| 21 | 2008.10.01 07:09 | buy | 12 | 1.20 | 1.4092 | 1.2092 | 0.0000 | ||
| 22 | 2008.10.01 08:28 | close | 10 | 1.90 | 1.4135 | 1.2092 | 0.0000 | 817.00 | 14827.00 |
| 23 | 2008.10.01 08:28 | close | 11 | 1.50 | 1.4135 | 1.2092 | 0.0000 | 645.00 | 15472.00 |
| 24 | 2008.10.01 08:28 | close | 12 | 1.20 | 1.4137 | 1.2092 | 0.0000 | 540.00 | 16012.00 |
| 25 | 2008.10.01 08:28 | sell | 13 | 2.20 | 1.4138 | 1.6138 | 0.0000 | ||
| 26 | 2008.10.01 08:28 | sell | 14 | 1.70 | 1.4139 | 1.6139 | 0.0000 | ||
| 27 | 2008.10.01 08:28 | sell | 15 | 1.40 | 1.4140 | 1.6140 | 0.0000 | ||
| 28 | 2008.10.01 13:13 | close at stop | 15 | 1.40 | 1.4153 | 1.6140 | 0.0000 | -182.00 | 15830.00 |
| 29 | 2008.10.01 13:13 | close at stop | 14 | 1.70 | 1.4153 | 1.6139 | 0.0000 | -238.00 | 15592.00 |
| 30 | 2008.10.01 13:13 | close at stop | 13 | 2.20 | 1.4153 | 1.6138 | 0.0000 | -330.00 | 15262.00 |
 ZigZag with Its Own "Channel"
The drawing of the channel's borders was added to the standard ZigZag by MetaQuotes.
i-BandsWidth.mq4
On Bollinger Bands grounds
Indicator iCCI_M1+H1+D1
It draws three lines of different periods in one subwindow.
 SupportResistTrade
Trading by a break through of the support/resistance levels.