私たちのファンページに参加してください
- ビュー:
- 54559
- 評価:
- パブリッシュ済み:
- アップデート済み:
-
このコードに基づいたロボットまたはインジケーターが必要なら、フリーランスでご注文ください フリーランスに移動
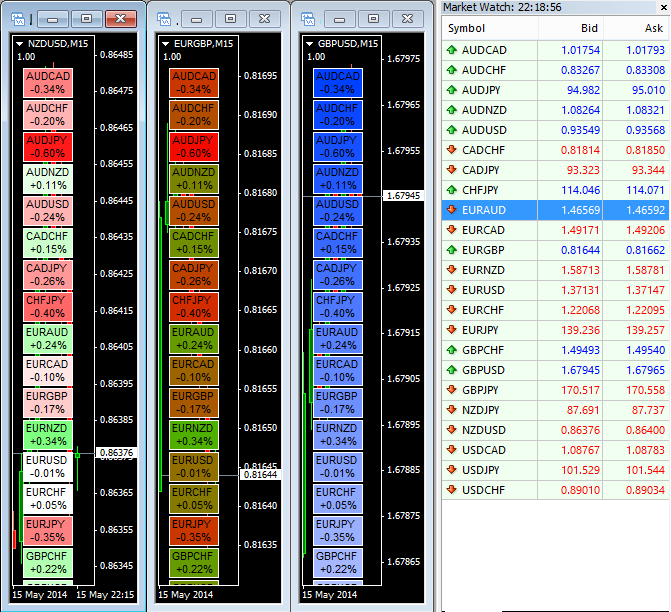
The purpose of this code is to demonstrate how easy it is to create color scales, color gradients and heatmaps with the MQL4 language and functions.
In order to facilitate things, we will work with the RGB color model and the standard conversion function StringToColor. Other color conversion methods can be implemented in MQL4, however we have decided to use the RGB color model due to the facility to perform mathematical operations on the colors.

Recommendations:
- It's recommended to use this whenever you want to know the daily percent change of all the assets you have on the Market Watch.
- It's recommended to use at least 5 symbols and at most 20-25 symbols (in order to fit on the screen).
- You can choose one of the 3 display modes: Scale, Gradient or Heatmap.
 MAC3D Custom Indicator.
3 Dimensional MACD Ribbon.
 Order Manage EA
This is a percentage of the user set stop-loss or profit robot.
 DailyLines
DailyLines Vertical lines starting new Day with above name of the DAY. Period Separators with options to choose different styles.
 Step Up and Down Forex Indicator
Step Up and Down Forex Indicator draws the price direction movement with single arrow Up or Down on the trading chart.