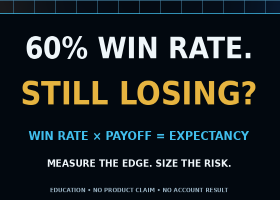
A high win rate can feel reassuring. It can also hide a losing payoff structure.
A strategy can win 60% of its trades and still lose money. Another strategy can win only 40% and still have a positive long-run structure.
The difference is not mysterious. Win rate tells you how often a trade wins. It does not tell you how much the average winner earns, how much the average loser costs, how long the losing streaks can become, or whether the position size lets the account survive them.
This Risk Lab lesson gives you a practical framework for reading a backtest report, EA history, signal record, or discretionary journal without stopping at one attractive percentage.
Start with Expectancy, Not Win Rate Alone
A simple expectancy model is:
Expectancy = Win Rate × Average Win − Loss Rate × Average Loss
The formula combines frequency and size.
To make different trades comparable, the examples use R.
1R is the amount you planned to lose if the logical Stop was reached on that trade.
R is not a fixed number of dollars or pips. If one trade risks 100 USD, then 1R for that trade is 100 USD. If another trade risks 40 USD, then 1R for that trade is 40 USD.
Watch the Full Risk Lab Episode
The long-form video is the main lesson. The calculations below let you apply the same ideas directly to your own MT5 report or trading record.
Why a 60% Win Rate Can Still Lose Money
Consider this simplified model:
- Win Rate: 60%
- Average Win: +0.5R
- Average Loss: −1R
The expectancy is:
0.60 × 0.5R − 0.40 × 1R = −0.10R per trade
Over 100 trades with the same assumptions, the mathematical expectation is −10R before spread, commission, slippage, swap, or financing.
The strategy wins more often than it loses, but the average winner is too small relative to the average loser.
Why a 40% Win Rate Can Have a Positive Structure
Now consider a second simplified model:
- Win Rate: 40%
- Average Win: +2R
- Average Loss: −1R
The expectancy is:
0.40 × 2R − 0.60 × 1R = +0.20R per trade
Over 100 trades with the same assumptions, the mathematical expectation is +20R before trading costs.
This second process loses more often. It can still have the stronger payoff structure because its average winner is large enough to compensate for the greater number of losses.
See the 60-Second Comparison
Watch the new Risk Lab Episode 01 Shorts lesson
The Short uses a separate script, new Andrew narration, a vertical 1080×1920 layout, moving NINJA action, and large English captions. It is a quick comparison; the long-form video provides the fuller risk framework.
There Is No Universally Good Win Rate
The break-even win rate depends on the payoff ratio.
Using the magnitude of the average loss:
Break-even Win Rate = Average Loss ÷ (Average Win + Average Loss)
- If the average win and average loss are both 1R, break-even is 50% before costs.
- If the average win is 2R and the average loss is 1R, break-even is about 33.3% before costs.
- If the average win is 0.5R and the average loss is 1R, break-even is about 66.7% before costs.
There is no universally good win rate without the payoff beside it.
Trading Costs Can Remove a Small Edge
Suppose a strategy has a gross expectancy of +0.10R per trade.
If the average combined effect of spread, commission, slippage, swap, or financing is 0.06R per trade, the illustrative net expectancy becomes:
+0.10R − 0.06R = +0.04R per trade
This is an illustrative example, not a measured result from the current video.
Costs matter especially when the target is small, holding time is short, or trading frequency is high. A process with only a narrow gross edge can become neutral or negative when tested with realistic execution conditions.
A Losing Streak Is Not Automatic Proof That the Strategy Is Broken
Assume, only for illustration:
- The true Win Rate is 60%
- The Loss Probability is 40%
- There are 100 trades
- Each trade is independent
- The probability remains stable
Under that simplified model, the probability of seeing at least one run of five consecutive losses somewhere in the 100 trades is approximately 45.9%.
This is not a forecast of your next 100 trades. Real trading outcomes can be correlated, market regimes can change, and execution conditions can cluster losses.
The useful lesson is narrower:
A losing streak is not automatic proof that a strategy is broken.
It is also not a reason to continue without investigation.
When a streak appears, check whether:
- Average Win has fallen
- Average Loss has increased
- Spread or slippage has changed
- The market regime has shifted
- The rules were followed
- The live process still matches the tested process
Risk Per Trade Changes How Much Account Is Left After the Same Streak
With fixed-percentage sizing, risk in money falls as equity falls. The chosen percentage still changes the compounding path dramatically.
After ten consecutive losses:
- 1% risk per trade: about 90.4% remains
- 5% risk per trade: about 59.9% remains
- 10% risk per trade: about 34.9% remains
The entries and exits can be identical. The recovery burden is not.
This does not mean 1% is universally correct or that one number fits every trader. Acceptable risk depends on the strategy's observed drawdown, portfolio exposure, capital purpose, execution risk, and the user's ability to follow the plan.
Why Drawdown Recovery Accelerates
When an account falls from 100 to 80, a 20% gain on the remaining 80 produces only 96—not the original 100.
The required recovery formula is:
Required Recovery = Drawdown ÷ (1 − Drawdown)
Examples:
- −10% requires about +11.1%
- −20% requires +25%
- −30% requires about +42.9%
- −40% requires about +66.7%
- −50% requires +100%
- −60% requires +150%
- −70% requires about +233.3%
- −80% requires +400%
The purpose is not to scare the trader. It is to show why capital preservation keeps recovery realistic.
Stop First, Size Second
A favorite lot size should not decide where the Stop goes.
A more consistent process is:
- Choose the logical level where the trade idea becomes invalid.
- Choose the account risk in money or as a percentage.
- Calculate the loss for one lot if price reaches that Stop.
- Divide the risk budget by the loss per lot.
The basic formulas are:
Risk Amount = Account Equity × Risk Percentage
Position Size = Risk Amount ÷ Loss per Lot at the Stop
Illustrative example:
- Account Equity: 10,000 USD
- Chosen Risk: 1% = 100 USD
- Loss at the logical Stop for 1 lot: 500 USD
- Calculated Position Size: 100 ÷ 500 = 0.20 lot
The actual calculation depends on Tick Value, Tick Size, Contract Size, account-currency conversion, Stop distance, spread, commission, slippage, and broker volume rules.
The result also has to be normalized to the broker's minimum lot and lot step, and the account must have enough margin.
Read More Than Win Rate in the MT5 Tester Report
The MetaTrader 5 testing report already provides several statistics that help you move beyond the win percentage.
Check at least:
- Total Trades: Is the sample large enough to interpret?
- Profit Trades and Loss Trades: This is the win-rate view, not the complete view.
- Average Profit Trade: How much does the typical winner earn?
- Average Loss Trade: How much does the typical loser cost?
- Expected Payoff: What is the average result per reported trade or deal?
- Profit Factor: How large is Gross Profit relative to Gross Loss?
- Maximum Consecutive Losses: What losing sequence appeared in the sample?
- Maximum Balance Drawdown: What did the closed-trade balance experience?
- Maximum Equity Drawdown: What did the account experience including floating changes?
- Recovery Factor: How much net profit was produced relative to maximum drawdown?
Then add checks that the headline report may not answer by itself:
- Were spread, commission, swap, financing, and slippage realistic?
- Do Long and Short results behave similarly?
- Does one month or one trading session carry the entire result?
- Are recent results weaker than older results?
- Does the result depend on a few unusually large winners?
- Is the Balance curve acceptable while Equity Drawdown is much larger?
Measure the Process You Actually Executed
A strategy on paper and the process actually traded can produce different expectancy.
The following actions change the result being measured:
- Widening the Stop after entry
- Closing valid winners too early
- Skipping valid candidates
- Increasing lot size after losses
- Adding an unplanned revenge trade
Expectancy measures the process that was actually executed—not the plan that existed only on paper.
If execution changes, recalculate Average Win, Average Loss, costs, expectancy, drawdown, and streak behavior from the actual record.
Split the Sample Without Creating a Convenient Story
A positive total can hide one strong segment carrying several weak segments.
Review the data by:
- Month
- Trading session
- Long versus Short
- Symbol
- Calm versus volatile regime
- Older versus recent period
- Manual versus EA execution
- Different cost conditions
The purpose is to understand where the edge appears and where it weakens.
Do not delete every unattractive segment after seeing the outcome and keep only the attractive part. That can turn analysis into overfitting.
Your Ten-Point Risk Review Card
- Total Trades
- Win Rate
- Average Win in R
- Average Loss in R
- Expectancy per Trade
- Maximum Losing Streak
- Maximum Drawdown
- Average Trading Cost
- Total Open and Correlated Risk
- Rule Violations
If your journal records only the win rate, add the other nine items before increasing risk.
Continue with Risk Lab
Subscribe to Atsushi K. Forex Lab for the next Risk Lab lesson
The next planned topic is The 1% Rule — Position Size in MT5, with a practical position-sizing walkthrough.
The playlist is named Risk Lab | Trading Risk Management & Position Sizing. Its direct URL was not available when this article was prepared, so no playlist link has been invented.
Use the Lesson on Your Own Report Today
If you currently judge a strategy by win rate first, open your latest test report and calculate the Average Win, Average Loss, expectancy, losing streak, and drawdown beside it.
Then compare the report with the process you actually executed and the costs you could realistically face.
Watch the full Risk Lab Episode 01 lesson, use the ten-point checklist above, and subscribe for the practical MT5 position-sizing episode.
Official References Used for the Additional MT5 and Position-Sizing Context
- MetaTrader 5 — Testing Report
- MQL5 Reference — TesterStatistics
- CME Group — Proper Position Size
- CFTC — Eight Things You Should Know Before Trading Forex
Risk notice: Forex and CFD trading involves substantial risk. The calculations in this article are simplified educational examples, not financial advice or forecasts. Historical, backtest, hypothetical, and illustrative results do not guarantee future performance.