
Opening prices are simple reference levels, but they can provide useful context when reading a chart.
For example, traders may want to know whether the current price is above or below the daily open, where the current H4 period began, or how price is moving relative to the weekly open.
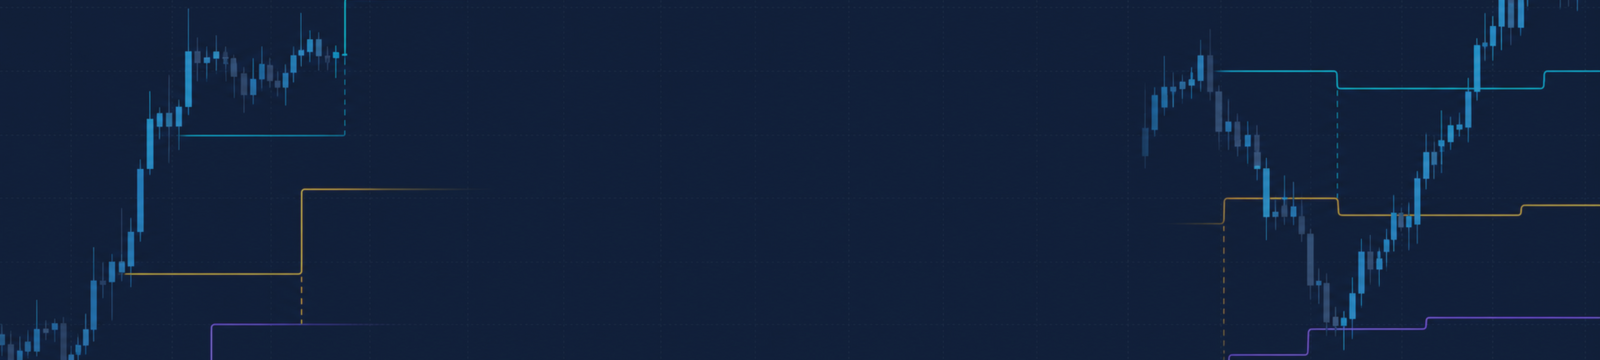
MTF Open Line is a free MetaTrader 5 indicator that displays open-price levels from multiple timeframes directly on the current chart.
What the Indicator Displays
MTF Open Line can display open prices from up to three independently configurable timeframes.
You can use:
• Higher-timeframe open prices
• Lower-timeframe open prices
• The same timeframe as the current chart
• A combination of three different timeframes
Each line is drawn from the beginning of its selected timeframe period to the beginning of the next period.
This makes it easier to see which open price belongs to each period. The currently active period can also be displayed and updated automatically.
Practical Setup Examples
Here are several possible combinations:
M15 chart:
• H1 open
• H4 open
• D1 open
H1 chart:
• H4 open
• D1 open
• W1 open
M5 chart:
• H1 open
• D1 open
• W1 open
H1 chart with lower-timeframe information:
• M15 open
• H1 open
• H4 open
The indicator is not limited to displaying higher-timeframe levels. A lower timeframe can also be shown on a higher-timeframe chart.
However, lower-timeframe segments are shorter and may overlap depending on the chart scale and the number of historical periods displayed.
Main Display Settings
Each of the three timeframes has its own settings:
• Enable or disable
• Selected timeframe
• Line color
• Line style
• Line width
This makes it possible to assign a different appearance to each timeframe.
For example, you could use:
• Cyan for H1
• Gold for D1
• Violet for W1
The indicator also includes common display settings:
• Number of historical open periods
• Show or hide the current active period
• Connect consecutive levels with vertical lines
• Show the latest open-price labels
• Adjust the label font size
• Adjust the refresh interval
The latest timeframe name and open price can be displayed on the right side of the chart.
How the Levels Can Be Used
Open-price levels can help provide basic chart context.
For example:
• Price above the daily open may indicate positive intraday positioning.
• Price below the daily open may indicate negative intraday positioning.
• The H4 open can provide a reference for shorter-term movement.
• The weekly open can provide broader directional context.
• Repeated reactions around an open level may identify an area worth observing.
These are observations, not automatic entry rules.
MTF Open Line does not decide whether traders should buy or sell.
What the Indicator Does Not Do
MTF Open Line is a visual chart-analysis tool only.
It does not:
• Generate BUY or SELL signals
• Open trades
• Modify positions
• Close trades
• Manage Stop Loss or Take Profit
• Guarantee future price direction
Trading decisions and risk management remain the responsibility of the trader.
Broker-Time Differences
Open prices and timeframe boundaries are based on the data and server time supplied by your broker.
For this reason, daily and weekly open prices may differ between brokers. A broker with a different server timezone may begin its daily candle at a different time.
Historical lines may also take time to appear if MetaTrader 5 has not yet loaded the required timeframe data.
If a selected timeframe does not appear immediately, open that timeframe once in MT5 and allow the historical data to load.
Free Download
MTF Open Line is available free of charge from MQL5 Market:
Install it on an MT5 chart, select up to three timeframes and adjust the line colors and display settings to match your chart layout.
Important Note
This indicator provides price-reference levels for visual analysis. It is not a trading signal and does not guarantee any trading result.
Always make trading decisions using your own analysis and risk-management rules.