
MQL5での作画スタイル

はじめに
MQL4では、6つの作画スタイルがありました。MQL5では、18の作画スタイルがあります。そのため、MQL5の作画スタイルを紹介する記事を書くに値するかもしれません。
本記事では、MQL5での作画スタイルの詳細を考えます。さらに、 インディケーターを作成してどのようにこれらの作画スタイルを使い、プロットを洗練するかお見せします。
作画スタイル
MQL4では、プロットのコンセプトがなく、SetIndexStyle() 関数の最初のパラメータ、Line index、がプロットインデックスに当たります。
void SetIndexStyle( int index, int type, int style=EMPTY, int width=EMPTY, color clr=CLR_NONE)
// The index is Line index.
MQL4では、6つの作画スタイルしかなく、DRAW_ZIGZAG は2つのバッファーが必要で、他の 5 つの作画スタイルは一つのバッファーのみ必要です。
そのためMQL4では、 SetIndexStyle() 関数の最初のパラメータが簡単にバッファーインデックスとして理解されます。DRAW_ZIGZAGを使わなけれな全く問題はありません。ところで、MQL4インディケーターがDRAW_ZIGZAGと実装されたのを見たことがありますか?私は見たことがありません。(ZigZag.mq4 is implemented with DRAW_SECTION).
MQL4とMQL5で、作画スタイルを比較しましょう。:

表 1. MQL4とMQL5の作画スタイル
何が見えますか?MQL5では新しい12の作画スタイルが追加され、カラーバッファー付きの8つの新しい作画スタイルがあります。前のように抽象的に使うことはできません。ラインインデックスのコンセプトは簡単に混乱を招きます。
そのため、MQL5ではプロットがあり、それはMQL4におけるインディケーター ウインドウでの作画を可能にするラインに当たります。
MQL5では、ラインを作画できるだけでなく、名前もプロットについてさらに正確です。
Buffer-Pattern
ここでは Buffer-Pattern のコンセプトを定義します。作画スタイルのBuffer-Pattern はバッファーナンバー、タイプ、配置を必要とします。
作画スタイルのBuffer-Patternを文字列付きで表せます。左から右へインデックスナンバーの小から大に応じて、文字DはDataBuffer、文字CはColorBuffer。
そのため、MQL5 作画スタイルのBuffer-Pattern は以下の表に表されます。 :

表 2. MQL5の作画スタイル用Buffer-Pattern
インディケーターにマルチプロットがある場合、インディケーターのBuffer-PatternはこれらのプロットBuffer-Patternのオーダー の中に配置され、SetIndexBuffer()呼び出し時Bufferのインデックスが昇順であるべきです。
補助バッファーを計算に必要な一時的データを保存するの使った場合、これらの補助バッファーはSetIndexBuffer()と結合し、表示できるバッファーの最後に置かれなければなりません。
そうでなければ ...
buffer-patternを見せるためにインディケーターDemoBufferPatternを発行しました。使ってみてください。
インディケーター DemoDrawType
インディケーター DemoDrawTypeを考えましょう。

図 1. インディケーター入力パラメーター
")
図 2. インディケーター入力パラメーター (続き)
これにより「Input」 タブからどんな作画スタイル も選択でき、プロットの様々なプロパティを設定できます。

図 3. 作画スタイルリスト
そのため, 各属性の入力変数を定義し、 関数を実行してこれらの変数の合理性をチェックする必要があります。
入力変数はプログラムで修正できないので、グローバル変数の一式を定義し、確認済の入力変数値を保持する必要がまたあります。
//--- input parameters
input ENUM_DRAW_TYPE InpDrawType    = DRAW_LINE;
input ENUM_LINE_STYLE InpLineStyle  = STYLE_SOLID;
input bool InpShowData        = true;
input uchar InpArrow          = 159;
input int InpArrowShift       = -10;
input int InpDrawBegin        = 10;
input int InpShift            = 10;
input int InpLineWidth        = 1;
input int InpColorNum         = 60;
input color InpPlotColor      = RoyalBlue;
input double InpEmptyValue    = 0.0;
input string InpLabel         = "Value";
input bool InpTestEmptyValue  = false;

//Note: Variables declared at global level must not be mixed up with the client terminal
//global variables that can be accessed using the GlobalVariable...() functions.
//--- you can not change input parameters in code, so you need Global Variables
ENUM_DRAW_TYPE iDrawType      = DRAW_LINE;
ENUM_LINE_STYLE iLineStyle    = STYLE_SOLID;
bool bShowData       = true;
uchar uArrow         = 181;
int iArrowShift      = -10;
int iDrawBegin       = 10;
int iShift           = 10;
int iLineWidth       = 1;
int iColorNum        = 60;
color iPlotColor     = RoyalBlue;
string sLabel        = "";
bool bTestEmptyValue = false;
double dEmptyValue   = EMPTY_VALUE;

//+------------------------------------------------------------------+
//| check input parameters.                                          |
//+------------------------------------------------------------------+
bool checkInput()
  {
   if(InpDrawType<DRAW_NONE || InpDrawType>DRAW_COLOR_CANDLES) return(false);
   else iDrawType = InpDrawType;
   if(InpLineStyle<STYLE_SOLID || InpLineStyle>STYLE_DASHDOTDOT) return(false);
   else iLineStyle = InpLineStyle;
   bShowData   = InpShowData;
   uArrow      = InpArrow;    //if uArrow>255, MQL5 will set Arrow as uArrow%256
   iArrowShift = InpArrowShift;
   iDrawBegin  = InpDrawBegin;
   iShift      = InpShift;
   iLineWidth  = InpLineWidth;
   iColorNum   = InpColorNum;
   iPlotColor  = InpPlotColor;
   //if(InpEmptyValue<=0.0) dEmptyValue=0.0;
   //else dEmptyValue=EMPTY_VALUE;
   dEmptyValue = InpEmptyValue;  // It may be not 0.0 or EMPTY_VALUE
   sLabel      = InpLabel;
   bTestEmptyValue = InpTestEmptyValue;
   return(true);
  }
すべての18の作画スタイルの例は図 4-21に表されます。:
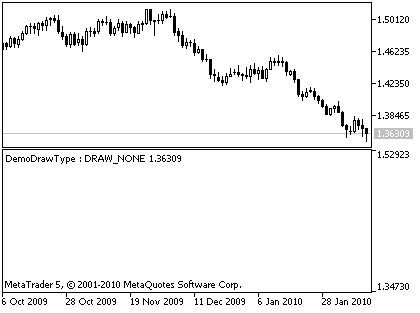
図 4. 作画スタイルDRAW_NONEの例
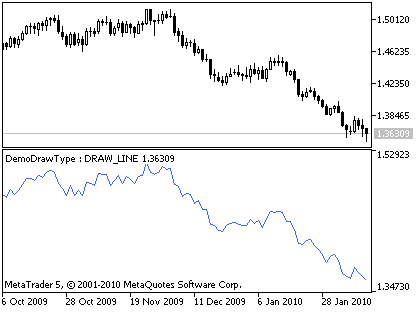
図 5. 作画スタイルDRAW_LINEの例
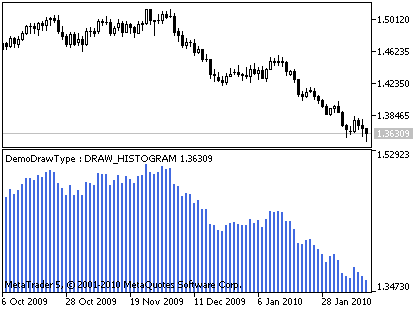
図 6. 作画スタイルDRAW_HISTOGRAMの例
![]()
図 7. 作画スタイルDRAW_ARROWの例
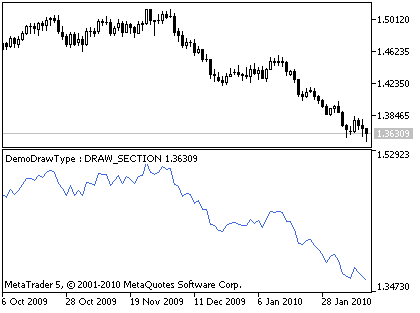
図 8. 作画スタイル DRAW_SECTIONの例
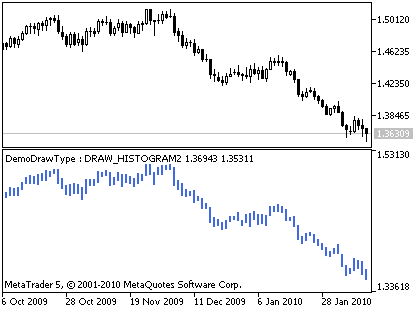
図 9. 作画スタイルDRAW_HISTOGRAM2の例
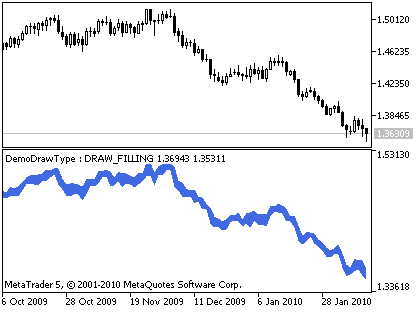
図 10. 作画スタイル DRAW_FILLINGの例
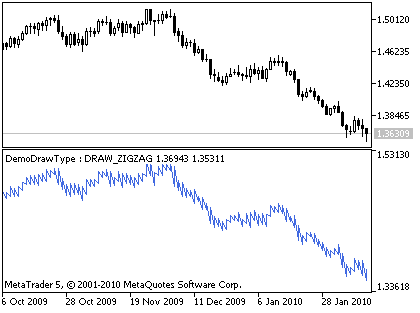
図 11. 作画スタイル DRAW_ZIGZAGの例
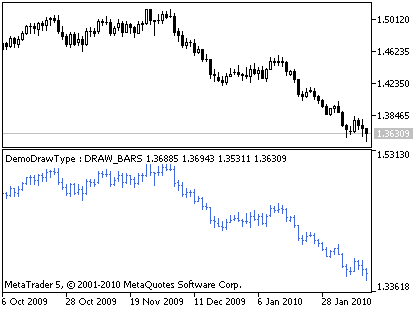
図 12. 作画スタイル DRAW_BARSの例
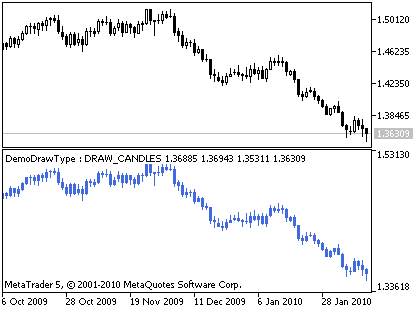
図 13. 作画スタイル DRAW_CANDLESの例
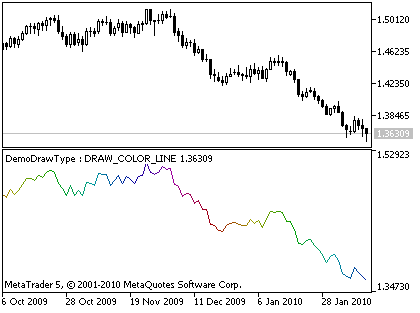
図 14. 作画スタイル DRAW_COLOR_LINEの例
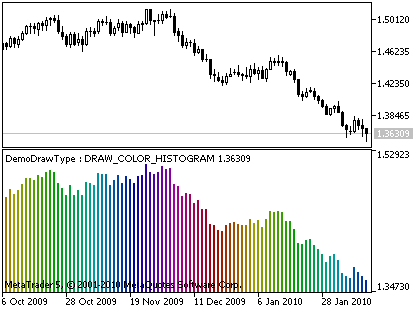
図 15. 作画スタイル DRAW_COLOR_HISTOGRAMの例
![]()
図 16. 作画スタイル DRAW_COLOR_ARROWの例
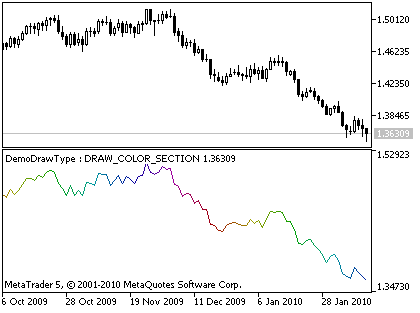
図 17. 作画スタイル DRAW_COLOR_SECTIONの例
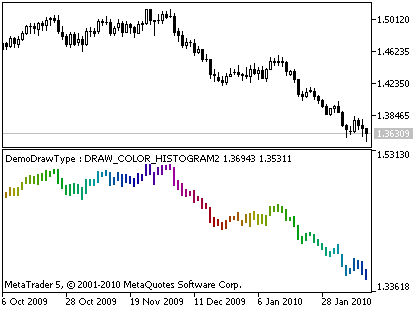
図 18. 作画スタイル DRAW_COLOR_HISTOGRAM2の例

図 19. 作画スタイル DRAW_COLOR_ZIGZAGの例
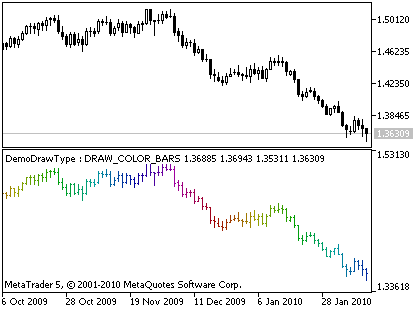
図 20. 作画スタイル DRAW_COLOR_BARSの例

図 21. 作画スタイル DRAW_COLOR_CANDLESの例
空の値へのアプローチの仕方
異なった作画スタイルは異なったチャートを表示するので、別のBuffer-Patternを要求します。
異なったBuffer-Patternsの上に、作画スタイル間の最も大きな違いは空の値へのアプローチです。
なので、空の値を挿入できるようにする入力パラメーターを追加しました。このインディケーターの目的はDrawTypeを実証することですので, 単にnull 値の部分をセットアップします。
空の値への異なったアプローチ法に基づいて、全ての作画スタイルは3つのカテゴリーに分けられます。:

表 3. カテゴリー別作画スタイル
例は図 22-29に表示。

図 22. 作画スタイル DRAW_LINE (空の値付き)の例
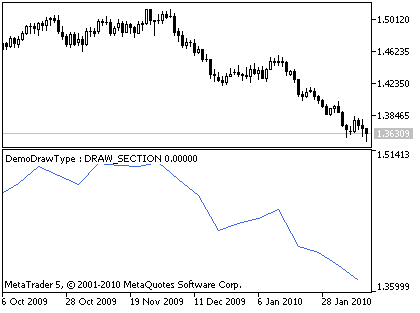
図 23. 作画スタイル DRAW_SECTION (空の値付き)の例
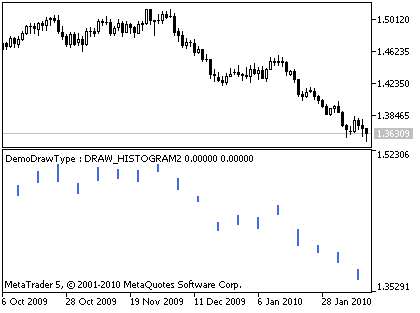
図 24. 作画スタイル DRAW_HISTOGRAM2 (空の値付き)の例
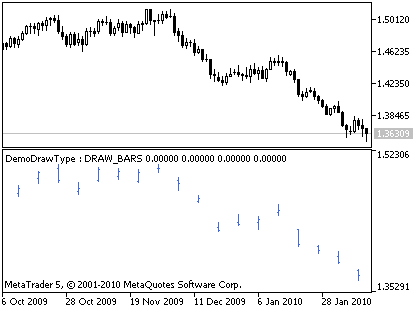
図 25. 作画スタイル DRAW_BARS (空の値付き)の例
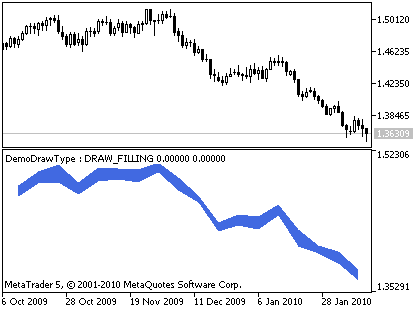
図 26. 作画スタイル DRAW_FILLING (空の値付き)の例
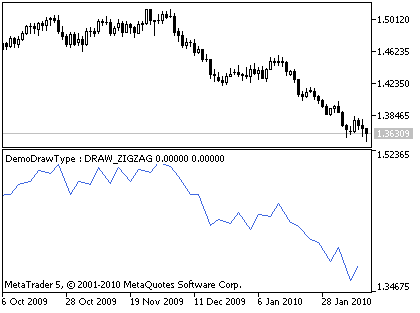
Figure 27. 作画スタイル DRAW_ZIGZAG (空の値付き)の例
![]()
Figure 28. 作画スタイル DRAW_COLOR_ARROW (空の値付き)の例
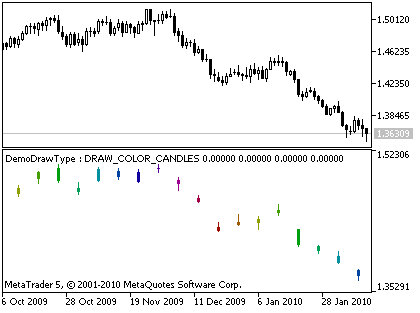
Figure 29. 作画スタイル DRAW_COLOR_CANDLES (空の値付き)の例
インディケーターの完全なソースコード:
//+------------------------------------------------------------------+
//|                                                 DemoDrawType.mq5 |
//|                             Copyright 2010, Loong@forum.mql4.com |
//|                             http://login.mql5.com/en/users/Loong |
//+------------------------------------------------------------------+
#property copyright "2010, Loong@forum.mql4.com"
#property link      "http://login.mql5.com/en/users/Loong"
#property version   "1.00"

//#property indicator_chart_window
#property indicator_separate_window // in order to more clearly show
#property indicator_plots   1 //must set, can be bigger than necessary, can not be bigger than indicator_buffers
#property indicator_buffers 5 //must set, can be bigger than necessary
//+------------------------------------------------------------------+
//| DrawType struct, record info about DrawType and Buffer-Pattern   |
//+------------------------------------------------------------------+
struct SLoongDrawType                       // Draw Type
  {
   ENUM_DRAW_TYPE    eDrawType;             // enum of Draw Type
   int               iDrawType;             // value of Draw Type, only used to look
   int               iNumBufferData;        // number of Data Buffer
   int               iNumBufferColor;       // number of Color Buffer
   string            sDrawType;             // string of Draw Type
   string            sDrawTypeDescription;  // string of Draw Type Description, copy from document
  };
//+------------------------------------------------------------------+
//| const array, record info about DrawType and Buffer-Pattern       |
//+------------------------------------------------------------------+
const SLoongDrawType caDrawType[]=
  {
     { DRAW_NONE,              0,    1,    0,    "DRAW_NONE",             "Not drawn" },
     { DRAW_LINE,              1,    1,    0,    "DRAW_LINE",             "Line" },
     { DRAW_HISTOGRAM,         2,    1,    0,    "DRAW_HISTOGRAM",        "Histogram from the zero line" },
     { DRAW_ARROW,             3,    1,    0,    "DRAW_ARROW",            "Drawing arrows" },
     { DRAW_SECTION,           4,    1,    0,    "DRAW_SECTION",          "Section" },
     { DRAW_HISTOGRAM2,        5,    2,    0,    "DRAW_HISTOGRAM2",       "Histogram of the two indicator buffers" },
     { DRAW_ZIGZAG,            6,    2,    0,    "DRAW_ZIGZAG",           "Style Zigzag allows vertical section on the bar" },
     { DRAW_FILLING,           7,    2,    0,    "DRAW_FILLING",          "Color fill between the two levels" },
     { DRAW_BARS,              8,    4,    0,    "DRAW_BARS",             "Display as a sequence of bars" },
     { DRAW_CANDLES,           9,    4,    0,    "DRAW_CANDLES",          "Display as a sequence of candlesticks" },
     { DRAW_COLOR_LINE,       10,    1,    1,    "DRAW_COLOR_LINE",       "Multicolored line" },
     { DRAW_COLOR_HISTOGRAM,  11,    1,    1,    "DRAW_COLOR_HISTOGRAM",  "Multicolored histogram from the zero line" },
     { DRAW_COLOR_ARROW,      12,    1,    1,    "DRAW_COLOR_ARROW",      "Drawing multicolored arrows" },
     { DRAW_COLOR_SECTION,    13,    1,    1,    "DRAW_COLOR_SECTION",    "Multicolored section" },
     { DRAW_COLOR_HISTOGRAM2, 14,    2,    1,    "DRAW_COLOR_HISTOGRAM2", "Multicolored histogram of the two indicator buffers" },
     { DRAW_COLOR_ZIGZAG,     15,    2,    1,    "DRAW_COLOR_ZIGZAG",     "Multicolored ZigZag" },
     { DRAW_COLOR_BARS,       16,    4,    1,    "DRAW_COLOR_BARS",       "Multicolored bars" },
     { DRAW_COLOR_CANDLES,    17,    4,    1,    "DRAW_COLOR_CANDLES",    "Multicolored candlesticks" }
  };

//--- input parameters
input ENUM_DRAW_TYPE InpDrawType    = DRAW_LINE;
input ENUM_LINE_STYLE InpLineStyle  = STYLE_SOLID;
input bool InpShowData        = true;
input uchar InpArrow          = 159;
input int InpArrowShift       = -10;
input int InpDrawBegin        = 10;
input int InpShift            = 10;
input int InpLineWidth        = 1;
input int InpColorNum         = 60;
input color InpPlotColor      = RoyalBlue;
input double InpEmptyValue    = 0.0;
input string InpLabel         = "Value";
input bool InpTestEmptyValue  = false;

//Note: Variables declared at global level must not be mixed up with the client terminal
// global variables that can be accessed using the GlobalVariable...() functions.
//--- you can not change input parameters in code, so you need Global Variables
ENUM_DRAW_TYPE iDrawType      = DRAW_LINE;
ENUM_LINE_STYLE iLineStyle    = STYLE_SOLID;
bool bShowData       = true;
uchar uArrow         = 181;
int iArrowShift      = -10;
int iDrawBegin       = 10;
int iShift           = 10;
int iLineWidth       = 1;
int iColorNum        = 60;
color iPlotColor     = RoyalBlue;
string sLabel        = "";
bool bTestEmptyValue = false;
double dEmptyValue   = EMPTY_VALUE;

//--- indicator buffers
double DC[];   // color buffer
double D1[];   //  data buffer
double D2[];
double D3[];
double D4[];
//+------------------------------------------------------------------+
//| check input parameters.                                          |
//+------------------------------------------------------------------+
bool checkInput()
  {
   if(InpDrawType<DRAW_NONE || InpDrawType>DRAW_COLOR_CANDLES) return(false);
   else iDrawType=InpDrawType;
   if(InpLineStyle<STYLE_SOLID || InpLineStyle>STYLE_DASHDOTDOT) return(false);
   else iLineStyle=InpLineStyle;
   bShowData   =InpShowData;
   uArrow=InpArrow;    //if uArrow>255, MQL5 will set Arrow as uArrow%256
   iArrowShift = InpArrowShift;
   iDrawBegin  = InpDrawBegin;
   iShift      = InpShift;
   iLineWidth  = InpLineWidth;
   iColorNum   = InpColorNum;
   iPlotColor  = InpPlotColor;
//if(InpEmptyValue<=0.0) dEmptyValue=0.0;
//else dEmptyValue=EMPTY_VALUE;
   dEmptyValue=InpEmptyValue;  // It may be not 0.0 or EMPTY_VALUE
   sLabel=InpLabel;
   bTestEmptyValue=InpTestEmptyValue;
   return(true);
  }
//+------------------------------------------------------------------+
//| color well-distributed                                           |
//+------------------------------------------------------------------+
int ColorInc6section(int i,int iBase=63,int iI=0xFF)
  {
   int id  = (int)MathFloor((double)iBase/6.0);
   int ip  = (int)MathFloor((double)iI/id);
   int MA_Rinc=0;
   int MA_Ginc=0;
   int MA_Binc=0;
   color iColor=0;
   if(i<=0)        {iColor =       iI; MA_Rinc=0; MA_Ginc=0; MA_Binc=0;}
   else if(i<1*id) {iColor =       iI; MA_Rinc=  0; MA_Ginc= ip; MA_Binc=  0;}
   else if(i<2*id) {iColor =   257*iI; MA_Rinc=-ip; MA_Ginc=  0; MA_Binc=  0;}
   else if(i<3*id) {iColor =   256*iI; MA_Rinc=  0; MA_Ginc=  0; MA_Binc= ip;}
   else if(i<4*id) {iColor = 65792*iI; MA_Rinc=  0; MA_Ginc=-ip; MA_Binc=  0;}
   else if(i<5*id) {iColor = 65536*iI; MA_Rinc= ip; MA_Ginc=  0; MA_Binc=  0;}
   else if(i<6*id) {iColor = 65537*iI; MA_Rinc=  0; MA_Ginc=  0; MA_Binc=-ip;}
   else            {iColor =       iI; MA_Rinc=  0; MA_Ginc=  0; MA_Binc=  0;}
   int iColorInc=(MA_Rinc+256*MA_Ginc+65536*MA_Binc);
   return iColor+iColorInc*(i%id);
  }
//+------------------------------------------------------------------+
//| Set Plot Color Indexes                                           |
//+------------------------------------------------------------------+
void SetPlotColorIndexes(int plot_index)
  {
   int iIllumination=0xFF;
//color cBack=(color)ChartGetInteger(0,CHART_COLOR_BACKGROUND);
//Print("BACKGROUND is ",cBack);
//if(White==cBack) iIllumination=0x9F; //want to obtain a better visual effect
   PlotIndexSetInteger(plot_index,PLOT_COLOR_INDEXES,iColorNum);
   for(int i=0;i<iColorNum;i++)
      PlotIndexSetInteger(plot_index,PLOT_LINE_COLOR,i,ColorInc6section(i,iColorNum,iIllumination));
  }
//+------------------------------------------------------------------+
//| Set Plot Draw Type and other Properties                          |
//+------------------------------------------------------------------+
bool SetPlotProperties()
  {
//Print("iDrawType="+iDrawType);
   PlotIndexSetInteger(0,PLOT_DRAW_TYPE,iDrawType);
   PlotIndexSetInteger(0,PLOT_LINE_STYLE,iLineStyle);
   PlotIndexSetInteger(0,PLOT_SHIFT,iShift);
   PlotIndexSetInteger(0,PLOT_SHOW_DATA,bShowData);//--- if show indicator data in DataWindow
   PlotIndexSetInteger(0,PLOT_DRAW_BEGIN,iDrawBegin);
   PlotIndexSetInteger(0,PLOT_LINE_WIDTH,iLineWidth);
   PlotIndexSetDouble(0,PLOT_EMPTY_VALUE,dEmptyValue);
   PlotIndexSetString(0,PLOT_LABEL,sLabel);
   switch(iDrawType) //            Data  Color
     {
      case DRAW_COLOR_ARROW:       //1,    1,
         SetIndexBuffer(0,D1,INDICATOR_DATA);
         SetIndexBuffer(1,DC,INDICATOR_COLOR_INDEX);
         PlotIndexSetInteger(0,PLOT_ARROW,uArrow);
         PlotIndexSetInteger(0,PLOT_ARROW_SHIFT,iArrowShift);
         SetPlotColorIndexes(0);
         break;

      case DRAW_ARROW:             //1,    0,
         SetIndexBuffer(0,D1,INDICATOR_DATA);
         PlotIndexSetInteger(0,PLOT_ARROW,uArrow);
         PlotIndexSetInteger(0,PLOT_ARROW_SHIFT,iArrowShift);
         PlotIndexSetInteger(0,PLOT_LINE_COLOR,iPlotColor);
         break;

      case DRAW_COLOR_LINE:        //1,    1,
      case DRAW_COLOR_HISTOGRAM:   //1,    1,
      case DRAW_COLOR_SECTION:     //1,    1,
         SetIndexBuffer(0,D1,INDICATOR_DATA);
         SetIndexBuffer(1,DC,INDICATOR_COLOR_INDEX);
         SetPlotColorIndexes(0);
         break;

      case DRAW_NONE:              //1,    0,
      case DRAW_LINE:              //1,    0,
      case DRAW_HISTOGRAM:         //1,    0,
      case DRAW_SECTION:           //1,    0,
         SetIndexBuffer(0,D1,INDICATOR_DATA);
         PlotIndexSetInteger(0,PLOT_LINE_COLOR,iPlotColor);
         break;

      case DRAW_COLOR_HISTOGRAM2:  //2,    1,
      case DRAW_COLOR_ZIGZAG:      //2,    1,
         SetIndexBuffer(0,D1,INDICATOR_DATA);
         SetIndexBuffer(1,D2,INDICATOR_DATA);
         SetIndexBuffer(2,DC,INDICATOR_COLOR_INDEX);
         SetPlotColorIndexes(0);
         break;

      case DRAW_HISTOGRAM2:        //2,    0,
      case DRAW_ZIGZAG:            //2,    0,
         SetIndexBuffer(0,D1,INDICATOR_DATA);
         SetIndexBuffer(1,D2,INDICATOR_DATA);
         PlotIndexSetInteger(0,PLOT_LINE_COLOR,iPlotColor);
         break;

      case DRAW_FILLING:           //2,    0,
         SetIndexBuffer(0,D1,INDICATOR_DATA);
         SetIndexBuffer(1,D2,INDICATOR_DATA);
         PlotIndexSetInteger(0,PLOT_LINE_COLOR,iPlotColor);
         break;

      case DRAW_COLOR_BARS:        //4,    1,
      case DRAW_COLOR_CANDLES:     //4,    1,
         SetIndexBuffer(0,D1,INDICATOR_DATA);
         SetIndexBuffer(1,D2,INDICATOR_DATA);
         SetIndexBuffer(2,D3,INDICATOR_DATA);
         SetIndexBuffer(3,D4,INDICATOR_DATA);
         SetIndexBuffer(4,DC,INDICATOR_COLOR_INDEX);
         SetPlotColorIndexes(0);
         break;
      case DRAW_BARS:              //4,    0,
      case DRAW_CANDLES:           //4,    0,
         SetIndexBuffer(0,D1,INDICATOR_DATA);
         SetIndexBuffer(1,D2,INDICATOR_DATA);
         SetIndexBuffer(2,D3,INDICATOR_DATA);
         SetIndexBuffer(3,D4,INDICATOR_DATA);
         PlotIndexSetInteger(0,PLOT_LINE_COLOR,iPlotColor);
         break;
     }
   return(true);
  }
//+------------------------------------------------------------------+
//| Custom indicator initialization function                         |
//+------------------------------------------------------------------+
int OnInit()
  {
//--- ArrayInit
   bool bInitBuffer=true;
   if(bInitBuffer)
     {
      ArrayInitialize(D1,dEmptyValue);
      ArrayInitialize(D2,dEmptyValue);
      ArrayInitialize(D3,dEmptyValue);
      ArrayInitialize(D4,dEmptyValue);
      ArrayInitialize(DC,dEmptyValue);
     }
   checkInput();
   SetPlotProperties();
//--- set accuracy
   IndicatorSetInteger(INDICATOR_DIGITS,_Digits);
   IndicatorSetString(INDICATOR_SHORTNAME,"DemoDrawType : "+caDrawType[iDrawType].sDrawType);
   return(0);
  }
//+------------------------------------------------------------------+
//| Custom indicator iteration function                              |
//+------------------------------------------------------------------+
int OnCalculate(const int rates_total,
                const int prev_calculated,
                const datetime &time[],
                const double &open[],
                const double &high[],
                const double &low[],
                const double &close[],
                const long &tick_volume[],
                const long &volume[],
                const int &spread[])
  {
//--- auxiliary variables
   int i=0;
//--- set position for beginning
   if(i<prev_calculated) i=prev_calculated-1;
//--- start calculations
   while(i<rates_total)
     {
      switch(iDrawType) //            Data  Color   if(buffer contain dEmptyValue)
        {
         case DRAW_COLOR_LINE:        //1,    1,      all do not draw
            DC[i]=(double)(i%iColorNum);
         case DRAW_LINE:              //1,    0,      all do not draw
         case DRAW_NONE:              //1,    0,      draw nothing at first
            if(bTestEmptyValue)
              {
               if(i%5==1)D1[i]=high[i];
               else D1[i]=dEmptyValue;
              }
            else
               D1[i]=close[i];
            break;

         case DRAW_COLOR_SECTION:     //1,    1,      link between non-empty place
            DC[i]=(double)(i%iColorNum);
         case DRAW_SECTION:           //1,    0,      connecting adjacent non-empty value
            if(bTestEmptyValue)
              {
               if(i%5==1)D1[i]=close[i];
               else D1[i]=dEmptyValue;
              }
            else
               D1[i]=close[i];
            break;

         case DRAW_FILLING:           //2,    0,
            //DC[i]=(double)(i%iColorNum);
            if(bTestEmptyValue)
              {
               if(i%5==1)
                 {
                  D1[i]=high[i];
                  D2[i]=low[i];
                 }
               else
                 {
                  D1[i]=dEmptyValue;
                  D2[i]=dEmptyValue;
                 }
              }
            else
              {
               D1[i]=high[i];
               D2[i]=low[i];
              }
            break;

         case DRAW_COLOR_ZIGZAG:      //2,    1,
            DC[i]=(double)(i%iColorNum);
         case DRAW_ZIGZAG:            //2,    0,
            if(bTestEmptyValue)
              {
               if(i%5==1)D1[i]=high[i];
               else D1[i]=dEmptyValue;
               if(i%5==4)D2[i]=low[i];
               else D2[i]=dEmptyValue;
              }
            else
              {
               D1[i]=high[i];
               D2[i]=low[i];
              }
            break;

         case DRAW_COLOR_ARROW:       //1,    1,      draw arrow at non-empty value
         case DRAW_COLOR_HISTOGRAM:   //1,    1,      only draw at non-empty place
            DC[i]=(double)(i%iColorNum);
         case DRAW_ARROW:             //1,    0,      draw arrow at non-empty value
         case DRAW_HISTOGRAM:         //1,    0,      only draw at non-empty place
            if(bTestEmptyValue)
              {
               if(i%5==1)D1[i]=close[i];
               else D1[i]=dEmptyValue;
              }
            else
              {
               D1[i]=close[i];
              }
            break;

         case DRAW_COLOR_HISTOGRAM2:  //2,    1,      only draw at non-empty place
            DC[i]=(double)(i%iColorNum);
         case DRAW_HISTOGRAM2:        //2,    0,      only draw at non-empty place
            if(bTestEmptyValue)
              {
               if(i%5==1)
                 {
                  D1[i]=high[i];
                  D2[i]=low[i];
                 }
               else
                 {
                  D1[i]=dEmptyValue;
                  D2[i]=dEmptyValue;
                 }
              }
            else
              {
               D1[i]=high[i];
               D2[i]=low[i];
              }
            break;

         case DRAW_COLOR_BARS:        //4,    1,      only draw at non-empty place
         case DRAW_COLOR_CANDLES:     //4,    1,      only draw at non-empty place
            DC[i]=(double)(i%iColorNum);
         case DRAW_BARS:              //4,    0,      only draw at non-empty place
         case DRAW_CANDLES:           //4,    0,      only draw at non-empty place
            if(bTestEmptyValue)
              {
               if(i%5==1)
                 {
                  D1[i]=open[i];
                  D2[i]=high[i];
                  D3[i]=low[i];
                  D4[i]=close[i];
                 }
               else
                 {
                  D1[i]=dEmptyValue;
                  D2[i]=dEmptyValue;
                  D3[i]=dEmptyValue;
                  D4[i]=dEmptyValue;
                 }
              }
            else
              {
               D1[i]=open[i];
               D2[i]=high[i];
               D3[i]=low[i];
               D4[i]=close[i];
              }
            break;
        }
      //---
      i++;
     }
//--- return value of prev_calculated for next call
   return(rates_total);
  }
//+------------------------------------------------------------------+
訊かれる前にみなさんの疑問にお答えします。
Q: 何もプロットしません。
A: このインディケーターの目的はコード作成なしで全ての作画スタイルを試すことにあるので、間違ったパラメーターを入力すると、プロットしませんが騒ぐことはありません。
Q: caDrawType[] は無益のようだ。 DrawTypeの名前文字列だけを取る?
A: はい、認めます。これは私の怠りで過去のコピーです。場合によって、caDrawType[] はとても便利ですが、次の記事で考察します。
結論
作画したい物をなんでも作画できます。
コードがあなたと共にありますように。
MetaQuotes Ltdにより英語から翻訳されました。
元の記事: https://www.mql5.com/en/articles/45
警告: これらの資料についてのすべての権利はMetaQuotes Ltd.が保有しています。これらの資料の全部または一部の複製や再プリントは禁じられています。
この記事はサイトのユーザーによって執筆されたものであり、著者の個人的な見解を反映しています。MetaQuotes Ltdは、提示された情報の正確性や、記載されているソリューション、戦略、または推奨事項の使用によって生じたいかなる結果についても責任を負いません。

 MQL5でのティックインディケーターの作成
 MQL5でのインディケーター の呼び方
 MQL5でExpert Advisorを書くための初心者向けステップバイステップガイド
 の処理 トレードイベント in Expert Advisor を使って OnTrade() 関数
- 無料取引アプリ
- 8千を超えるシグナルをコピー
- 金融ニュースで金融マーケットを探索
>>> 描きたいものを描けばいい。
私は、ローソク足を2色にすることで、トレンドをよりわかりやすく表示させたいと考えています。
上昇トレンド中の強気ローソク足:緑の枠線に緑の塗りつぶし、
下降トレンド中の強気ローソク足:緑の枠線に赤の塗りつぶし、
上昇トレンド中の弱気ローソク足:赤枠で緑を塗りつぶす、
下降トレンド中の弱気ローソク足:赤枠に赤の塗りつぶし。
これはどのように可能ですか?あなたは他のプラットフォームでこの種を見つけることができます。
DRAW_CANDLES (または DRAW_COLOR_CANDLES)スタイルを使用する場合、キャンドルのボディはボーダーなしで取得されます。
DRAW_CANDLES (または DRAW_COLOR_CANDLES)スタイルを使用する場合、キャンドルのボディはボーダーなしで取得されます。