
最後の改革
はじめに
МetaТrader 5 (МetaТrader 4も同様に)で使用可能な3つの価格の提示のための手段があります:バー、ろうそく足、罫線の3つです。本質的に、これら全ては同じものを示しています。それは、タイムチャートです。時間に関連した価格提示の伝統的な方法に加えて、投資家や吐息かにとても人気な時間に関連しない手法が存在しています。Renkoと Kagiチャート、3つの改行、ポイント・フィギュアチャートです。
利点は主張しませんが、時間の変数を除くことで、トレーダーが価格の変数に焦点を当てることを可能にします。関連するチャート作成のアルゴリズムとともに、ポイント・フィギュアチャートをここでは考察します。そのようなチャートを生成し、そのアルゴリズムを実装するシンプルなスクリプトとして機能するよく知られる製品を見てみましょう。Thomas J. Dorseyの著書"Point and Figure Charting: The Essential Application for Forecasting and Tracking Market Prices"が私たちの入門の本となります。
Bull's-Eye Brokerは最も有名なオフラインのチャートを描画するためのソフトウェアです。そのソフトウェアは、21日間のトライアルが提供されており、新しいベータ版がベータ期間の間は使用可能です。このソフトウェアは、スクリプトのパフォーマンスの結果を推定するために使用されます。ポイント・フィギュアチャート作成においての最も良いオンラインの資源の一つは、StockChartsです。そのウェブサイトは、株の交換に注力しており、従って、不幸にもForexの証券価格を提供していません。
そのスクリプトの実行結果を比較するために、Gold先物、Light Crude Oil先物、S&P 500 CFDチャートがこのソフトウェアとウェブサイトを使用し生成されます。:EURUSD価格チャートは、Bull's Eye Brokerのみを使用し価格チャートを描くことになります。(StockChatの制限を覚えておいてください。)
ポイント・フィギュアチャートの作成のためのアルゴリズム
こちらにそのアルゴリズムがあります。
ポイント・フィギュアのチャート作成における二つの重要なパラメーターがあります:
- 最小の証券価格の変更を意味するボックスサイズ:最小価格よりも小さい変化は、チャートに影響を与えません。
- リバーサルは、現在のチャートの反対の方向での価格の移動を意味するボックス数であり、新しいカラムにてそのような移動が表示されます。
チャートは、Open-High-Low-Closeの価格の形で格納された見積もりの履歴を必要とするため、以下のように想定します;
- そのチャートは、High-Low価格に基づき描画されます。
- Highの価格は、そのボックスサイズに切り下げられます(MathFloor)、Lowの価格は、ボックスサイズに切り上げられます(MathCeil)
例を紹介します。例えば、Light Crude Oilチャートを$1 (one)に等しいボックスサイズと、3 (three)ボックスリバーサルで描きたいと想定します。これは、すべてのHighの価格は、$1に近い値に切り下げられ、すべてのLowの価格は、同じ方法で切り上げられます:
| Date | High | Low | XO High | XO Low |
|---|---|---|---|---|
| 2012.02.13 | 100.86 | 99.08 | 100 | 100 |
| 2012.02.14 | 101.83 | 100.28 | 101 | 101 |
| 2012.02.15 | 102.53 | 100.62 | 102 | 101 |
| 2012.02.16 | 102.68 | 100.84 | 102 | 101 |
| 2012.02.17 | 103.95 | 102.24 | 103 | 102 |
X's(crosses)は、上向きの価格の動きをチャート上に描画するために使用され、O's (naughts)は、下方への価格の動きを表現します。
価格の初期の動きの方向を決定する方法 (最初のカラムが、XかOか):
XO HighとXO Low [Bars-1] が重要であり、以下になるまで待つ必要があると覚えてください:
- XO High (最初のカラムは О)に比べ、XO Low値は、ボックスのリバーサル数により減少します; もしくは、
- XO High (最初のカラムはО)に比べ、XO High値はボックスのリバーサル数により増加します。
Light Crude Oilの例では、 XO High[Bars-1]=100とXO Low[Bars-1]=100を覚えておきましょう。
そして、何が発生するか待ってみましょう。
- 次のバーのXO Low[i]の値は、$97と同等かそれ以下になり、最初のカラムが Oであることを示します;もしくは、
- 次のバーのXO High[i]の値は、$103に等しいか、それ以上になり、最初のカラムがXであるということを示します。
最初のカラムを2月17日に決定することができ、 XO Highの価格は$103に達し、最初のカラムはXになりました。4つのXを$100から$103で描くことで作成します。
それ以降のチャートの動きの決定
もし現在のカラムがXであれば、現在のバーのXO Highが、XOの価格と比較してボックスサイズにより増加しているかをチェックしてください。(つまり、2月20日に、XO Highが$104に等しいか、同等かをチェックします。)XO High[2012.02.20] が$104か$105か、それ以上であれば、既存のXのカラムに関連するXの数字を追加することができます。
現在のバーのXO Highが、XOの価格と比較してボックスサイズにより増加していなければ、XO Low がボックスのリバーサル数のためにXO Highよりも少ないかをチェックしてください(つまり、XO Low[2012.02.20]$103-3*$1=$100か、$99か、それ以下かチェックします。)もしそれ以下であれば、Oのカラムを$102から$100のXのカラムに描きます。
現在のカラムはOであり、すべて逆の形で適用される場合もあります。
重要: すべてのOの新しいカラムは、Xの先行するカラムのHighの値の右か、それよりも1ボックス下に描かれます。Xのカラムは、Oの先行するカラムのLowの値の右か、それよりも1ボックス上に描かれます。
チャートの作成の規則がこれで明確になりました。補助線と抵抗線に進みます。
便利なポイント・フィギュアチャートの補助線と抵抗線は、常に45度の角度です。
最初の線は、最初のカラムに依存します。もし最初のカラムがXであれば、最初の線は、最初のカラムの最大値よりもワンボックス上からの抵抗線になり、45度下向き、右方向になります。もし最初のカラムがOであれば、最初の線は、最初のカラムの最小値よりもワンボックス下からの補助線になり、45度上向き、右方向になります。補助線と抵抗線は、それらが価格チャートに達するまで描かれます。
補助/抵抗線が価格チャートに達するや否や、抵抗/補助線線を描き始めます。その際に、重要な規則は、描画された線が、チャート上の先行するトレンド線の右にあるということです。補助線を引くためには、まず、抵抗線の下の最小の値を特定し、その補助線を特定された最小値よりワンボックス下から始まり、右斜め上の線を、チャート、もしくはチャートの最後のカラムに達するまで描きます。
もし先行する抵抗線の下の最小値から始まる補助線が上がり、同じ抵抗線の下のチャートにてぶつかれば、右に移動し、抵抗線下の最も低い最小値からて光線の最後までの範囲で新しい最小値を見つけてください。トレンド線が先行するトレンド線を右に超えるまで続けてください。
上記すべては、以下に提示されている実際のチャートの例で描かれていればより明白になると思います。
今のところ、チャートのアルゴリズムは終了しました。いくつかの機能をスクリプトに追加しましょう;
- モードの選択:現在のシンボルでのチャートか、MarketWatch上のすべてのシンボルか
- タイムフレームの選択(Dailyタイムフレームの100ピップスのチャートや、M1に1から3のピップスのチャートを描くことの方がより論理的のように見えます。)
- ピップスによるボックスサイズの設定;
- リバーサルのためのボックス数の設定;
- (MarketDepthインジケーターのように)カラムや列内で取引量を表示するための特性の数の設定(スクリプトでは、本当の取引高を提供すブローカーを見たことはありませんので、ティックの量です)
- チャートが描かれる履歴の深度の設定
- 出力フォーマットの選択 - 結果は、テキストファイルかイメージファイルにて保存されます;
- そして最後に、初心者のための機能 - オートチャート(自動的に、必要なチャートの高さに基づきボックスサイズを設定します)
そのアルゴリズムの詳細と必要条件が紹介されたので、スクリプトで表していきます。
//+------------------------------------------------------------------+ //| Point&Figure text charts | //| BSD Lic. 2012, Roman Rich | //| http://www.FXRays.info | //+------------------------------------------------------------------+ #property copyright "Roman Rich" #property link "http://www.FXRays.info" #property version "1.00" #property script_show_inputs #include "cIntBMP.mqh" // Include the file containing cIntBMP class input bool mw=true; // All MarketWatch? input ENUM_TIMEFRAMES tf=PERIOD_M1; // Time frame input long box=2; // Box size in pips (0 - auto) enum cChoice{c10=10,c25=25,c50=50,c100=100}; input cChoice count=c50; // Chart height in boxes for autocharting enum rChoice{Two=2,Three,Four,Five,Six,Seven}; input rChoice reverse=Five; // Number of boxes for reversal enum vChoice{v10=10,v25=25,v50=50}; input vChoice vd=v10; // Characters for displaying volumes enum dChoice{Little=15000,Middle=50000,Many=100000,Extremely=1000000}; input dChoice depth=Little; // History depth input bool pic=true; // Image file? input int cellsize=10; // Cell size in pixels //+------------------------------------------------------------------+ //| cIntBMP class descendant | //+------------------------------------------------------------------+ class cIntBMPEx : public cIntBMP { public: void Rectangle(int aX1,int aY1,int aSizeX,int aSizeY,int aColor); void Bar(int aX1,int aY1,int aSizeX,int aSizeY,int aColor); void LineH(int aX1,int aY1,int aSizeX,int aColor); void LineV(int aX1,int aY1,int aSizeY,int aColor); void DrawBar(int aX1,int aY1,int aX2,int aY2,int aColor); void TypeTextV(int aX,int aY,string aText,int aColor); }; cIntBMPEx bmp; // cIntBMPEx class instance uchar Mask_O[192]= // The naughts { 217,210,241,111,87,201,124,102,206,165,150,221,237,234,248,255,255,255,255,255,255,255,255,255, 73,42,187,137,117,211,201,192,235,140,120,212,60,27,182,178,165,226,255,255,255,255,255,255, 40,3,174,250,249,253,255,255,255,255,255,255,229,225,245,83,54,190,152,135,216,255,255,255, 68,36,185,229,225,245,255,255,255,255,255,255,255,255,255,247,246,252,78,48,188,201,192,235, 140,120,212,145,126,214,255,255,255,255,255,255,255,255,255,255,255,255,188,177,230,124,102,206, 237,234,248,58,24,181,209,201,238,255,255,255,255,255,255,255,255,255,168,153,222,124,102,206, 255,255,255,199,189,234,63,30,183,186,174,229,247,246,252,204,195,236,60,27,182,204,195,236, 255,255,255,255,255,255,232,228,246,117,93,203,52,18,179,83,54,190,196,186,233,255,255,255 }; uchar Mask_X[192]= // The crosses { 254,252,252,189,51,51,236,195,195,255,255,255,255,255,255,235,192,192,248,234,234,255,255,255, 255,255,255,202,90,90,184,33,33,251,243,243,212,120,120,173,0,0,173,0,0,255,255,255, 255,255,255,254,252,252,195,69,69,192,60,60,178,15,15,233,186,186,253,249,249,255,255,255, 255,255,255,255,255,255,241,210,210,173,0,0,209,111,111,255,255,255,255,255,255,255,255,255, 255,255,255,255,255,255,205,99,99,192,60,60,181,24,24,241,210,210,255,255,255,255,255,255, 255,255,255,249,237,237,176,9,9,241,213,213,226,165,165,189,51,51,254,252,252,255,255,255, 255,255,255,230,177,177,185,36,36,255,255,255,255,255,255,189,51,51,222,153,153,255,255,255, 255,255,255,240,207,207,200,84,84,255,255,255,255,255,255,227,168,168,211,117,117,255,255,255 }; //+------------------------------------------------------------------+ //| Instrument selection | //+------------------------------------------------------------------+ void OnStart() { int mwSymb; string symb; int height=0,width=0; string pnfArray[]; if(mw==true) { mwSymb=0; while(mwSymb<SymbolsTotal(true)) { symb=SymbolName(mwSymb,true); ArrayFree(pnfArray); ArrayResize(pnfArray,0,0); PNF(symb,pnfArray,height,width,pic,cellsize); pnf2file(symb,pnfArray,0,height); mwSymb++; }; } else { symb=Symbol(); ArrayFree(pnfArray); ArrayResize(pnfArray,0,0); PNF(symb,pnfArray,height,width,pic,cellsize); pnf2file(symb,pnfArray,0,height); }; Alert("Ok."); } //+------------------------------------------------------------------+ //| Chart calculation and drawing | //+------------------------------------------------------------------+ void PNF(string sName, // instrument string& array[], // array for the output int& y, // array height int& z, // array width bool toPic, // if true-output and draw int cs) // set the cell size for drawing { string s,ps; datetime d[]; double o[],h[],l[],c[]; long v[]; uchar matrix[]; long VolByPrice[],VolByCol[],HVolumeMax,VVolumeMax; int tMin[],tMax[]; datetime DateByCol[]; MqlDateTime bMDT,eMDT; string strDBC[]; uchar pnf='.'; int sd; int b,i,j,k=0,m=0; int GlobalMin,GlobalMax,StartMin,StartMax,CurMin,CurMax,RevMin,RevMax,ContMin,ContMax; int height,width,beg=0,end=0; double dBox,price; int thBeg=1,thEnd=2,tv=0; uchar trend='.'; // --------------------------------- BMP ----------------------------------------- int RowVolWidth=10*cs; //--- shift for prices int startX=5*cs; int yshift=cs*7; // --------------------------------- BMP ----------------------------------------- if(SymbolInfoInteger(sName,SYMBOL_DIGITS)<=3) sd=2; else sd=4; b=MathMin(Bars(sName,tf),depth); ArrayFree(d); ArrayFree(o); ArrayFree(h); ArrayFree(l); ArrayFree(c); ArrayFree(v); ArrayFree(matrix); ArrayFree(VolByPrice); ArrayFree(VolByCol); ArrayFree(DateByCol); ArrayFree(tMin); ArrayFree(tMax); ArrayResize(d,b,0); ArrayResize(o,b,0); ArrayResize(h,b,0); ArrayResize(l,b,0); ArrayResize(c,b,0); ArrayResize(v,b,0); ArrayInitialize(d,NULL); ArrayInitialize(o,NULL); ArrayInitialize(h,NULL); ArrayInitialize(l,NULL); ArrayInitialize(c,NULL); ArrayInitialize(v,NULL); CopyTime(sName,tf,0,b,d); CopyOpen(sName,tf,0,b,o); CopyHigh(sName,tf,0,b,h); CopyLow(sName,tf,0,b,l); CopyClose(sName,tf,0,b,c); CopyTickVolume(sName,tf,0,b,v); if(box!=0) { dBox=box/MathPow(10.0,(double)sd); } else { dBox=MathNorm((h[ArrayMaximum(h,0,WHOLE_ARRAY)]-l[ArrayMinimum(l,0,WHOLE_ARRAY)])/count, 1/MathPow(10.0,(double)sd),true)/MathPow(10.0,(double)sd); }; GlobalMin=MathNorm(l[ArrayMinimum(l,0,WHOLE_ARRAY)],dBox,true)-(int)(reverse); GlobalMax=MathNorm(h[ArrayMaximum(h,0,WHOLE_ARRAY)],dBox,false)+(int)(reverse); StartMin=MathNorm(l[0],dBox,true); StartMax=MathNorm(h[0],dBox,false); ContMin=(int)(StartMin-1); ContMax=(int)(StartMax+1); RevMin=(int)(StartMax-reverse); RevMax=(int)(StartMin+reverse); height=(int)(GlobalMax-GlobalMin); width=1; ArrayResize(matrix,height*width,0); ArrayInitialize(matrix,'.'); ArrayResize(VolByPrice,height,0); ArrayInitialize(VolByPrice,0); ArrayResize(VolByCol,width,0); ArrayInitialize(VolByCol,0); ArrayResize(DateByCol,width,0); ArrayInitialize(DateByCol,D'01.01.1971'); ArrayResize(tMin,width,0); ArrayInitialize(tMin,0); ArrayResize(tMax,width,0); ArrayInitialize(tMax,0); for(i=1;i<b;i++) { CurMin=MathNorm(l[i],dBox,true); CurMax=MathNorm(h[i],dBox,false); switch(pnf) { case '.': { if(CurMax>=RevMax) { pnf='X'; ContMax=(int)(CurMax+1); RevMin=(int)(CurMax-reverse); beg=(int)(StartMin-GlobalMin-1); end=(int)(CurMax-GlobalMin-1); SetMatrix(matrix,beg,end,height,(int)(width-1),pnf); SetVector(VolByPrice,beg,end,v[i]); VolByCol[width-1]=VolByCol[width-1]+v[i]; DateByCol[width-1]=d[i]; trend='D'; break; }; if(CurMin<=RevMin) { pnf='O'; ContMin=(int)(CurMin-1); RevMax=(int)(CurMin+reverse); beg=(int)(CurMin-GlobalMin-1); end=(int)(StartMax-GlobalMin-1); SetMatrix(matrix,beg,end,height,(int)(width-1),pnf); SetVector(VolByPrice,beg,end,v[i]); VolByCol[width-1]=VolByCol[width-1]+v[i]; DateByCol[width-1]=d[i]; trend='U'; break; }; break; }; case 'X': { if(CurMax>=ContMax) { pnf='X'; ContMax=(int)(CurMax+1); RevMin=(int)(CurMax-reverse); end=(int)(CurMax-GlobalMin-1); SetMatrix(matrix,beg,end,height,(int)(width-1),pnf); SetVector(VolByPrice,beg,end,v[i]); VolByCol[width-1]=VolByCol[width-1]+v[i]; DateByCol[width-1]=d[i]; break; }; if(CurMin<=RevMin) { pnf='O'; ContMin=(int)(CurMin-1); RevMax=(int)(CurMin+reverse); tMin[width-1]=beg-1; tMax[width-1]=end+1; beg=(int)(CurMin-GlobalMin-1); end--; width++; ArrayResize(matrix,height*width,0); ArrayResize(VolByCol,width,0); ArrayResize(DateByCol,width,0); ArrayResize(tMin,width,0); ArrayResize(tMax,width,0); SetMatrix(matrix,0,(int)(height-1),height,(int)(width-1),'.'); SetMatrix(matrix,beg,end,height,(int)(width-1),pnf); SetVector(VolByPrice,beg,end,v[i]); VolByCol[width-1]=0; VolByCol[width-1]=VolByCol[width-1]+v[i]; DateByCol[width-1]=d[i]; tMin[width-1]=beg-1; tMax[width-1]=end+1; break; }; break; }; case 'O': { if(CurMin<=ContMin) { pnf='O'; ContMin=(int)(CurMin-1); RevMax=(int)(CurMin+reverse); beg=(int)(CurMin-GlobalMin-1); SetMatrix(matrix,beg,end,height,(int)(width-1),pnf); SetVector(VolByPrice,beg,end,v[i]); VolByCol[width-1]=VolByCol[width-1]+v[i]; DateByCol[width-1]=d[i]; break; }; if(CurMax>=RevMax) { pnf='X'; ContMax=(int)(CurMax+1); RevMin=(int)(CurMax-reverse); tMin[width-1]=beg-1; tMax[width-1]=end+1; beg++; end=(int)(CurMax-GlobalMin-1); width++; ArrayResize(matrix,height*width,0); ArrayResize(VolByCol,width,0); ArrayResize(DateByCol,width,0); ArrayResize(tMin,width,0); ArrayResize(tMax,width,0); SetMatrix(matrix,0,(int)(height-1),height,(int)(width-1),'.'); SetMatrix(matrix,beg,end,height,(int)(width-1),pnf); SetVector(VolByPrice,beg,end,v[i]); VolByCol[width-1]=0; VolByCol[width-1]=VolByCol[width-1]+v[i]; DateByCol[width-1]=d[i]; tMin[width-1]=beg-1; tMax[width-1]=end+1; break; }; break; }; }; }; //--- credits s="BSD License, 2012, FXRays.info by Roman Rich"; k++; ArrayResize(array,k,0); array[k-1]=s; s=SymbolInfoString(sName,SYMBOL_DESCRIPTION)+", Box-"+DoubleToString(box,0)+",Reverse-"+DoubleToString(reverse,0); k++; ArrayResize(array,k,0); array[k-1]=s; // --------------------------------- BMP ----------------------------------------- if(toPic==true) { //-- BMP image size on the chart display int XSize=cs*width+2*startX+RowVolWidth; int YSize=cs*height+yshift+70; //-- creating a bmp image sized XSize x YSize with the background color clrWhite bmp.Create(XSize,YSize,clrWhite); //-- displaying cells of the main field for(i=height-1;i>=0;i--) for(j=0;j<=width-1;j++) { bmp.Bar(RowVolWidth+startX+cs*j,yshift+cs*i,cs,cs,clrWhite); bmp.Rectangle(RowVolWidth+startX+cs*j,yshift+cs*i,cs,cs,clrLightGray); } bmp.TypeText(10,yshift+cs*(height)+50,array[k-2],clrDarkGray); bmp.TypeText(10,yshift+cs*(height)+35,array[k-1],clrGray); } // --------------------------------- BMP ----------------------------------------- //--- calculating trend lines i=0; while(thEnd<width-1) { while(thBeg+i<thEnd) { if(trend=='U') { i=ArrayMinimum(tMin,thBeg,thEnd-thBeg); j=tMin[i]; } else { i=ArrayMaximum(tMax,thBeg,thEnd-thBeg); j=tMax[i]; } thBeg=i; tv=j; i=0; while(GetMatrix(matrix,j,height,(long)(thBeg+i))=='.') { i++; if(trend=='U') j++; else j--; if(thBeg+i==width-1) { thEnd=width-1; break; }; }; if(thBeg+i<thEnd) { thBeg=thBeg+2; i=0; }; }; thEnd=thBeg+i; if(thEnd==thBeg) thEnd++; for(i=thBeg;i<thEnd;i++) { SetMatrix(matrix,tv,tv,height,(long)(i),'+'); // --------------------------------- BMP ----------------------------------------- if(toPic==true) { //--- support and resistance lines if(trend=='U') { bmp.DrawLine(RowVolWidth+startX+i*cs,yshift+tv*cs, RowVolWidth+startX+(i+1)*cs,yshift+(tv+1)*cs,clrGreen); } if(trend=='D') { bmp.DrawLine(RowVolWidth+startX+i*cs,yshift+(tv+1)*cs, RowVolWidth+startX+(i+1)*cs,yshift+(tv)*cs,clrRed); } //--- broadening of support/resistance lines if(trend=='U') { bmp.DrawLine(RowVolWidth+1+startX+i*cs,yshift+tv*cs, RowVolWidth+1+startX+(i+1)*cs,yshift+(tv+1)*cs,clrGreen); } if(trend=='D') { bmp.DrawLine(RowVolWidth+1+startX+i*cs,yshift+(tv+1)*cs, RowVolWidth+1+startX+(i+1)*cs,yshift+(tv)*cs,clrRed); } } // --------------------------------- BMP ----------------------------------------- if(trend=='U') tv++; else tv--; }; if(trend=='U') trend='D'; else trend='U'; i=0; }; //--- displaying data in columns ArrayResize(strDBC,width,0); TimeToStruct(DateByCol[0],bMDT); TimeToStruct(DateByCol[width-1],eMDT); if((DateByCol[width-1]-DateByCol[0])>=50000000) { for(i=0;i<=width-1;i++) StringInit(strDBC[i],4,' '); for(i=1;i<=width-1;i++) { TimeToStruct(DateByCol[i-1],bMDT); TimeToStruct(DateByCol[i],eMDT); if(bMDT.year!=eMDT.year) strDBC[i]=DoubleToString(eMDT.year,0); }; for(i=0;i<=3;i++) { StringInit(s,vd,' '); s=s+" : "; for(j=0;j<=width-1;j++) s=s+StringSubstr(strDBC[j],i,1); s=s+" : "; k++; ArrayResize(array,k,0); array[k-1]=s; }; } else { if((DateByCol[width-1]-DateByCol[0])>=5000000) { for(i=0;i<=width-1;i++) StringInit(strDBC[i],7,' '); for(i=1;i<=width-1;i++) { TimeToStruct(DateByCol[i-1],bMDT); TimeToStruct(DateByCol[i],eMDT); if(bMDT.mon!=eMDT.mon) { if(eMDT.mon<10) strDBC[i]=DoubleToString(eMDT.year,0)+".0"+DoubleToString(eMDT.mon,0); if(eMDT.mon>=10) strDBC[i]=DoubleToString(eMDT.year,0)+"."+DoubleToString(eMDT.mon,0); } }; for(i=0;i<=6;i++) { StringInit(s,vd,' '); s=s+" : "; for(j=0;j<=width-1;j++) s=s+StringSubstr(strDBC[j],i,1); s=s+" : "; k++; ArrayResize(array,k,0); array[k-1]=s; }; } else { for(i=0;i<=width-1;i++) StringInit(strDBC[i],10,' '); for(i=1;i<=width-1;i++) { TimeToStruct(DateByCol[i-1],bMDT); TimeToStruct(DateByCol[i],eMDT); if(bMDT.day!=eMDT.day) { if(eMDT.mon<10 && eMDT.day<10) strDBC[i]=DoubleToString(eMDT.year,0)+".0" +DoubleToString(eMDT.mon,0)+".0"+DoubleToString(eMDT.day,0); if(eMDT.mon<10 && eMDT.day>=10) strDBC[i]=DoubleToString(eMDT.year,0)+".0" +DoubleToString(eMDT.mon,0)+"."+DoubleToString(eMDT.day,0); if(eMDT.mon>=10&&eMDT.day< 10) strDBC[i]=DoubleToString(eMDT.year,0)+"." +DoubleToString(eMDT.mon,0)+".0"+DoubleToString(eMDT.day,0); if(eMDT.mon>=10&&eMDT.day>=10) strDBC[i]=DoubleToString(eMDT.year,0)+"." +DoubleToString(eMDT.mon,0)+"." +DoubleToString(eMDT.day,0); } }; for(i=0;i<=9;i++) { StringInit(s,vd,' '); s=s+" : "; for(j=0;j<=width-1;j++) s=s+StringSubstr(strDBC[j],i,1); s=s+" : "; k++; ArrayResize(array,k,0); array[k-1]=s; }; }; }; StringInit(s,25+vd+width,'-'); k++; ArrayResize(array,k,0); array[k-1]=s; //--- displaying price chart price=GlobalMax*dBox; HVolumeMax=VolByPrice[ArrayMaximum(VolByPrice,0,WHOLE_ARRAY)]; s=""; for(i=height-1;i>=0;i--) { StringInit(ps,8-StringLen(DoubleToString(price,sd)),' '); s=s+ps+DoubleToString(price,sd)+" : "; for(j=0;j<vd;j++) if(VolByPrice[i]>HVolumeMax*j/vd) s=s+"*"; else s=s+" "; s=s+" : "; for(j=0;j<=width-1;j++) s=s+CharToString(matrix[j*height+i]); s=s+" : "+ps+DoubleToString(price,sd); k++; ArrayResize(array,k,0); array[k-1]=s; s=""; price=price-dBox; }; StringInit(s,25+vd+width,'-'); k++; ArrayResize(array,k,0); array[k-1]=s; //--- simple markup through 10 StringInit(s,vd,' '); s=s+" : "; for(j=0;j<=width-1;j++) if(StringGetCharacter(DoubleToString(j,0), StringLen(DoubleToString(j,0))-1)==57) s=s+"|"; else s=s+" "; s=s+" : "; k++; ArrayResize(array,k,0); array[k-1]=s; //--- displaying volume chart in columns VVolumeMax=VolByCol[ArrayMaximum(VolByCol,0,WHOLE_ARRAY)]; for(i=vd-1;i>=0;i--) { StringInit(s,vd,' '); s=s+" : "; for(j=0;j<=width-1;j++) if(VolByCol[j]>VVolumeMax*i/vd) s=s+"*"; else s=s+" "; s=s+" : "; k++; ArrayResize(array,k,0); array[k-1]=s; }; StringInit(s,25+vd+width,'-'); k++; ArrayResize(array,k,0); array[k-1]=s; //--- column history s=" | Start Date/Time | End Date/Time | "; k++; ArrayResize(array,k,0); array[k-1]=s; TimeToStruct(DateByCol[0],bMDT); s=" 1 | 0000/00/00 00:00:00 | "; s=s+DoubleToString(bMDT.year,0)+"/"; if(bMDT.mon >=10) s=s+DoubleToString(bMDT.mon ,0)+"/"; else s=s+"0"+DoubleToString(bMDT.mon ,0)+"/"; if(bMDT.day >=10) s=s+DoubleToString(bMDT.day ,0)+" "; else s=s+"0"+DoubleToString(bMDT.day ,0)+" "; if(bMDT.hour>=10) s=s+DoubleToString(bMDT.hour,0)+":"; else s=s+"0"+DoubleToString(bMDT.hour,0)+":"; if(bMDT.min >=10) s=s+DoubleToString(bMDT.min ,0)+":"; else s=s+"0"+DoubleToString(bMDT.min ,0)+":"; if(bMDT.sec >=10) s=s+DoubleToString(bMDT.sec ,0)+" | "; else s=s+"0"+DoubleToString(bMDT.sec ,0)+" | "; k++; ArrayResize(array,k,0); array[k-1]=s; for(i=1;i<=width-1;i++) { TimeToStruct(DateByCol[i-1],bMDT); TimeToStruct(DateByCol[i],eMDT); s=""; StringInit(ps,4-StringLen(DoubleToString(i+1,0)),' '); s=s+ps+DoubleToString(i+1,0)+" | "; s=s+DoubleToString(bMDT.year,0)+"/"; if(bMDT.mon >=10) s=s+DoubleToString(bMDT.mon ,0)+"/"; else s=s+"0"+DoubleToString(bMDT.mon ,0)+"/"; if(bMDT.day >=10) s=s+DoubleToString(bMDT.day ,0)+" "; else s=s+"0"+DoubleToString(bMDT.day ,0)+" "; if(bMDT.hour>=10) s=s+DoubleToString(bMDT.hour,0)+":"; else s=s+"0"+DoubleToString(bMDT.hour,0)+":"; if(bMDT.min >=10) s=s+DoubleToString(bMDT.min ,0)+":"; else s=s+"0"+DoubleToString(bMDT.min ,0)+":"; if(bMDT.sec >=10) s=s+DoubleToString(bMDT.sec ,0)+" | "; else s=s+"0"+DoubleToString(bMDT.sec ,0)+" | "; s=s+DoubleToString(eMDT.year,0)+"/"; if(eMDT.mon >=10) s=s+DoubleToString(eMDT.mon ,0)+"/"; else s=s+"0"+DoubleToString(eMDT.mon ,0)+"/"; if(eMDT.day >=10) s=s+DoubleToString(eMDT.day ,0)+" "; else s=s+"0"+DoubleToString(eMDT.day ,0)+" "; if(eMDT.hour>=10) s=s+DoubleToString(eMDT.hour,0)+":"; else s=s+"0"+DoubleToString(eMDT.hour,0)+":"; if(eMDT.min >=10) s=s+DoubleToString(eMDT.min ,0)+":"; else s=s+"0"+DoubleToString(eMDT.min ,0)+":"; if(eMDT.sec >=10) s=s+DoubleToString(eMDT.sec ,0)+" | "; else s=s+"0"+DoubleToString(eMDT.sec ,0)+" | "; k++; ArrayResize(array,k,0); array[k-1]=s; }; y=k; z=25+vd+width; // --------------------------------- BMP ----------------------------------------- if(toPic==true) { //--- displaying dates in YYYY/MM/DD format for(j=0;j<=width-1;j++) { string s0=strDBC[j]; StringReplace(s0,".","/"); bmp.TypeTextV(RowVolWidth+startX+cs*j,yshift+cs*(height-1)+5,s0,clrDimGray); } //--- volume cell support for(i=height-1;i>=0;i--) for(j=0;j<vd;j++) { bmp.Bar(cs+startX+cs*(j-1),yshift+cs*i,cs,cs,0xF6F6F6); bmp.Rectangle(cs+startX+cs*(j-1),yshift+cs*i,cs,cs,clrLightGray); } for(i=0; i>-7;i--) for(j=0;j<=vd;j++) { bmp.Bar(cs+startX+cs*(j-1),yshift+cs*i,cs,cs,clrWhite); bmp.Rectangle(cs+startX+cs*(j-1),yshift+cs*i,cs,cs,clrLightGray); } //--- exact volumes for(i=height-1;i>=0;i--) bmp.Bar(startX,yshift+cs*i,int(10*cs*VolByPrice[i]/HVolumeMax),cs,0xB5ABAB); //--- displaying naughts and crosses for(i=height-1;i>=0;i--) for(j=0;j<=width-1;j++) { int xpos=RowVolWidth+startX+cs*j+1; int ypos=yshift+cs*i+1; if(CharToString(matrix[j*height+i])=="X") ShowCell(xpos,ypos,'X'); else if(CharToString(matrix[j*height+i])=="O") ShowCell(xpos,ypos,'O'); } //--- volume underside support for(i=0;i<=60/cs;i++) for(j=0;j<=width-1;j++) { bmp.Bar(RowVolWidth+startX+cs*j,12+cs*i,cs,cs,0xF6F6F6); bmp.Rectangle(RowVolWidth+startX+cs*j,12+cs*i,cs,cs,clrLightGray); } //--- displaying volumes for(j=0;j<=width-1;j++) bmp.Bar(RowVolWidth+startX+cs*j,yshift-60, cs,int(60*VolByCol[j]/VVolumeMax),0xB5ABAB); //--- displaying the main field border bmp.Rectangle(RowVolWidth+startX+cs*0,yshift+cs*0,cs*(width),cs*(height),clrSilver); //--- displaying prices and scale bmp.LineV(startX,yshift,cs*height,clrBlack); bmp.LineV(RowVolWidth+startX+cs*width,yshift,cs*height,clrBlack); price=GlobalMax*dBox; for(i=height-1;i>=0;i--) { //-- prices on the left bmp.TypeText(cs,yshift+cs*i,DoubleToString(price,sd),clrBlack); bmp.LineH(0,yshift+cs*i,startX,clrLightGray); bmp.LineH(0+startX-3,yshift+cs*i,6,clrBlack); //-- prices on the right int dx=RowVolWidth+cs*width; bmp.TypeText(10+startX+dx,yshift+cs*i,DoubleToString(price,sd),clrBlack); bmp.LineH(startX+dx,yshift+cs*i,40,clrLightGray); bmp.LineH(startX+dx-3,yshift+cs*i,6,clrBlack); price=price-dBox; } //-- saving the resulting image in a file bmp.Save(sName,true); } // --------------------------------- BMP ----------------------------------------- } //+------------------------------------------------------------------+ //|Outputting as a text file | //+------------------------------------------------------------------+ void pnf2file(string sName, // instrument for the file name string& array[], // array of lines saved in the file int beg, // the line of the array first saved in the file int end) // the line of the array last saved in the file { string fn; int handle; fn=sName+"_b"+DoubleToString(box,0)+"_r"+DoubleToString(reverse,0)+".txt"; handle=FileOpen(fn,FILE_WRITE|FILE_TXT|FILE_ANSI,';'); for(int i=beg;i<end;i++) FileWrite(handle,array[i]); FileClose(handle); } //+------------------------------------------------------------------+ //| Adjusting the price to the box size | //+------------------------------------------------------------------+ int MathNorm(double value, // transforming any double-type figure into long-type figure double prec, // ensuring the necessary accuracy bool vect) // and if true, rounding up; if false, rounding down { if(vect==true) return((int)(MathCeil(value/prec))); else return((int)(MathFloor(value/prec))); } //+------------------------------------------------------------------+ //| Filling the array | //| Character one-dimensional array represented as a matrix | //+------------------------------------------------------------------+ void SetMatrix(uchar& array[], // passing the array in a link to effect a replacement long pbeg, // from here long pend, // up to here long pheight, // in the column of this height long pwidth, // bearing this number among all the columns in the array uchar ppnf) // with this character { long offset=0; for(offset=pheight*pwidth+pbeg;offset<=pheight*pwidth+pend;offset++) array[(int)offset]=ppnf; } //+------------------------------------------------------------------+ //| Getting an isolated value from the array | //| Character one-dimensional array represented as a matrix | //+------------------------------------------------------------------+ uchar GetMatrix(uchar& array[], // passing it in a link to obtain a character... long pbeg, // here long pheight, // in the column of this height long pwidth) // bearing this number among all the columns in the array { return(array[(int)pheight*(int)pwidth+(int)pbeg]); } //+------------------------------------------------------------------+ //|Filling the vector | //+------------------------------------------------------------------+ void SetVector(long &array[], // passing the long-type array in a link to effect a replacement long pbeg, // from here long pend, // up to here long pv) // with this value { long offset=0; for(offset=pbeg;offset<=pend;offset++) array[(int)offset]=array[(int)offset]+pv; } //+------------------------------------------------------------------+ //| Displaying a horizontal line | //+------------------------------------------------------------------+ void cIntBMPEx::LineH(int aX1,int aY1,int aSizeX,int aColor) { DrawLine(aX1,aY1,aX1+aSizeX,aY1,aColor); } //+------------------------------------------------------------------+ //| Displaying a vertical line | //+------------------------------------------------------------------+ void cIntBMPEx::LineV(int aX1,int aY1,int aSizeY,int aColor) { DrawLine(aX1,aY1,aX1,aY1+aSizeY,aColor); } //+------------------------------------------------------------------+ //| Drawing a rectangle (of a given size) | //+------------------------------------------------------------------+ void cIntBMPEx::Rectangle(int aX1,int aY1,int aSizeX,int aSizeY,int aColor) { DrawRectangle(aX1,aY1,aX1+aSizeX,aY1+aSizeY,aColor); } //+------------------------------------------------------------------+ //| Drawing a filled rectangle (of a given size) | //+------------------------------------------------------------------+ void cIntBMPEx::Bar(int aX1,int aY1,int aSizeX,int aSizeY,int aColor) { DrawBar(aX1,aY1,aX1+aSizeX,aY1+aSizeY,aColor); } //+------------------------------------------------------------------+ //| Drawing a filled rectangle | //+------------------------------------------------------------------+ void cIntBMPEx::DrawBar(int aX1,int aY1,int aX2,int aY2,int aColor) { for(int i=aX1; i<=aX2; i++) for(int j=aY1; j<=aY2; j++) { DrawDot(i,j,aColor); } } //+------------------------------------------------------------------+ //| Displaying the text vertically | //+------------------------------------------------------------------+ void cIntBMPEx::TypeTextV(int aX,int aY,string aText,int aColor) { SetDrawWidth(1); for(int j=0;j<StringLen(aText);j++) { string TypeChar=StringSubstr(aText,j,1); if(TypeChar==" ") { aY+=5; } else { int Pointer=0; for(int i=0;i<ArraySize(CA);i++) { if(CA[i]==TypeChar) { Pointer=i; } } for(int i=PA[Pointer];i<PA[Pointer+1];i++) { DrawDot(aX+YA[i],aY+MaxHeight+XA[i],aColor); } aY+=WA[Pointer]+1; } } } //+------------------------------------------------------------------+ //| Transforming components into color | //+------------------------------------------------------------------+ int RGB256(int aR,int aG,int aB) { return(aR+256*aG+65536*aB); } //+------------------------------------------------------------------+ //| Drawing X's or O's as an image | //+------------------------------------------------------------------+ void ShowCell(int x,int y,uchar img) { uchar r,g,b; for(int i=0; i<8; i++) { for(int j=0; j<8; j++) { switch(img) { case 'X': r=Mask_X[3*(j*8+i)]; g=Mask_X[3*(j*8+i)+1]; b=Mask_X[3*(j*8+i)+2]; break; case 'O': r=Mask_O[3*(j*8+i)]; g=Mask_O[3*(j*8+i)+1]; b=Mask_O[3*(j*8+i)+2]; break; }; int col=RGB256(r,g,b); bmp.DrawDot(x+i,y+j,col); } } } //+------------------------------------------------------------------+
入力パラメーターpicの値に応じて、そのスクリプトの結果は写真付きのテキストファイルの形式(terminal_data_directory\MQL5\Imagesへ保存される) にて作成されるか、 テキストファイルのみで( terminal_data_directory\MQL5\Filesにて保存される)作成されます。
結果の比較
結果を比較するために、Light Crude Oilチャートを以下のパラメーターで作成しましょう;ボックスサイズが$1、リバーサルが3ボックスです。
StockCharts.com:
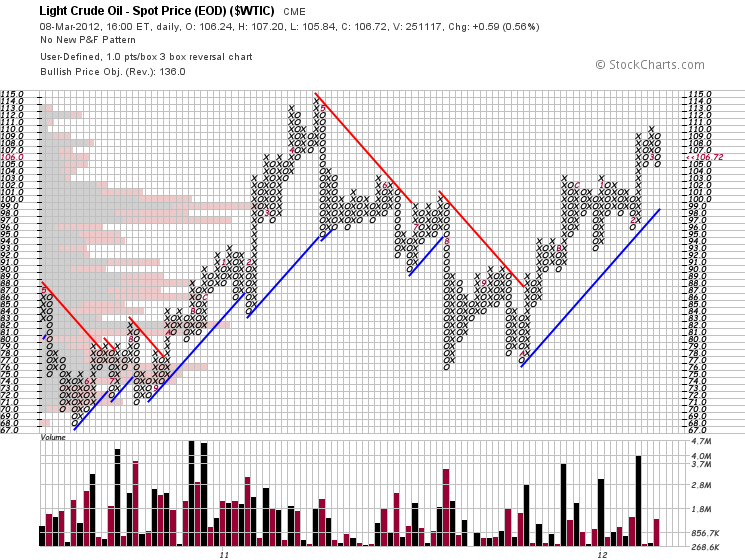
図1. StockCharts.comにより生成されたLight Crude Oilのポイント・フィギュアチャート
Bull's-Eye Broker:
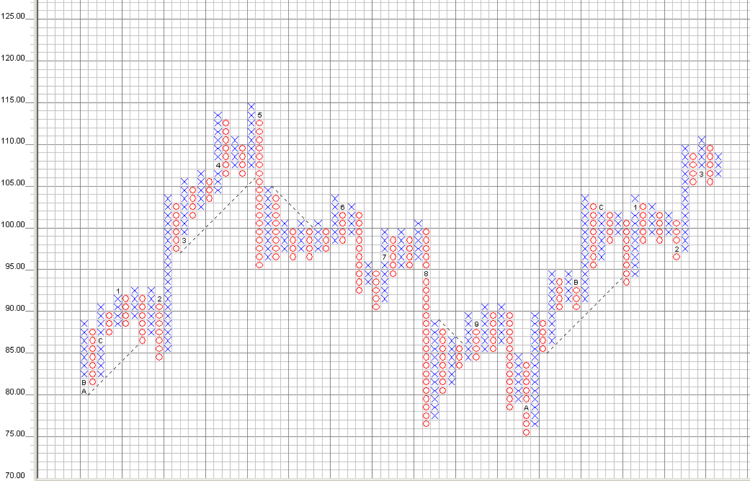
図2. Bull's-Eye Brokerソフトウェアにより生成されたLight Crude Oilのポイント・フィギュアチャート
私たちの作成したスクリプトの結果:
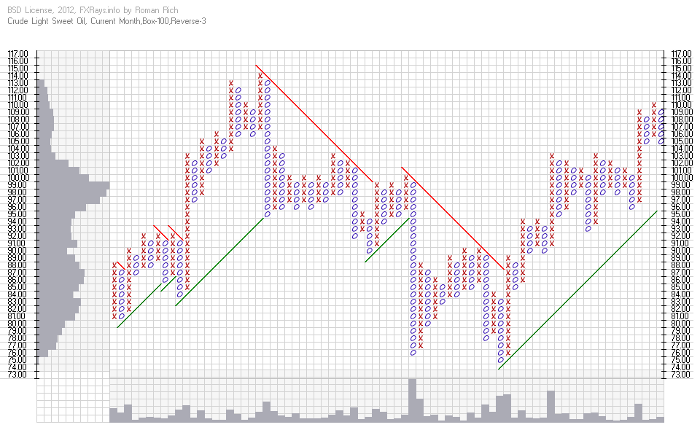
図3. 私たちのスクリプトにより生成されたLight Crude Oilのポイント・フィギュアチャート
これらすべてのチャートは同一です。おめでとうございます!ポイント・フィギュアチャートを理解できました。
典型的ポイント・フィギュアチャートのパターン
どのように使用されるのでしょうか?
典型的なパターンを見てみましょう
これらが典型的なパターンです:
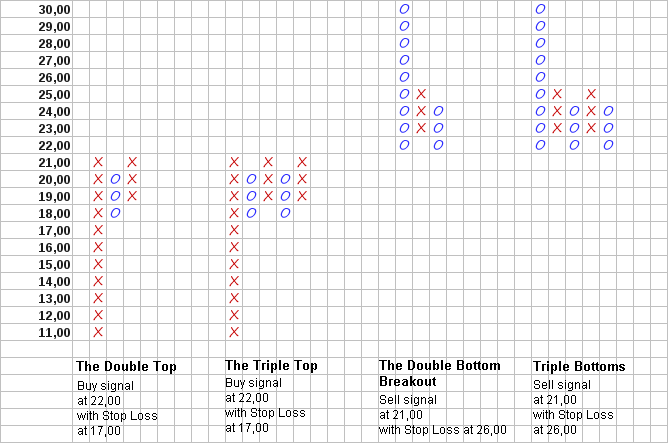
図4. 価格のパターン: ダブルトップ・トリプルトップ・ダブルボトムブレークアウト・トリプルボトム
さらに;
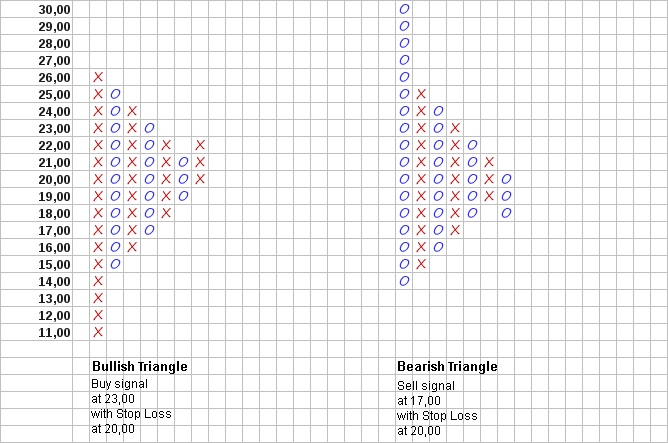
図5. 価格のパターン:上がり気味のトライアングル・下がり気味のトライアングル
そして最後;
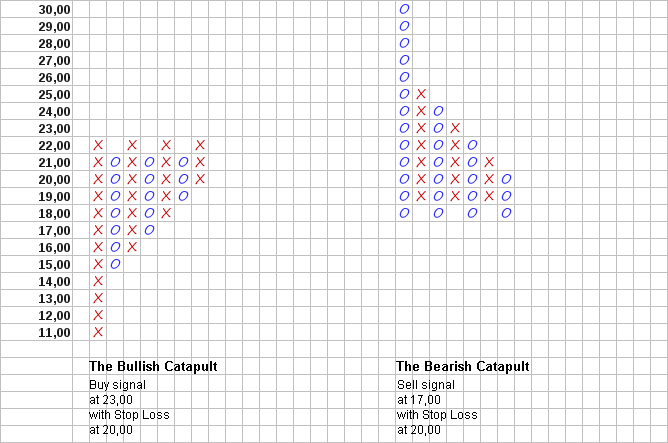
図6. 価格のパターン:上がり気味のカタパルト・下がり気味のカタパルト
そして、いくつかのコツがあります。
- 補助線の上のロングポジションと抵抗線下のショートポジションのみのみオープンしてください。例えば、2011年12月の中旬から始め、2011年の9月の最後から形成している抵抗線を突破したのちに、Light Crude Oilの先物のロングポジションのみをオープンしてください。
- トレーリングストップロス注文のために補助線と抵抗線を使用してください。
- 可能な利益と損失間の比率を推定するためにポジションをオープンにする前に垂直のカウントを使用してください。
垂直のカウントは、以下の例により紹介されています。
2011年12月に、 X'sのカラムは初期値$76$か先行するXのカラム$85を超えて上昇し、$87の抵抗線を突破し、$89に達しました。垂直カウントによると、これは、価格が上昇し、 $76+($89-$75)*3 (3 box reversal)=$118のレベルに達したということを示します。
その次の動きは、価格を$85のレベルまで戻す動きです。投機家は、ロングポジションにストップロス注文を$1少ない$84にて行います。
そのロングポジションへのエントリは、先行するXのカラムよりもワンボックス高い、すなわち、$90での訂正の動きののちに計画することができます。
可能な損失を推定しましょう - 一件の先物契約につき$90-$84=$6に達します。可能な利益は、$118-$90=$28に達します。可能な利益と損失の比率: $28/$6>4.5 よい出来だと思います。今のところ、利益は一つの先物契約につき、$105-$90=$15だったでしょう。
ライセンス
そのスクリプトは、BSDライセンスの下、Roman Richにより記述され、提供されています。そのライセンス文は、Lictxtファイルにて見つけることができます。cIntBMP ライブラリは Integer、つまり、Dmitryにより作成されています。StockCharts.comとBull's-Eye Brokerの商標は、それぞれの所有者の資産です。
結論
この記事は、ポイント・フィギュアチャートのスクリプトとアルゴリズムを紹介しました。(「3目並べ」)記されている推奨にて、記載されている実用的な使用方法の様々な価格パターンを考察しました。
MetaQuotes Ltdによってロシア語から翻訳されました。
元の記事: https://www.mql5.com/ru/articles/368
警告: これらの資料についてのすべての権利はMetaQuotes Ltd.が保有しています。これらの資料の全部または一部の複製や再プリントは禁じられています。
この記事はサイトのユーザーによって執筆されたものであり、著者の個人的な見解を反映しています。MetaQuotes Ltdは、提示された情報の正確性や、記載されているソリューション、戦略、または推奨事項の使用によって生じたいかなる結果についても責任を負いません。
 MQL5 コードの保護:パスワード保護、キージェネレータ、時間制限、リモートライセンス、高度 EA ライセンスキー暗号化技術
 AutoElliottWaveMaker - Elliott Wavesの半自動分析のためのMetaTrader 5ツール
 トレーダミネーター 3:売買ロボットの台頭
 MetaTrader 5とMQL5の提供する限りのない機会
- 無料取引アプリ
- 8千を超えるシグナルをコピー
- 金融ニュースで金融マーケットを探索
私の記憶が間違っていなければ、レナートは先日そのようなことを発表した。
もうすでに制作中なんだ。
まず、動的にビットマップを作成し、グラフィカル・オブジェクトにバインドする簡単な方法を作り、次にビットマップへの描画の標準関数を作る。必要であれば、標準機能なしでもバッファに描画できるようにする。
取引、自動取引システム、取引戦略のテストに関するフォーラム
インジケーターポイント・アンド・フィギュア
ニューデジタル, 2013.09.12 16:29
ポイント&フィギュア・チャート
ポイント&フィギュア・チャートは、チャート上の時間の重要性を減らし、代わりに価格の動きに焦点を当てます。ポイント&フィギュア・チャートはXとOで構成され、Xは新高値、Oは新安値です。ポイント・アンド・フィギュア・チャートには2つのインプットがあります:
ポイント・アンド・フィギュア・チャートの主な用途のひとつで、このセクションで強調されているのは、ポイント・アンド・フィギュア・チャートによって、トレーダーが古典的なチャート・パターンを見やすくなるということです。下のE-ミニS&P500フューチャーのチャートでは、ポイント&フィギュア・チャートはサポート・ラインとレジスタンス・ライン、そして価格ブレイクアウトのエリアを強調している:
ここでも、ポイント&フィギュア・チャートは、EミニS&P500先物のチャートにおけるダブルボトム・パターンをトレーダーに見やすくしている:
上のE-miniチャートは、ダブルボトムパターンの2つのボトムと、突き抜けた確認ラインを示し、結果として買いの機会をもたらしている。
ポイント&フィギュアは、マーケットアクションをプロットする非常にユニークな方法です。ポイント&フィギュア・チャートの特長は、時間の要素を排除し、真に重要なもの、すなわち価格に焦点を当てることです。lic.txt (1.35 KB)
これらのインジケータや他のインジケータをMT5で使用する方法を教えてください。
恐らく間違った場所に挿入してしまったのでしょう。
こんにちは
また、チャートに表示できないのですが、何が問題なのでしょうか?
ハイ
また、チャートに表示できないのですが、何が問題なのでしょうか?