Moving average crossover scanner MT5
- Indicatori
-
Jan Flodin
 Hello, my name is Jan and I have been developing automated trading tools for the last 9 years. I am originally from Sweden but have lived in the Czech Republic since 2003.
PRODUCTS - Versione: 2.2
- Aggiornato: 4 dicembre 2024
- Attivazioni: 10
I recommend you to read the product's blog (manual) from start to end so that it is clear from the beginning what the indicactor offers.
This multi time frame and multi symbol indicator can identify the following 5 crosses:
- when a fast moving average crosses a slow moving average line.
- when price has reached a single moving average (closed above/below or just bounced).
- when a triple moving average formation has appeared (all 3 MA:s in consecutive alignment)
- when the MACD main line crosses the signal line.
- when the signal line crosses the MACD zero(0) line.
Combined with your own rules and techniques, this indicator will allow you to create (or enhance) your own powerful system.
Features
- Can monitor selected symbols visible in your Market Watch window at the same time. Apply the indicator to just one chart and instantly monitor the entire market.
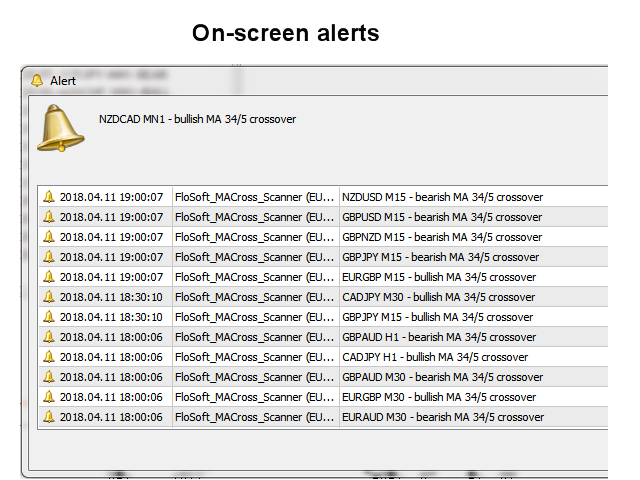
- Can monitor every time frame, from M1 to MN, and sends you a real-time alert when a crossover has been identified. All alert types are supported.
- The indicator can also be used in single chart mode.
- Can use RSI as an additional trend filter.
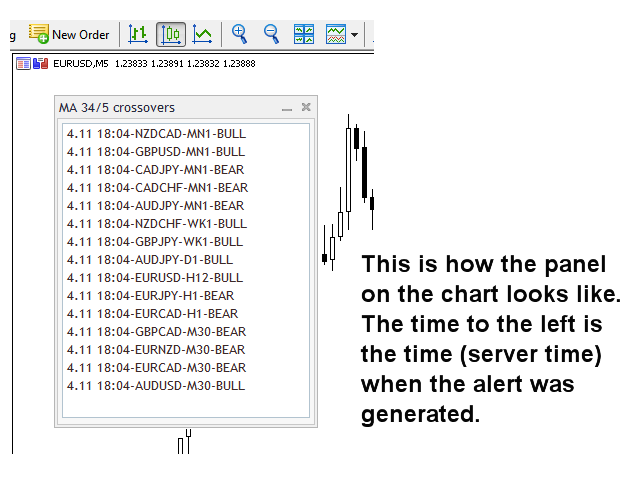
- The indicator includes an interactive panel. When clicking on an item, a new chart will be opened with the symbol and time frame in question.
- The indicator can write the signals to a file or to global variables which can be used by an Expert Advisor for auto trading.
Input parameters
Please find the description and explanation of the input parameters here.
Important
Please note that due to the multi-time frame functionality neither buy/sell advice nor MA lines will be drawn on the chart where the indicator has been installed. I strongly recommend to put the indicator on a clean (empty) chart without any other indicators on it which could interfere with the scanner. 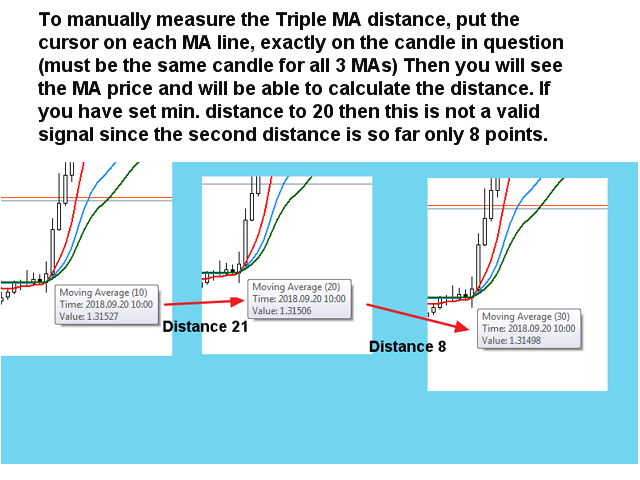


Hello, It's been a while since I bought the indicator to test it. I'm very happy! This is exactly what I expected. I work on two computers, what are the conditions for installing it on the second one? Congratulations, the scanner is very good !!!!!!!!!