RBM Watermarkgrid
- Utilità
-
Renato Brendim Medici
 RBM Trader is an Economist and Global Trader, specialized in FX, Derivatives and Equity. Creator of the Reverse Setup and the GFT method.
Author of the book "Macroeconomics for Traders," connecting macroeconomics, geopolitics and financial markets in a practical, straight-to-the-point way. - Versione: 1.0
RBM Watermark Grid - MQL5 Market Description RBM Watermark Grid
A transparent symbol watermark plus a clean, wide-spaced grid for your MetaTrader 5 charts.
Overview
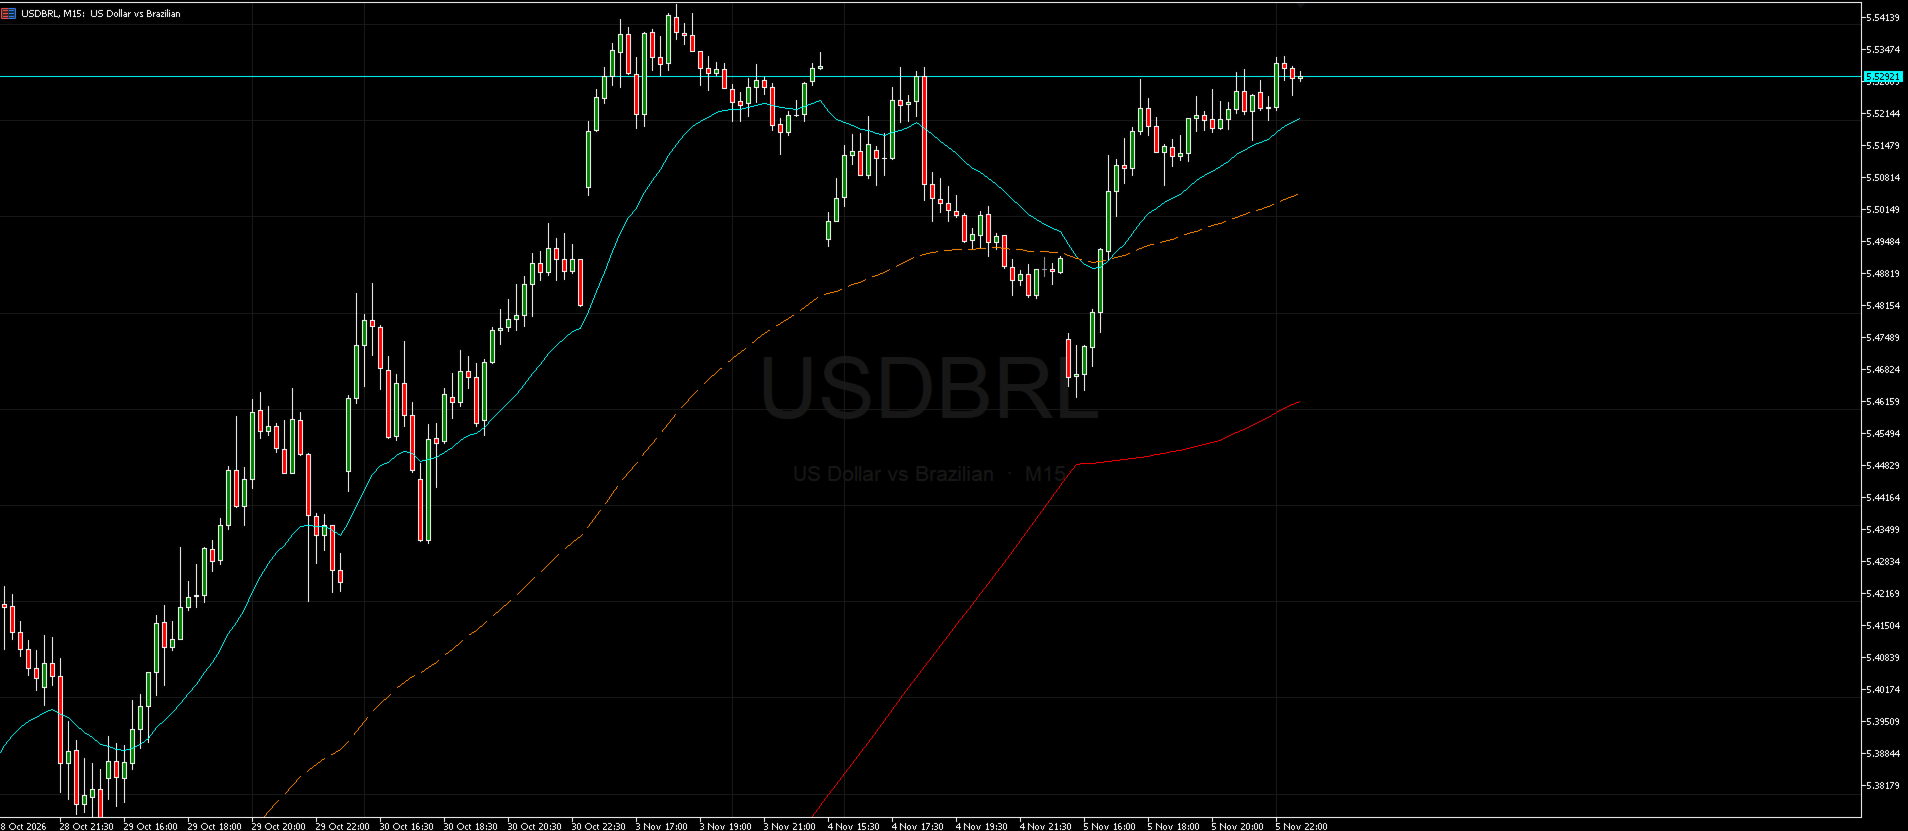
RBM Watermark Grid gives your chart a cleaner, more professional look. It shows the symbol name (and optionally the symbol description and timeframe) as a subtle watermark in the center of the chart, and replaces the default MT5 grid with a softer, more open grid that has fewer lines and does not clutter your candles.
Key features
- Symbol watermark (e.g. EURUSD) in the center of the chart, drawn behind the candles.
- Adjustable transparency: set the opacity from 0 to 100% to keep the watermark discreet.
- Optional secondary text: symbol description and timeframe (e.g. Euro vs US Dollar · H1).
- Custom open grid: horizontal lines at round price levels and vertical lines evenly spaced in time.
- Automatic adjustment when you zoom, scroll or resize the chart.
- Optional dark theme: ready-made background and candle colors, which you can turn off at any time.
- Works on any symbol and timeframe. Lightweight: no buffers and no plots.
Input parameters
| Group | Parameter | Description |
|---|---|---|
| Watermark | Show watermark | Turns the watermark on/off |
| Watermark | Font / Sizes | Font and size of the symbol name and the secondary text |
| Watermark | Color / Opacity (%) | Watermark color and transparency level (lower = more transparent) |
| Watermark | Show timeframe / description | Displays the period and the symbol description |
| Grid | Show custom grid | Turns the indicator grid on/off |
| Grid | Horizontal lines | Approximate number of price lines |
| Grid | Vertical line every N bars | Spacing of the time lines |
| Grid | Color / Opacity / Style | Look of the grid lines |
| Chart colors | Apply chart colors | Applies background, bullish/bearish candle colors and scale text color |
How to use
- Drag the indicator from Navigator → Indicators onto the chart.
- Adjust the options in the inputs window to your preference.
- When you remove the indicator, the objects it created are deleted and the default MT5 grid setting is restored.
Notes: this is a visual tool only. It does not generate buy or sell signals and does not open or manage trades. If you enable the chart colors option, the colors of the current chart are changed; untick it to keep your own colors.
Author
RBM Trader — https://rbmtrader.netlify.app/