RBM Volume Real Pro

RBM Volume Real PRO 3.0

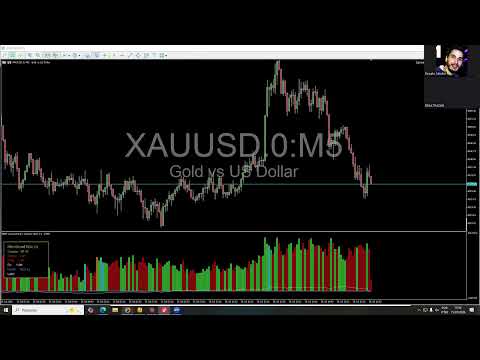
RBM Volume Real PRO 3.0 was developed to transform volume data into actionable market intelligence. While most traders focus exclusively on price movement, this indicator allows users to identify the participants truly driving the market by revealing the balance of power between buyers and sellers in real time.

The first component is Buy Volume, which represents the aggression of participants willing to execute orders at the asking price. Conversely, Sell Volume measures the aggression of traders accepting the available bid price. This distinction is essential because it highlights who is taking the initiative in the market rather than simply showing how much volume was traded.

Using these values, the indicator calculates the Delta, one of the most important metrics in order flow analysis. Delta represents the difference between aggressive buying and aggressive selling. A positive Delta indicates buying dominance, while a negative Delta signals selling pressure. This information helps traders evaluate whether a market move is supported by sufficient participation to sustain a trend.

The indicator also displays Total Flow, which represents the overall traded volume during the selected period. This metric helps measure the level of market interest at specific price zones. Price movements accompanied by strong flow are generally more significant and tend to carry greater operational relevance.

Another key feature of RBM Volume Real PRO 3.0 is the integration of VWAP, one of the most widely used benchmarks among banks, hedge funds, and proprietary trading desks. VWAP represents the volume-weighted average price and serves as an important reference for institutional positioning. When price remains above VWAP, market conditions generally reflect bullish strength. When price trades below VWAP, sellers tend to maintain control.

The combination of Price Action, Volume, Delta, Total Flow, and VWAP provides a comprehensive view of market structure. Breakouts supported by rising Delta and increasing flow often have a higher probability of continuation. On the other hand, price movements lacking volume confirmation may indicate exhaustion, absorption, or potential market traps.

The objective of RBM Volume Real PRO 3.0 is not to predict the future. Its purpose is to reveal the behavior of the participants who truly influence price formation. By understanding the underlying order flow behind each movement, traders can move beyond simply observing price and begin analyzing the forces responsible for driving it.

RBM Volume Real PRO 3.0

“Don’t just follow where price is going. Understand who is taking it there.”

RBM.trader | Economist • Global Trader
Prodotti consigliati
Big data Triple Average
Cesar Afif rezende Oaquim
This project did not reach the basic funding number, so I am abandoning it momentarily. The system is now free for other traders to continue the idea. You can follow my new project through my signals. A tool for institutional investor, now avaliable for Home users. We equip you like banks equip their analysts! How it works Focused on the Forex market, it takes advantage of the need of nations to control the value of their currency and the world exchange variations to analyze, through the pro
FREE
Volume By Color RSJ colora la barra del volume con una tonalità più scura quando il volume scambiato è superiore alla propria media mobile, così le candele con un'attività insolita risaltano. Una modalità opzionale a quattro colori mostra per livelli la forza del volume di ogni candela. Per impostazione predefinita, l'indicatore confronta ogni barra con la media semplice a 20 periodi del volume. Il tipo e il periodo della media possono essere modificati nei parametri di input. Come usarlo Le bar
FREE
Friend of the Trend: Your Trend Tracker Master the market with Friend of the Trend , the indicator that simplifies trend analysis and helps you identify the best moments to buy, sell, or wait. With an intuitive and visually striking design, Friend of the Trend analyzes price movements and delivers signals through a colorful histogram: Green Bars : Signal an uptrend, indicating buying opportunities. Red Bars : Alert to a downtrend, suggesting potential selling points. Orange Bars : Represent cons
FREE
Aggression Volume
Flavio Javier Jarabeck
4.29 (17)
Aggression Volume Indicator is the kind of indicator that is rarely found in the MQL5 community because it is not based on the standard Volume data provided by the Metatrader 5 platform. It requires the scrutiny of all traffic Ticks requested on the platform... That said, Aggression Volume indicator requests all Tick Data from your Broker and processes it to build a very special version of a Volume Indicator, where Buyers and Sellers aggressions are plotted in a form of Histogram. Additionally,
FREE
Volume Bubbles
Antonio Grassi
4.22 (9)
Delta Volume Bubbles è un indicatore avanzato per MetaTrader 5 progettato per visualizzare in modo chiaro e intuitivo la pressione di acquisto e vendita sul mercato. Attraverso bolle colorate e dinamiche, mostra in tempo reale la differenza tra volumi in buy e sell (Delta Volume), aiutando il trader a individuare zone di forte squilibrio tra domanda e offerta. L’indicatore rappresenta una forma visiva del flusso degli ordini (order flow) , semplificando l’analisi volumetrica anche per chi non di
FREE
SMC Order Block Zones (MT5) is a Smart Money Concept (SMC) analytical indicator specially designed and optimized for Gold (XAUUSD) . It automatically detects Order Blocks and displays them as Supply & Demand zones , helping traders identify potential institutional price levels on Gold. The indicator uses volatility-adaptive logic , making it highly suitable for the fast and aggressive movements of XAUUSD. Key Features (XAUUSD Optimized) Specially designed for Gold (XAUUSD) Automatic Order Block
FREE
AvgVolumes
Marco Montemari
5 (1)
This indicator is based on Volumes standard indicator, calculates the average of Volumes based on the last N bars set by users, and if the value of the volume is bigger then a set % respect the average a different color will be used. The indicator is shown in a separate indicator window. This version has now a limitation in setting the % about the threshold. If you are interested to set threshold consider to buy the PRO version ( https://www.mql5.com/en/market/product/35925 ) If you want to use
FREE
Value Chart Candlesticks
Flavio Javier Jarabeck
4.57 (14)
The idea of a Value Chart indicator was presented in the very good book I read back in 2020 , " Dynamic Trading Indicators: Winning with Value Charts and Price Action Profile ", from the authors Mark Helweg and David Stendahl. The idea is simple and the result is pure genius: Present candlestick Price analysis in a detrended way! HOW TO READ THIS INDICATOR Look for Overbought and Oversold levels. Of course, you will need to test the settings a lot to find the "correct" one for your approach. It
FREE
LM Volume Profile MT5 LM Volume Profile MT5 displays the distribution of calculated volume across price levels directly on the MetaTrader 5 chart. The indicator divides the selected price range into configurable price rows and displays the volume distribution as a horizontal histogram. It also calculates the Point of Control, Value Area High, Value Area Low, average profile price, and optional VWAP reference. Four profile modes are available: - Visible Range - Fixed Range - Session - Daily
FREE
Supports And Resistances Lines
Francisco Gomes Da Silva
4.66 (47)
Indicatore zone di supporto e resistenza MT5 questo indicatore sa come identificare automaticamente massimi e minimi. Questo indicatore di supporto e resistenza crea linee di supporto e linee di resistenza basate su massimi e minimi. come creare linee di supporto e resistenza. questo è un indicatore per creare linee automatiche di supporto e resistenza. come trovare il livello di supporto con l'indicatore. questo indicatore trova i massimi e i minimi automaticamente. L'indicatore crea automatica
FREE
MW Volume
Martin Bittencourt
3.8 (5)
The Martinware Volume indicator plots a colored moving average over volume bars. The coloring uses three colors and can be done in different ways choosable by the user and is applied both to the average as to the volume bars. Three types of coloring are possible: None: no coloring is done Increasing or decreasing: changes the color depending on the current value being bigger or lesser than the previous one Volume relative to average: colors vary if the current volume is bigger or lesser then
FREE
Simple VWAP
Abraao Moreira
4 (1)
What you get One volume-weighted average price line drawn on the main chart, over a period you set. Bars with more traded volume weigh more in the average than quiet bars. Light on the terminal: history is calculated once, then only new bars are added. Free, with no external files or DLLs. How it works VWAP = sum(price[i] × volume[i]) / sum(volume[i]) The line is calculated from the start of the available history once, when the indicator is attached. After that each new bar extends the line wit
FREE
The Volume Weighted ATR indicator is a helpful tool for measuring market activity. It is based on the idea of the Volume-Weighted ATR. Combining these two elements helps identify potential turning points or breakout opportunities. The indicator for the classification of the activity of the market uses the moving average and its multiples. Accordingly, where the VWATR bar is located (relative to the moving average), it is labelled as ultra-low, low, average, high, very high or ultra high. The Vo
FREE
Consolida Medias
OTAVIO AGUIAR CAMPOS Aguiar
O indicador imprime a linha da média longa quando as médias media e curta estão confinadas dentro dos limites de 1 ATR (average tru range) da média longa. Após períodos de congestão os preços se movimentam fortemente em uma direção. Este indicador não fornece pontos de entrada, apenas mostra que as médias estão bastante próximas. Parâmetros: Periodmalongo: Período da média longa. Periodmamedio: Período da segunda média. Periodmamedio2:Período da terceira média. Periodmacurto: Período da média cu
FREE
Grafico de Rompimento
Marcio Sales Santana
O indicador grafico de rompimento foi desenvolvido para elevar a precisão e confiabilidade na identificação de oportunidades de rompimento no mercado financeiro. Projetado com algoritmos avançados, este indicador destaca barras de rompimento com uma precisão notável, permitindo que traders identifiquem pontos de entrada e saída estratégicos. Recursos Principais: Precisão Aprimorada: Utiliza algoritmos avançados para identificar barras de rompimento com uma precisão excepcional. Alertas em Tempo
FREE
Simple Midas
Jean Jacques Huve Ribeiro
5 (3)
Initiated in 1995 by the physicist and technical analyst Paul Levine, PhD, and subsequently developed by Andrew Coles, PhD, and David Hawkins in a series of articles and the book MIDAS Technical Analysis: A VWAP Approach to Trading and Investing in Today's Markets.Latterly, several important contributions to the project, including new MIDAS curves and indicators, have been made by Bob English, many of them published in the book.
FREE
HTF Candles Nika sovrappone candele a grandezza naturale da qualsiasi timeframe superiore direttamente sul grafico corrente in MetaTrader 5. Offre una visione multi-timeframe chiara senza cambiare grafico. Funzionalita principali - Disegna le candele del timeframe superiore come rettangoli pieni con stoppini sul grafico corrente - Supporta la modalità candele standard e Heiken Ashi - Timer con conto alla rovescia in tempo reale fino alla chiusura della candela HTF corrente - Colori personalizz
FREE
Weis Waves
Flavio Javier Jarabeck
2.83 (18)
The original author is David Weis, an expert in the Wyckoff Method. The Weis Wave is a modern adaptation of the 1930's Wyckoff Method, another expert in Tape Reading techniques and Chart Analysis. Weis Waves takes market volume and stacks it into waves according to price conditions giving the trader valuable insights about the market conditions. If you want to learn more about this subject you can find tons of videos in YouTube. Just look for "The Wickoff Method", "Weis Wave" and "Volume Spread
FREE
Smart Trendline Detector Smart Trendline Detector is an automatic multi-timeframe trendline analysis indicator for MetaTrader 5 that detects and ranks rising support and falling resistance structures using market swing points. Instead of filling the chart with every possible trendline, the indicator evaluates qualifying structures and displays only a controlled number of the strongest candidates according to configurable ranking criteria. The result is a cleaner chart with relevant trendline str
FREE
Weis Waves è un indicatore tecnico sviluppato da David Weis, ispirato ai principi di Richard Wyckoff. A differenza del volume tradizionale, mostrato barra per barra, Weis Waves accumula il volume in “onde” rialziste o ribassiste, ricominciando il conteggio ogni volta che il prezzo cambia direzione. Questo metodo consente al trader di vedere chiaramente la vera forza del movimento di mercato, poiché ogni onda riflette l’intensità del volume che sostiene la sequenza di candele. Caratteristiche
FREE
ADX consolidado
OTAVIO AGUIAR CAMPOS Aguiar
5 (3)
Mostra a média móvel quando ADX > 20 e pinta de verde ou vermelho quando os valores de ADX estão subindo indicando tendência. Quando o ADX é menor que 20 indica movimento lateral consolidado. O indicador não define pontos de entrada, somente mostra a média colorida quando a tendência está se fortalecendo. Faz parte do grupo de indicadores do Indicador Tavim.
FREE
The   ADX  Histogram   is a modern and visual upgrade of the classic   Average Directional Index (ADX) . It transforms the standard ADX and DI+ / DI– values into a   color-coded histogram , making trend analysis much clearer and faster.  Key Features: Histogram with four states :  Blue = Normal Buy Trend Green = Strong Buy Trend  Orange = Normal Sell Trend  Red = Strong Sell Trend Automatic strength detection : uses the ADX line to separate “normal” vs. “strong” signals.  Fully customizable: ADX
FREE
ATR Bollinger Bands
Cristian Mateo Duque Ocampo
1 (1)
This indicator allows us to identify unusual volatility conditions. If the ATR line is below the middle bollinger line, volatility is assumed to be below average. If the ATR line is above the middle bollinger line, volatility is assumed to be above average. If the ATR line breaks the upper bollinger band, volatility is assumed to be high. If the ATR line breaks the lower bollinger band, volatility is assumed to be low.
FREE
About: The Nadaraya-Watson Envelope is a sophisticated yet practical technical indicator that helps traders identify overbought and oversold conditions using advanced kernel regression methods. This is the MT5 only Version. For MT4 Version go here: https://www.mql5.com/en/market/product/158640/ Key Features ATR-Based Bands: Three upper and three lower bands provide graduated overbought/oversold zones Logarithmic Scale Calculation Center Line - bullish (teal) or bearish (red) What is the Nad
FREE
TradeVision Pro
Ian Nganga Comba
TradeVisonPro Forex Analyzer Pro Dashboard di analisi e monitoraggio dei conti di trading MT5 TradeVisonPro Forex Analyzer Pro è una soluzione di analisi del trading e monitoraggio dei conti progettata per gli utenti di MetaTrader 5. Il prodotto organizza i dati di trading MT5 in una dashboard web strutturata, consentendo ai trader di visualizzare le informazioni del conto, monitorare le posizioni aperte, analizzare lo storico delle operazioni, seguire le strategie, mantenere un diario di tradin
FREE
The Horizontal Ray Tool is a lightweight, professional charting utility designed to streamline support and resistance mapping on MetaTrader 5. It brings rapid, one-click horizontal level placement directly to your live chart, eliminating the workspace clutter associated with infinite horizontal lines or manually drawn trendlines. Key Features: Interactive On-Screen Button: Spawns a clean, responsive "DRAW RAY" button docked directly on your chart canvas. A single click drops an independent hor
FREE
Easy VWAP
Luca Spinello
VWAP Indicator, the short form of Volume Weighted Average Price, is similar to a moving average but takes into consideration the tick volume of the candles. The indicator calculates the moving average multiplying the price of each candle for the tick volume in the candle. Said calculation weighs with more significance price where more transactions were made. Features: Visual styling customizable Period customizable Ease of use
FREE
Volume-to-Price Movement Oscillator (VP Oscillator) for MT5 The VP Oscillator highlights the balance (or imbalance) between trading volume and price movement, helping traders spot hidden accumulation, distribution, or weakening trends. How It Works: Calculates each bar’s price range (High–Low) and tick volume. Normalizes both values over a set period (default: 14). Plots the absolute difference between them ×100 — showing how closely price action aligns with trading activity. Interpretation: Hig
FREE
Panoramica Sperimenta un'analisi del flusso d'ordini (order flow) di livello professionale con l'Anchored Volume Profile, un indicatore di distribuzione del volume ultra-leggero e ad alte prestazioni progettato esclusivamente per MetaTrader 5. Sviluppato da zero utilizzando meccaniche canvas in memoria grezza, questo indicatore elimina il massiccio ritardo della CPU (CPU lag), lo sfarfallio dell'interfaccia utente e il congelamento dei grafici comunemente associati ai profili standard basati s
FREE
Heiken Ashi Smoothed Indicator
Leonardo Daniel Isaia
5 (1)
Indicatore Heiken Ashi Smoothed per MT5 Heiken Ashi avanzato con filtro di smoothing. Riduce il rumore, elimina falsi segnali e individua trend precocemente. Ideale per Forex, indici e crypto (H1-D1). Come funziona e come viene levigato? L'Heiken Ashi tradizionale calcola le candele mediando i valori di apertura, chiusura, massimo e minimo dei periodi precedenti, riducendo già l'impatto delle fluttuazioni minori. Tuttavia, l' Heiken Ashi Smoothed eleva questo approccio applicando un filtro di le
FREE
Gli utenti di questo prodotto hanno anche acquistato
Trend Sniper X
Sarvarbek Abduvoxobov
4.86 (44)
Trend Sniper X è un indicatore trend-following multi-timeframe per MetaTrader 5 che aiuta i trader a identificare la direzione del trend e i potenziali punti di inversione con chiarezza e precisione. per MT4: https://www.mql5.com/en/market/product/193245 Informazioni sul prezzo: Il prezzo attuale è promozionale ed è soggetto a modifiche con il rilascio di futuri aggiornamenti e nuove funzionalità. Offerta Bonus: Per ricevere GRATIS l'Auto-Trade Assistant EA per questo indicatore, invia un messa
Un nuovo Re in città - Indicatore + Gestione ordini (TP1 + TP2 + TP3) + Invio opzionale di segnali Telegram INCLUSO (GRATIS) (SISTEMA COMPLETO DI TRADING e SEGNALI) Il nostro miglior EA per l’Oro: Gold Slayer Questo indicatore include una strategia avanzata, un sistema di trading con gestione ordini personalizzabile e un sistema mean reversion che combina estensioni di envelope, supportato da molteplici filtri intelligenti di conferma come RSI per individuare ingressi di inversione ad alta proba
Smart Trend Trading System — MetaTrader 5 Dopo l'acquisto, inviami un messaggio su MQL5 per ricevere GRATUITAMENTE Smart Universal Expert Advisor, insieme al corso online, al manuale PDF e all'accesso al gruppo privato. STTS riunisce la direzione del trend, i segnali di entrata e uscita, le zone di inversione e i livelli di prezzo importanti direttamente sul grafico. Segui il sistema manualmente oppure collega un EA compatibile separato per eseguire le operazioni automaticamente con le impostazi
Zoryk Gold
Reda El Koutbane
4.78 (18)
ZORYK — Sistema avanzato di segnali XAUUSD per MetaTrader 5 Conosci sicuramente questa sensazione. Passi molto tempo ad analizzare l’oro. Aspetti il punto d’ingresso corretto. Finalmente apri l’operazione e il prezzo inizia immediatamente a muoversi contro di te. Chiudi troppo presto, sposti lo Stop Loss o esiti per alcuni secondi. Successivamente il mercato raggiunge esattamente l’obiettivo che avevi previsto inizialmente, ma senza di te nella posizione. Il problema non era sempre la direzione.
M5 Sniper
MeanFX
5 (4)
Porta il tuo vantaggio nel trading sotto i riflettori! M5 Sniper è un nuovo indicatore di MeanFX. Combina segnali di trading precisi con livelli TP/SL adattivi , creando così le migliori operazioni statistiche possibili! Il prezzo aumenta ogni 5 acquisti, il prossimo prezzo è di 69$ Scrivimi dopo l'acquisto per ricevere consigli/guida e un EA bonus Cosa lo rende diverso? Performance statistica comprovata su Gold XAUUSD ( funziona su quasi ogni asset , concentrandosi sulla padronanza di un singol
Entry Points Pro vi mostra dove entrare, dove mettere lo stop e con quale lotto operare — prima di piazzare l'ordine. PREZZO Ora 199 USD: 10 copie a questo prezzo, poi 249 USD. Il prezzo finale è di 349 USD. Guadagno facendo trading sui mercati e lo dimostro, quindi non ho bisogno di vendere questo indicatore a tutti. È uno strumento per trader che ragionano con la propria testa, non un pulsante magico. La freccia compare alla chiusura della candela e non si ridisegna. Due impostazioni: il vost
Ultra Indicator
Ihor Otkydach
5 (1)
ULTRA è un indicatore tecnico che funziona secondo un approccio “tutto in uno”: analizza autonomamente il mercato, genera segnali di trading, visualizza i livelli per l’impostazione degli ordini stop-loss e suggerisce quando chiudere le operazioni per realizzare profitti o ridurre al minimo le perdite. In altre parole, non importa se non sai come analizzare il mercato, determinare i livelli — dove impostare lo stop-loss — o se hai difficoltà con la gestione del capitale. ULTRA farà tutto questo
Gann Made Easy è un sistema di trading Forex professionale e facile da usare che si basa sui migliori principi del trading utilizzando la teoria di mr. WD Gann. L'indicatore fornisce segnali ACQUISTA e VENDI accurati, inclusi i livelli di Stop Loss e Take Profit. Puoi fare trading anche in movimento utilizzando le notifiche PUSH. CONTATTAMI DOPO L'ACQUISTO PER RICEVERE GRATUITAMENTE LE ISTRUZIONI DI TRADING E OTTIMI INDICATORI EXTRA! Probabilmente hai già sentito parlare molte volte dei metodi d
SuperScalp Pro
Van Minh Nguyen
4.54 (37)
SuperScalp Pro - Professional Multi-Layer Confluence Scalping System SuperScalp Pro è un indicatore di scalping avanzato che potenzia il Supertrend classico con diversi filtri intelligenti di conferma. Aiuta a individuare opportunità di trading Buy/Sell con una maggiore probabilità di successo, riducendo significativamente i falsi segnali. Le frecce Buy e Sell vengono visualizzate chiaramente direttamente sul grafico, insieme ai livelli di Stop Loss e Take Profit basati sull’ATR, calcolati autom
GoldenX Entry MT5
VividMind Digital Solutions
5 (17)
GoldenX Entry è un indicatore per MT5 con un algoritmo adattivo Smart Entry Trend, un sistema di scoring dei segnali, un rilevatore del regime di mercato e un filtro di volatilità. Ogni segnale include un livello di ingresso calcolato, tre livelli di Take-Profit (TP1, TP2, TP3) e un livello di Stop-Loss. È costruito su più livelli analitici progettati per adattarsi a diverse condizioni di mercato, combinando un sistema analitico multilivello con un ottimizzatore integrato e un sistema di traccia
Gold Trend Coach MT5
Cristhian Alexander Gaibor Cuasquer
4.27 (11)
Segnali di acquisto e vendita senza repaint sull'oro (XAUUSD) per MetaTrader 5. Ogni segnale arriva con stop loss e tre take profit. Un filtro Smart Money Concepts con BOS e CHoCH, così operi a favore della struttura, non contro. Un Mentor live sul pannello che ti guida passo dopo passo dall'ingresso fino al TP3. E alert direttamente sul tuo telefono e sul tuo canale Telegram. Questo è Gold Trend Coach. Mai più da solo davanti al grafico. KIT ACQUIRENTE GRATIS con il tuo acquisto: 1. Telegram A
SMC Intraday Formula
VividMind Digital Solutions
5 (26)
Cominciamo con la verità. Nessun indicatore da solo ti renderà profittevole. Se qualcuno ti dice il contrario, ti sta vendendo un sogno. Qualsiasi indicatore che mostra frecce perfette di acquisto/vendita può essere reso impeccabile — basta ingrandire la giusta sezione della storia e catturare solo i trade vincenti. Noi non lo facciamo.  SMC Intraday Formula è uno strumento. Legge la struttura del mercato per te, identifica le zone a più alta probabilità e ti mostra esattamente come appare la t
Boba Analysis Suite
Trade Ready Solutions LLC
5 (2)
Boba Analysis Suite Boba Analysis Suite è un indicatore di analisi per MetaTrader 5. Riunisce la struttura del mercato, le zone di prezzo rilevanti e il contesto generale del mercato in un’unica visualizzazione del grafico. Sviluppato sulla base dell’esperienza pratica come trader e formatore di trading, supporta un processo di analisi strutturato: valutare la direzione del mercato, individuare livelli importanti e analizzare congiuntamente più intervalli temporali. Analisi nel contesto del merc
Gold Entry Sniper
Tahir Mehmood
5 (23)
Gold Entry Sniper – Dashboard ATR Multi-Timeframe per Scalping e Swing Trading sull’Oro Gold Entry Sniper è un indicatore avanzato per MetaTrader 5 che offre segnali di acquisto/vendita precisi per XAUUSD e altri strumenti, basato sulla logica ATR Trailing Stop e l' analisi multi-timeframe . Caratteristiche e Vantaggi Analisi Multi-Timeframe – Visualizza trend su M1, M5, M15 in un'unica dashboard. Trailing Stop Basato su ATR – Stop dinamici che si adattano alla volatilità. Dashboard Professional
Prossimo aggiornamento — Versione 2.52 in arrivo! [NOVITÀ] Preparati a 4 nuove funzionalità principali progettate per migliorare la tua analisi di mercato e il tuo flusso di lavoro nel trading Portiamo l’analisi di mercato a un livello superiore con 4 nuove funzionalità progettate per soddisfare le tue esigenze di trading. Ecco le novità: 1. TRADE OVERVIEW DASHBOARD 2. CONFLUENCE AT ZONE 3. STRONG & WEAK HIGH/LOW 4. OTE 1. TRADE OVERVIEW DASHBOARD Una dashboard che ti aiuta a comprendere più fa
FX Power MT5 NG
Daniel Stein
5 (33)
FX Power: Analizza la Forza delle Valute per Decisioni di Trading Più Intelligenti Panoramica FX Power è lo strumento essenziale per comprendere la reale forza delle principali valute e dell'oro in qualsiasi condizione di mercato. Identificando le valute forti da comprare e quelle deboli da vendere, FX Power semplifica le decisioni di trading e rivela opportunità ad alta probabilità. Che tu segua le tendenze o anticipi inversioni utilizzando valori estremi di Delta, questo strumento si adatta
M1 Sniper MT5
Oleg Rodin
5 (7)
M1 SNIPER   è un sistema di indicatori di trading facile da usare. Si tratta di un indicatore a freccia progettato per l'intervallo temporale M1. L'indicatore può essere utilizzato come sistema autonomo per lo scalping sull'intervallo temporale M1 e come parte del tuo sistema di trading esistente. Sebbene questo sistema di trading sia stato progettato specificamente per il trading sull'intervallo temporale M1, può comunque essere utilizzato anche con altri intervalli temporali. Inizialmente ho p
FiboSniper Pro
Van Minh Nguyen
5 (4)
FiboSniper Pro – Multi-Filter Fibonacci System with Auto SL/TP and Control Panel FiboSniper Pro è un indicatore tecnico che combina Fibonacci Envelopes dinamici con diversi filtri di conferma per generare segnali Buy e Sell selezionati. I livelli di Fibonacci vengono calcolati sulla base di Moving Average e ATR e successivamente filtrati tramite ADX, EMA, RSI, ATR, Volume, Time e struttura delle candele. L’indicatore visualizza direttamente sul grafico i livelli automatici di Stop Loss e Take Pr
Auto Optimized SpeedAngle è un sistema di vettorizzazione del momento di livello istituzionale che elimina l'overfitting ( curve-fitting ) attraverso l'ottimizzazione continua Walk-Forward (WFO). Invece di affidarsi a input statici che si degradano quando i regimi di mercato cambiano, l'indicatore recalibra dinamicamente i suoi parametri utilizzando la validazione Out-of-Sample (OOS), assicurando che i segnali visualizzati rappresentino reali vantaggi statistici anziché anomalie storiche. Quadro
SQN Max indicator for MT5 by ITC
Renaud Herve Francois Candel
Sqn Max Indicator Sqn Max is an exclusive indicator to trade the market with high effectiveness. The indicator is based on price action, volatility and trend. This indicator is as simple as possible but not too simple. The indicator can generate alerts to ease the trading process. You don't have to stay all day in front of your screen. The indicator can be used with any class of assets and with any time frame. It is possible to achieve better results trading our list of selected assets. We achi
Smc Pro ToolKit
Talal N Z Aljarusha
5 (14)
SMC PRO TOOLKIT — SMART MONEY ANALYSIS & STRUCTURED TRADE PLANNING SMC Pro ToolKit is a professional Smart Money Concepts analysis workspace for MetaTrader 5. It combines market structure, multi-timeframe analysis, institutional price zones, setup evaluation, confirmation tools, volume context, alerts, and risk planning inside one organized chart environment. One workspace. Multiple layers of confirmation. One structured trading plan. OPEN COMPLETE USER GUIDE MULTI-CONDITION SETUP ENGINE At
SIO Oscillator: oscillatore auto-ottimizzante dello squilibrio di semivarianza Acquista l’indicatore e ricevi GRATIS l’Expert Advisor (EA) basato su di esso. La maggior parte degli oscillatori tratta ogni movimento di prezzo allo stesso modo. SIO separa la pressione rialzista da quella ribassista e misura lo squilibrio tra le due, mostrando quale parte controlla davvero il mercato: compratori o venditori. Quando lo squilibrio raggiunge un estremo, SIO genera un segnale chiaro con livelli di ingr
Power Candles MT5
Daniel Stein
4.58 (12)
Power Candles V3 - Indicatore di forza ad ottimizzazione automatica Power Candles V3 trasforma la forza delle valute e degli strumenti in un piano di trading attuabile su ogni grafico a cui è collegato. Invece di limitarsi a colorare le candele, esegue un'auto-ottimizzazione in tempo reale in background e ti fornisce i migliori valori di Stop Loss, Take Profit e soglia di segnale per il simbolo che hai davanti. Basta un clic per adottarlo nel trading live: i raggi di ingresso, Stop Loss e Take P
Atomic Analyst MT5
Issam Kassas
4.51 (65)
Atomic Analyst — MetaTrader 5 Dopo l'acquisto, inviami un messaggio su MQL5 per ricevere GRATUITAMENTE Smart Universal Expert Advisor, insieme al corso online, al manuale PDF e all'accesso al gruppo privato. Atomic Analyst riunisce l’azione del prezzo, la direzione del trend, i segnali di entrata e uscita, lo Stop Loss e diversi livelli di Take Profit direttamente sul grafico. INDIVIDUA IL SEGNALE. COMPRENDI IL CONTESTO OPERATIVO. Atomic Analyst organizza la sua analisi in informazioni visive ch
Unix Scalper
Issam Kassas
4 (4)
Unix Scalper — MetaTrader 5 Dopo l'acquisto, inviami un messaggio su MQL5 per ricevere GRATUITAMENTE Smart Universal Expert Advisor, insieme al corso online, al manuale PDF e all'accesso al gruppo privato. Individua il setup. Esamina il piano. Scegli come operare. UNIX Scalper riunisce analisi di mercato, indicazioni BUY/SELL/WAIT e livelli Entry, Stop Loss, TP1 e TP2 in un unico pannello organizzato. VISUALIZZA IL SEGNALE E IL PIANO • Indicazioni chiare: BUY, SELL o WAIT. • Livelli definiti: E
Tokyo mt5 Indicator
Vasiliy Strukov
5 (15)
Il Tokyo Indicator offre una chiara panoramica visiva della direzione del trend, dei potenziali segnali di trading e delle condizioni di mercato. La sua linea di trend a gradini, codificata a colori, distingue le fasi rialziste (in blu) da quelle ribassiste (in magenta). Frecce direzionali dedicate evidenziano potenziali opportunità di acquisto e vendita al variare del trend visualizzato. Una dashboard integrata riunisce in un'unica visualizzazione pratica il segnale corrente, il bias di mercato
Astral Structure
Ottaviano De Cicco
Astral Structure Valuta il setup. Osserva il piano iniziale. Offerta di lancio - $99. $149 dopo il lancio. Un setup di struttura pone più domande insieme: il quadro più ampio concorda, dove si trova il riferimento di stop e come sono definiti i target? Astral Structure riunisce queste domande in un unico spazio per i trader discrezionali che basano le proprie decisioni sulla struttura del mercato. Concentrati sul setup rilevante. Esamina insieme l'ultimo setup idoneo, la sua direzione e la sua q
Crystal Heikin Ashi Signals
Muhammad Jawad Shabir
5 (5)
Crystal Heikin Ashi Signals—Professional Trend & Signal Detection Indicator Advanced Heikin Ashi Visualization with Intelligent Signal System for Manual & Automated Trading Final Price: $149 ---------> Price goes up $10 after every 10 sales . Limited slots available — act fast . Overview User Guide PDF Crystal Heikin Ashi Signals is a professional-grade MetaTrader 5 indicator that combines pure Heikin Ashi candle visualization with an advanced momentum-shift detection system. Designed for both m
Trend Catcher ind mt5
Ramil Minniakhmetov
5 (18)
INDICATORE TREND CATCHER L'indicatore Trend Catcher analizza i movimenti dei prezzi di mercato, utilizzando una combinazione di indicatori di analisi del trend proprietari dell'autore e personalizzati. Identifica la vera direzione del mercato filtrando il rumore a breve termine e concentrandosi sulla forza del momentum sottostante, sull'espansione della volatilità e sul comportamento della struttura dei prezzi. Utilizza inoltre una combinazione di indicatori personalizzati di smoothing e filtr
Indicatore multi-valuta di forza e momentum MT5 Dynamic Forex28 Navigator è l'evoluzione dei nostri indicatori popolari da lunga data, che riunisce la potenza di cinque in uno: Advanced Currency Strength28 Indicator (700 recensioni) Advanced Currency IMPULSE with ALERT (530 recensioni) Currency Strength EXOTICS GOLD Impulse with Alert CS28 Combo Signals (bonus attuale) Non serve acquistare quattro indicatori e impilarli sui grafici. Tutto è riunito in un solo indicatore potente: la forza delle 2
Altri dall’autore
RBM Flow Footprint
Renato Brendim Medici
RBM Flow Footprint Read what happens inside every candle. RBM Flow Footprint shows, at each price level, how much was traded by buyers and sellers, right on your MetaTrader 5 chart, in a clean, dark, professional design. Instead of deciding only by candle body and wick, you see where the market really fought, where one side took control, and where price moved through without finding interest. What you see on the chart Bid x Ask footprint: each candle becomes a column. The left half shows selling
FREE
RBM Quick Entry Panel
Renato Brendim Medici
RBM Quick Entry Panel PRO SHORT DESCRIPTION One-click on-chart entry panel: lot size, stop loss, take profit, up to 3 partial exits and automatic breakeven. FULL DESCRIPTION Anyone who trades every day knows the hard part is rarely the analysis. It's the execution. Opening the order window, typing the lot, working out the stop, remembering to take partials, moving to breakeven at the right moment. In a fast market every one of those steps costs seconds and leaves room for mistakes. RBM Quick Ent
FREE
RBM Gold Liquidity Hunter
Renato Brendim Medici
5 (1)
Gold doesn’t forgive a bad entry. It sweeps stops, tricks anyone reading the candle at face value, and reverses right when everyone’s convinced the trend is set. RBM Gold Liquidity Hunter shows you exactly where those traps happen, before you walk into one. The indicator maps yesterday’s high and low automatically and draws the Asian session range live on your chart, that window that usually decides where the day is headed once London and New York show up. When price breaks one of those levels
FREE
SMC Intraday
Renato Brendim Medici
SMC INTRADAY RBM Quick User Manual Smart Money Concepts | MetaTrader 5 1. Installation Open MetaTrader 5. Go to File → Open Data Folder. Navigate to MQL5 → Indicators and copy the indicator file into this folder. Open MetaEditor, compile the file, and return to MetaTrader 5. Refresh the Navigator, locate SMC Intraday RBM, and drag it onto the desired chart. 2. How to Interpret the Indicator BOS — Break of Structure: A break of a previous market structure that may indicate continuation of the cur
FREE
RBM Delta Gold
Renato Brendim Medici
5 (1)
Gold does not move only because of price. It moves because of aggression, imbalance, and market flow. The Delta Indicator was created to reveal exactly that. The RBM Trader Delta Indicator for XAUUSD identifies the difference between aggressive buyers and sellers, helping traders detect real market pressure before the movement becomes obvious on the chart. While most traders focus only on candles, Delta shows what is happening behind price action. This indicator was specially developed for
FREE
RBM Flow Structure PRO
Renato Brendim Medici
RBM Flow Structure PRO Advanced Capital Flow and Market Structure Analysis for MetaTrader 5 Five integrated modules. One tool. A more complete market view. RBM Flow Structure PRO is a multifunctional indicator designed for traders who want to gain a deeper understanding of market behavior. It combines capital flow analysis, price structure, supply and demand zones, and key trading levels on a single chart. With five independent and configurable modules, the indicator helps organize your analysis
FREE
RBM VolumeProfileMaster Professional Volume Profile Analysis for MetaTrader 5. RBM VolumeProfileMaster was developed to analyze volume distribution across price levels, identify areas of trading concentration, and provide a clearer understanding of market acceptance and rejection zones. A comprehensive analytical tool combining Volume Profile, market structure, and volume flow analysis in a single interface. KEY FEATURES Volume Profile: Displays traded volume distribution across individual pric
FREE
RBM Smc
Renato Brendim Medici
RBM SMC Liquidity Hunter MT5 — Institutional Structure and Liquidity Indicator   The RBM SMC Liquidity Hunter is a professional tool developed to map Smart Money Concepts (SMC) dynamics directly on your charts. The indicator tracks market structure breaks, validates supply and demand zones using price displacement, and detects liquidity sweeps confirmed by volume, integrating all confluences into an executive on-chart dashboard.   Key Features  Market Structure Mapping (BOS / CHoCH): Automatic
FREE
RBM Zoomscroll
Renato Brendim Medici
RBM Zoom Scroll Every trader knows the feeling. You are on the gold M5, you want to see how the whole day built up, and you start clicking zoom buttons or dragging the price scale around. By the time you are done, the move you wanted to look at is already gone. RBM Zoom Scroll fixes this the way it should have worked from day one: you spin the mouse wheel over the chart and the chart zooms. No buttons, no menus, no dragging. How it works Scroll: zooms the chart in and out horizontally, which mea
FREE
RBM OB Dashboard
Renato Brendim Medici
RBM OB Dashboard Short Description Market structure indicator featuring BOS, ChoCH, Pending Breaks, scored Order Blocks, FVG, liquidity sweeps, sessions, Volume Profile, and a draggable dashboard. Full Description The RBM OB Dashboard reads market structure and key price reaction zones directly on the chart. It combines BOS, ChoCH, Order Blocks, Fair Value Gaps (FVG), liquidity, sessions, Kill Zones, Volume Profile, and a compact dashboard for rapid analysis. Built for traders who rely on market
FREE
RBM Volume Real 2
Renato Brendim Medici
5 (2)
O RBM Volume Real foi desenvolvido para transformar volume em informação útil para tomada de decisão. Em vez de observar apenas a movimentação do preço, o indicador permite identificar quem está dominando o mercado em determinado momento: compradores ou vendedores. O primeiro dado apresentado é o volume de Compras, que representa a agressão dos participantes que aceitaram pagar o preço pedido para entrar no mercado. Já o volume de Vendas mostra a agressão daqueles que aceitaram vender ao preço
FREE
RBM Trader Painel
Renato Brendim Medici
RBM Trade Panel - Automatic Lot Calculator and Order Management Fast execution panel for MetaTrader 5 featuring automatic dollar-based risk calculation, chart-based partial exits, one-click breakeven, and complete order management. Full Description Doing manual math or switching to external position calculators while price moves rapidly usually leads to missed entries or oversized positions. The RBM Trade Panel fixes this directly on your MetaTrader 5 chart by handling all risk calculations a
FREE
RBM Volume Ultimate
Renato Brendim Medici
RBM Volume Ultimate RBM Volume Ultimate is an indicator for MetaTrader 5 that combines buyer and seller financial volume, cumulative delta, daily VWAP and automatic detection of absorption and exhaustion in a single panel. The purpose of the indicator is to give traders a clearer view of buying and selling flow in real time. The histogram separates financial volume between buyers and sellers on a bar by bar basis, making it easier to identify moments when pressure shifts from one side of the ma
FREE
RBM Watermarkgrid
Renato Brendim Medici
RBM Watermark Grid - MQL5 Market Description RBM Watermark Grid A transparent symbol watermark plus a clean, wide-spaced grid for your MetaTrader 5 charts. Overview RBM Watermark Grid gives your chart a cleaner, more professional look. It shows the symbol name (and optionally the symbol description and timeframe) as a subtle watermark in the center of the chart, and replaces the default MT5 grid with a softer, more open grid that has fewer lines and does not clutter your candles. Key features Sy
FREE
RBM Prior Cote
Renato Brendim Medici
The previous day's open, close, high and low are among the levels the market respects most. Gold, Nasdaq, forex, indices: price comes back to these points, tests them, rejects them or breaks through. RBM Prior Cote draws them for you automatically, so you stop marking lines by hand every morning. What it does • Plots the open, close, high and low of the previous daily candle • Shows the last several days of history (you choose how many), so you can see where price actually reacted • Adds a la
FREE
RBM Nasdaq Liquidity Hunter Institutional Liquidity Indicator for Nasdaq RBM Nasdaq Liquidity Hunter is an advanced liquidity analysis tool developed for Nasdaq traders who want to identify institutional liquidity events with greater precision. Instead of highlighting every breakout, the indicator filters market noise and identifies only liquidity sweeps confirmed by volume, trend, and multiple institutional confluence factors. Every detected event is evaluated through a proprietary scoring
FREE
RBM PivotZones
Renato Brendim Medici
RBM Pivot Zones automatically detects pivot highs and lows directly on the chart, marking each level with a horizontal line and a subtle visual zone. The logic is straightforward: the indicator scans price history looking for structural tops and bottoms, the areas where price arrived, rejected, and reversed. Pivot highs in blue, pivot lows in red. Clean chart, no clutter. The indicator adjusts to any timeframe automatically. It works the same way on M5, H1, or D1 without reconfiguration. Sensiti
FREE
RBM Atr Pro
Renato Brendim Medici
RBM ATR PRO v1.10 Quem opera mercado volátil sabe como é ruim tomar stop por causa de uma violinada de pavio e ver o preço andar forte a favor logo depois. O RBM ATR PRO foi desenvolvido exatamente para resolver isso. Ele evolui o indicador clássico de volatilidade combinando a leitura do ATR com dois níveis independentes de suavização. A linha no gráfico fica limpa e objetiva: verde para estrutura de alta e vermelha quando o mercado vira para a baixa. Funciona perfeitamente para rastrear a ten
FREE
RBM Stop and Take Label
Renato Brendim Medici
5 (1)
Here is the English version of the product description, tailored to sound clear, professional, and engaging for the MQL5 Market: RBM SL TP Label — Indicator for MetaTrader 5 If you trade Forex and miss seeing the exact financial value of your risk and target directly on your chart, this indicator solves that in a clean, direct, and intuitive way. What It Does As soon as you open a position, the indicator automatically detects your Stop Loss and Take Profit lines and displays, in real-time, both
FREE
RBM Calendario Pro
Renato Brendim Medici
RBM | CALENDAR PRO MACROECONOMIC INTELLIGENCE DIRECTLY INSIDE METATRADER 5 Developed by RBM.TRADER RBM | CALENDAR PRO is an advanced economic calendar dashboard designed for traders who want to monitor major global macroeconomic events directly inside MetaTrader 5. More than just an economic agenda, this tool organizes essential economic information, allowing you to track upcoming releases, compare market expectations and identify economic surprises that may influence financial markets. KEY FEAT
FREE
RBM EA Pro Gold
Renato Brendim Medici
RBM EA PRO — the most complete Expert Advisor you’ll find for XAUUSD Gold doesn’t behave like any other asset. It reacts to US interest rates, dollar strength, breaking news, and it loves to sweep stops before making its real move. RBM EA PRO was built specifically to handle that complexity, with no shortcuts and no impulsive entries. How it decides to enter This isn’t a robot that buys or sells at random. RBM EA PRO only considers an entry when multiple layers of analysis agree with each ot
RBM EA Deluxe
Renato Brendim Medici
An XAUUSD-focused robot that only enters when several market conditions line up at once: trend, volume, price structure and session. It shows you exactly what it’s analyzing on the chart, and why it decided to trade or wait. Most gold robots you’ll find out there run on something simple: a moving average cross, or a channel breakout, and that’s it. The problem is gold doesn’t trade that way. It sweeps liquidity, traps early entries, and usually only moves for real after shaking everyone out fir
RBM QuickEntryPanel PRO
Renato Brendim Medici
RBM QUICK ENTRY PRO PANEL LEGEND Trade execution, risk management and operational control for MetaTrader 5 PRODUCT OVERVIEW The RBM Quick Entry PRO | Panel Legend is a professional trade execution and position management panel developed for MetaTrader 5. It combines order entry, risk control, position management and performance monitoring in a compact interface integrated into the chart. MAIN FEATURES 01 | TRADE EXECUTION Market orders: BUY and SELL. Pending orders: BUY LIMIT and SELL LIMIT. St
RBM Heatmap Pro
Renato Brendim Medici
RBM Heatmap PRO 2.08 Visualize market strength across multiple asset classes in a single dashboard. RBM Heatmap PRO is an indicator developed for MetaTrader 5 that brings multiple asset classes together in a visual dashboard, allowing traders to monitor percentage changes, prices, and relative market movements in a clear and organized way. Featuring a professional interface, dynamic asset management, and bilingual support, the indicator is designed for traders who need to monitor different marke
Filtro:
badboy floripa
110
badboy floripa 2026.08.02 22:18 

L'utente non ha lasciato alcun commento sulla valutazione.

Rispondi alla recensione