RBM Flow Footprint
- Indicatori
-
Renato Brendim Medici
 RBM Trader is an Economist and Global Trader, specialized in FX, Derivatives and Equity. Creator of the Reverse Setup and the GFT method.
Author of the book "Macroeconomics for Traders," connecting macroeconomics, geopolitics and financial markets in a practical, straight-to-the-point way. - Versione: 1.10
RBM Flow Footprint
Read what happens inside every candle. RBM Flow Footprint shows, at each price level, how much was traded by buyers and sellers, right on your MetaTrader 5 chart, in a clean, dark, professional design.
Instead of deciding only by candle body and wick, you see where the market really fought, where one side took control, and where price moved through without finding interest.
What you see on the chart
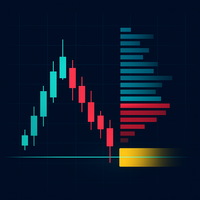
- Bid x Ask footprint: each candle becomes a column. The left half shows selling aggression and the right half shows buying aggression, with color intensity proportional to volume.
- Diagonal imbalance: a gold outline appears when one side outweighs the opposite side on the diagonal, by the ratio you define.
- Stacked imbalance: a gold bar appears when three or more consecutive levels show imbalance on the same side. It marks zones of clear dominance.
- Candle POC: the highest-volume level of each column is highlighted.
- Bottom strip: delta, total volume and time of every candle, always visible.
- CVD (cumulative delta): a line that changes color as pressure rises or falls, ideal for spotting divergences with price.
- Side volume profile: volume distribution by price level, with POC, VAH and VAL (70% value area).
- Live order book (DOM): the orders currently open, when your broker provides market depth.
Built to stay readable
- Automatic level grouping: the indicator merges price levels according to your zoom, so text never gets cramped or unreadable.
- Automatic vertical scale: the chart fits the displayed candles, so you do not have to keep adjusting the scale. It can be turned off.
- Native candles hidden: the footprint replaces the MT5 candles without duplicating information. When you remove the indicator, your original colors return automatically.
- Three reading modes: Bid x Ask, Delta per level or Volume per level.
- Gradual tick loading: history is downloaded in batches, without freezing the platform.
How aggression is classified
MetaTrader 5 does not deliver the same kind of data for every instrument. The indicator uses the best data available:
- Exchange instruments with aggressor flags (for example futures and stocks): uses the buy and sell flag of each trade and the real volume.
- Instruments with last trade price but no flags: applies the tick rule (a trade above the previous one counts as a buy, below counts as a sell).
- CFDs with bid and ask only (much of forex, gold and indices): uses the price change between bid and ask. In this case the numbers represent tick count, not real exchange volume. They are useful to measure where pressure was concentrated.
You can also force the data source manually in the settings.
Who it is for
- Scalpers and day traders who trade order flow.
- Traders who study absorption, exhaustion and imbalance zones.
- Traders of gold, indices, forex and exchange-traded assets who want to read beyond the candle.
- Anyone who works with volume profile, POC and value area and wants everything on the same chart.
Main settings
- Display mode: Bid x Ask, Delta or Volume.
- Aggression source: automatic, flags only or tick rule only.
- Level grouping: automatic or fixed.
- Imbalance ratio and minimum volume: adjust the sensitivity to your instrument.
- Stacked imbalance: minimum number of stacked levels.
- Layout: column width, number of columns, font size, POC, bottom strip, CVD, side profile and order book.
- Colors: buy, sell, highlight, text and panel.
Usage recommendations
- Use it from M1 to M15. On very high timeframes the columns become too dense to read.
- Wait a few seconds on the first load so tick history can be downloaded.
- If the chart shows too many imbalances, raise the minimum volume and the ratio. If it shows too few, lower them.
- The order book panel only appears on symbols for which your broker provides market depth.
- Use the footprint to confirm context and price structure, not as an isolated trigger.
Frequently asked questions
Does it work on any instrument?
Yes, on any symbol with tick history. The quality of the reading depends on the data your broker delivers: real flow on exchange instruments and a tick-based estimate on CFDs.
Are the numbers real volume?
On exchange instruments with aggressor flags, yes. On CFDs without real volume, the numbers are tick counts classified by price direction.
Does the indicator hide my candles?
By default, yes, to avoid duplicated information. Just turn the option off in the settings, or remove the indicator, and the chart goes back to normal.
Is it heavy on the platform?
Loading is gradual and the number of analyzed candles is configurable. If the chart slows down, reduce the number of candles and columns.
Does it work in the Strategy Tester?
Because it is a visual indicator that relies on ticks, it is recommended to test it on a live chart or a demo account.
Important notice
This indicator is an analysis tool and is not investment advice. Trading financial markets involves risk of capital loss, and past results do not guarantee future results. Test on a demo account before using a live account.
RBM.TRADER
Geopolitics, Fundamentals and Technical Analysis.