• Panoramica
  • Recensioni
  • Commenti
  • Novità

BaseLine Balance

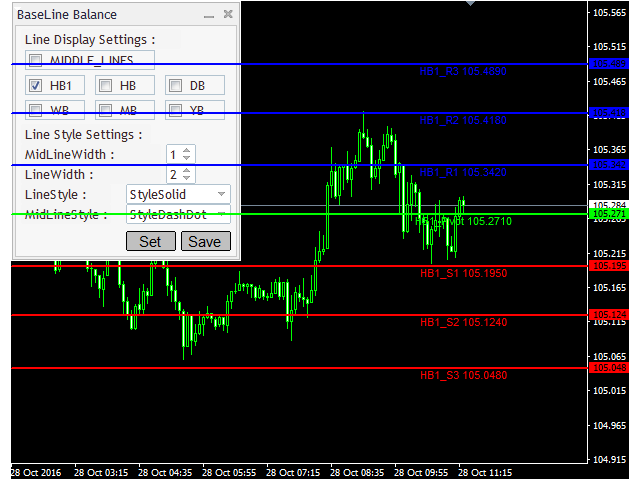
The Baseline Balance tool shows multiple pivot lines for short, mid and long time market cycles. Thus trader can easy identify local or global S/R (support/resistance) levels for better timing of investments and entries to the market. Due to the multifunctional menu directly on chart the settings is fast and accurate. Pivot lines are generated for H1, H4, Daily, Weekly, Monthly, Yearly timeshares.

Menu on chart shows following settings:

Line Display Settings

  • Middle_Lines – shows middle calculation levels for selected time frame
  • HB1 - shows pivot lines calculation, hour time frame
  • HB - shows pivot lines calculation, four-hour time frame
  • DB - shows pivot lines calculation, daily time frame
  • WB - shows pivot lines calculation, weekly time frame
  • MB - shows pivot lines calculation, monthly time frame
  • YB - shows pivot lines calculation, yearly time frame

Line Style Settings

  • MidLineWidth – setting of line width for middle lines
  • LineWidth – setting of line width for pivot lines
  • LinesStyle – setting of line style – solid, dot, dash , dot-and-dash
  • MidLinesStyle – setting of line style – solid, dot, dash , dot-and-dash
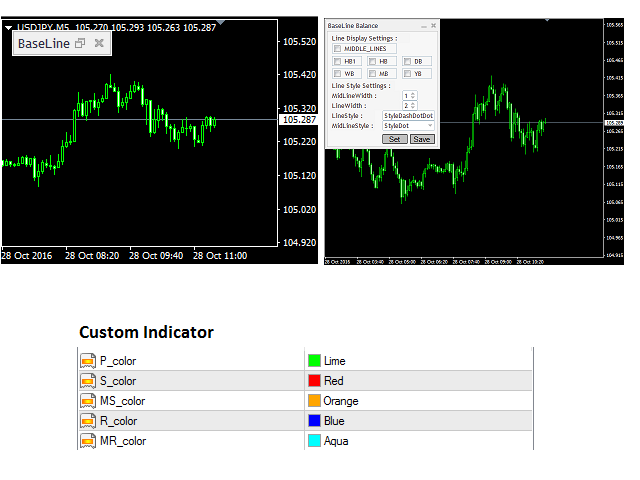
Internal settings

  • P_color – color settings for main pivot lines
  • S_color - color settings for support pivot lines
  • MS_color - color settings for middle support lines
  • R_color - color settings for resistance pivot lines
  • MR_color - color settings for middle resistance lines
Prodotti consigliati
L'indicatore calcola e traccia automaticamente i livelli di supporto e resistenza di Fibonacci, uno degli strumenti più efficaci per l'analisi di mercato. Il calcolo utilizza i dati del prezzo medio per il periodo e l'intervallo di tempo selezionati. Il minimo e il massimo per questo periodo sono presi come inizio e fine del movimento. I livelli di Fibonacci ti consentono di vedere potenziali punti di riferimento, attorno ai quali il movimento dei prezzi può rallentare o invertire, ovvero vengon
KT Horizontal Lines MT4
KEENBASE SOFTWARE SOLUTIONS
In MetaTrader, plotting multiple   horizontal lines   and then tracking their respective price levels can be a hassle. This indicator automatically plots multiple horizontal lines at equal intervals for setting price alerts, plotting support and resistance levels, and other manual purposes. This indicator is suitable for Forex traders who are new and looking for chances to make quick profits from buying and selling. Horizontal lines can help traders find possible areas to start trading when the
In the stock market technical analysis, support and resistance is a concept that the movement of the price of a security will tend to stop and reverse at certain predetermined price levels. Support and resistance levels can be identified on any timeframe. However, the most significant ones are found on the higher time frames, such as daily, weekly, and monthly. This indicator using the weekly OHLC data to identify the relevant levels. This is a support and resistance indicator and providing majo
Awesome Oscillator by Bill Williams with the ability to fine-tune and replace the averaging algorithms of the indicator, which significantly expands the possibilities of using this oscillator in algorithmic trading and brings it closer in its properties to such an indicator as the MACD. To reduce price noise, the final indicator is processed with an additional Smooth averaging. The indicator has the ability to give alerts, send mail messages and push signals when the direction of movement of th
Daily Candle Predictor è un indicatore che prevede il prezzo di chiusura di una candela. L'indicatore è destinato principalmente all'uso sui grafici D1. Questo indicatore è adatto sia per il trading forex tradizionale che per il trading di opzioni binarie. L'indicatore può essere utilizzato come sistema di trading autonomo o può fungere da aggiunta al sistema di trading esistente. Questo indicatore analizza la candela corrente, calcolando alcuni fattori di forza all'interno del corpo della cande
Intraday Levels shows intraday levels grid for intraday trading Shows a grid for the day levels, gives you a guide to know the trend and to measure intraday trades (stop-loss and take-profit). Parameters are: Levels Mode: Basic mode: Shows highest, lowest and middle levels. Advanced mode: Shows highest, lowest, middle and intermediate levels. Fibonacci mode: Shows session Fibonacci retracements levels. Momentum mode: Shows delayed Advanced levels to identify momentum. Smooth Period (Momentum
Ultimate Supply Demand
Ramon Sobrevals Arce
5 (3)
After working during many months, with the help of Neural Networks, we have perfected the ultimate tool you are going to need for identifying key price levels (Supports and Resistances) and Supply and Demand zones. Perfectly suitable to trigger your trades, set up your future actions, decide your Take Profit and Stop Loss levels, and confirm the market direction. Price will always move between those levels, bouncing or breaking; from one zone to another, all the remaining movements are just mark
Indicator. "Indicator wave or Indicator Ma". Using 23 standard indicators and the author's algorithm, the levels of purchases (from 0 to +100) and sales (from 0 to -100) are calculated. Then, using the calculated levels, the "Wave Indicator" draws a wave with 21 moving averages. The wave number is equal to the averaging period of the calculated levels. Waves # 1 - 7 Fast Moving Averages Waves from No. 8 -14 moving averages Waves from No. 15-21 slow moving averages Looking at the figu
Atomic Analyst
Issam Kassas
5 (2)
Innanzitutto, vale la pena sottolineare che questo indicatore di trading non è repaint, non è ridisegno e non presenta ritardi, il che lo rende ideale sia per il trading manuale che per quello automatico. L'Analista Atomico è un indicatore di azione del prezzo PA che utilizza la forza e il momentum del prezzo per trovare un miglior vantaggio sul mercato. Dotato di filtri avanzati che aiutano a rimuovere rumori e segnali falsi, e aumentare il potenziale di trading. Utilizzando più strati di in
FinArk Support and Resistance is an indicator that will detect support and resistance zone that are drawn on the chart by automatic. Supply Demand uses previous price action to identify potential imbalances between buyers and sellers. This trend detection indicator will compliment any strategy and can also be used as an independent tool.  We can enter in good price with this Indicator, in order to follow the   strong demand   on the current instrument. 
Pivot Point Fibo RSJ è un indicatore che traccia le linee di supporto e resistenza del giorno utilizzando i tassi di Fibonacci. Questo spettacolare indicatore crea fino a 7 livelli di supporto e resistenza tramite Pivot Point utilizzando i tassi di Fibonacci. È fantastico come i prezzi rispettino ogni livello di questo supporto e resistenza, dove è possibile percepire possibili punti di entrata/uscita di un'operazione. Caratteristiche Fino a 7 livelli di supporto e 7 livelli di resistenza
FREE
Chart Patterns Detect 15 patterns (Ascending Triangle, Descending Triangle, Rising Wedge, Falling Wedge, Bullish Flag, Bearish Flag, Bullish Rectangle, Bearish Rectangle Symmetrical triangle, Head and Shoulders, Inverted Head and Shoulders, Triple top, Triple Bottom, Double Top, Double Bottom) Use historical data to calculate the probability of each pattern to succeed (possibility to filter notification according to the chance of success) gives graphic indication about the invalidation level and
Trend Ray
Andriy Sydoruk
The indicator shows the potential trend direction by cyclical-wave dependence. Thus, all the rays of the intersection will be optimal rays, in the direction of which the price is expected to move, taking into account the indicator period. Rays can be used as a direction for potential market movement. But we must not forget that the approach must be comprehensive, the indicator signals require additional information to enter the market.
This is a new strategy for SUPPLY DEMAND areas It is based on a calculation using the tick volume to detect the big price action in market for both bear /bull actions this smart volume action candles are used to determine the supply and demand areas prices in between main supply and demand lines indicate sideway market  up arrows will be shown when prices moves above the main supply and the secondary supply lines Down arrows will be shown when prices moves below the main demand and the secondary
Pivots Dashboard
Nesimeye Oswald
5 (3)
Pivots Dashboard is the single most complete instruments set for Pivot Points trading currently available in the market. We have done a comprehensive research prior to the product design to make sure that this product meets every need of Pivot Point trading. Pivots Points are significant levels technical analysts can use to determine directional movement and potential support/resistance levels. Pivot Points are thus predictive or leading indicators. While the points were originally used by floor
This indictor is developed to help traders identify pivot levels in market . Some people also call it support and resistance levels or zones. We have finally publishing the most advanced pivot indicator in mql5 market because it is developed using accurate pivot zones only  . Remember always use bigger timeframes to get strong pivot levels. It will help you reversal trading. Visit our website from here
Price Breakout pattern Scanner is the automatic scanner for traders and investors. It can detect following patterns automatically from your chart. Head and Shoulder - Common tradable pattern. Reverse Head and Shoulder - This pattern is the reverse formation of the Head and Shoulder. Double Top - When the price hits resistance level twice and decline toward the support level, the trader can anticipate sudden bearish breakout through the support level. Double Bottom - The double bottom pattern is
Scalper trend giornaliero (DTS) DTS è un indicatore di tendenza giornaliero che utilizza Price Action, Dynamic Support e Resistances. È progettato per essere utilizzato da chiunque, anche il principiante assoluto nel trading può usarlo. NON ridipinge MAI. Le indicazioni sono date da vicino a vicino. Progettato per essere utilizzato da solo, non sono necessari altri indicatori. Ti dà la tendenza e il potenziale Take Profit all'inizio della giornata. Come funziona DTS utilizza una strategia d
Trend PRO Expert Advisor
Nguyen Tran Ha
1 (1)
Trend PRO Expert Advisor  is developed base on the PipFinite Trend PRO Indicator, the best indicators on the market so far. PipFinite  Trend Pro's smart algorithm detects the trend, filters out market noise and gives entry signals with exit levels.  This EA open order when the indicator has buy/sell signals and set SL/TP follow the indicator rules. You can read more information about PipFinite Trend PRO indicator  here . Important Information   This EA will only work if you purchased  PipFin
Overview Automated market structure identification following SMC and ICT concept, it gives an unprecedented edge on your market structure analysis by automatically identifies valid market structure using smart and powerful structure mapping mechanism: Identify impulsive and corrective moves Identify valid pullbacks built by impulsive and corrective market moves Idenitfy bearish or bullish leg and their inducements Identify valid market structure based on inducement sweep  Identify swing and int
Support and Resistance Barry Indicator - Your Path to Precision Trading Explore the world of precision trading with the "Support and Resistance Barry Indicator" for MetaTrader 4. This robust tool is designed to help you identify key support and resistance levels with exceptional accuracy, enhancing your ability to make well-informed trading decisions. Basic Details : Indicator Type : Support and Resistance Barry Indicator Key Metrics : Real-time identification of crucial support and resistance l
Classic Fractals indicator for MT4, with additional Trendlines connecting the latest couples of fractals ( fractals are showing highest high, and lowest low on each period) Rules for trendlines: -if new top fractal is below the last one = new resistance line -if new bot fractal is above the last one = new support line -Trendlines can be hidden -Fractals can be hidden Fractal Period = can be both even or uneven number, as it is setting for half (one side) of the bars sequence
The Th3Eng PipFinite indicator is based on a very excellent analysis of the right trend direction with perfect custom algorithms. It show the true direction and the best point to start trading. With StopLoss point and Three Take Profit points. Also it show the right pivot of the price and small points to order to replace the dynamic support and resistance channel, Which surrounds the price. And Finally it draws a very helpful Box on the left side on the chart includes (take profits and Stop loss
This EA is an extension for the free trade indicator Trend Mate . https://www.mql5.com/en/market/product/50082 The main idea is to support your decision to  trade  according to the current trend. It is possible to configure alert and push notification to receive when entering to first candle for bull / bear trend. For this extension of the free indicator now it is possible to filter the current trend info with other timeframes. For example show trend for timeframe M5 considering also timefra
FIBOChannels
Hafis Mohamed Yacine
Fibonacci Channel What is a Fibonacci Channel? The Fibonacci channel is a technical analysis tool that is used to estimate support and resistance levels based on the Fibonacci numbers. It is a variation of the Fibonacci retracement tool, except with the channel the lines run diagonally rather than horizontally. It can be applied to both short-term and long-term trends, as well as to uptrend and downtrends. Lines are drawn at 23.6, 38.2, 50, 61.8, 78.6, 100, 161.8, 200, 261.8, 361.8 and 423.6
This indicator draws Horizontal Support and Resistance automatically. It works with any symbol and any timeframe. Stronger Support Lines are displayed in thicker green horizontal lines. In the same way, Stronger Resistance lines are displayed with thicker red lines. Change the timeframe to display the Support and Resistance Lines of various timeframes.
KT Renko Patterns MT4
KEENBASE SOFTWARE SOLUTIONS
2.33 (3)
KT Renko Patterns scans the Renko chart brick by brick to find some famous chart patterns that are frequently used by traders across the various financial markets. Compared to the time-based charts, patterns based trading is easier and more evident on Renko charts due to their uncluttered appearance. KT Renko Patterns features multiple Renko patterns, and many of these patterns are extensively explained in the book titled Profitable Trading with Renko Charts by Prashant Shah. A 100% automate
One Four Four 144
Agustinus Biotamalo Lumbantoruan
This indicator displays support and resistance at fixed levels. The level won't change regardless how many days or minutes has gone by. There are 7 levels start from green ends at gray color. Imagine it like do (green),re,mi,fa,sol,la,si,DO (green) Market often goes one octave from do to DO or fa to FA. You will see this occurring at all markets This indicator can be used to spot your take profit or stop loss target. It can be also used to find support and resistance or supply and demand.
Quantum Heiken Ashi PRO MT4
Bogdan Ion Puscasu
4.43 (7)
Presentazione del       Grafici   Quantum Heiken Ashi PRO Progettate per fornire informazioni chiare sulle tendenze del mercato, le candele Heiken Ashi sono rinomate per la loro capacità di filtrare il rumore ed eliminare i falsi segnali. Dì addio alle confuse fluttuazioni dei prezzi e dai il benvenuto a una rappresentazione grafica più fluida e affidabile. Ciò che rende il Quantum Heiken Ashi PRO davvero unico è la sua formula innovativa, che trasforma i dati tradizionali delle candele in barre
Fibonacci Magic Pivot Levels
Savia Forex Software Solutions
Fibonacci Magic Pivot Levels The  Fibonacci Magic Pivot Levels  is a  powerful yet easy to use indicator . It   continuously monitor s intra-day  price action  and uses complex algorithms to calculate and detect key support, resistance and pivot levels, using the D1 timeframe as a filter.  The    Fibonacci Magic Pivot Levels is optimized for H4, H1, M30, M15, M5 & M1 timeframes and  can be used on ALL Currencies, Indices, Commodities, and Cryptocurrency pairs . Trade with improved confidence an
Gli utenti di questo prodotto hanno anche acquistato
Gann Made Easy
Oleg Rodin
4.92 (52)
Gann Made Easy è un sistema di trading Forex professionale e facile da usare che si basa sui migliori principi del trading utilizzando la teoria di mr. WD Gann. L'indicatore fornisce segnali ACQUISTA e VENDI accurati, inclusi i livelli di Stop Loss e Take Profit. Puoi fare trading anche in movimento utilizzando le notifiche PUSH. Vi prego di contattarmi dopo l'acquisto! Condividerò i miei consigli di trading con te e fantastici indicatori bonus gratuitamente! Probabilmente hai già sentito parlar
ATTUALMENTE SCONTATO DEL 26% La soluzione migliore per ogni principiante o trader esperto! Questo indicatore è uno strumento di trading unico, di alta qualità e conveniente perché abbiamo incorporato una serie di caratteristiche proprietarie e una nuova formula. Con un solo grafico è possibile leggere la forza delle valute per 28 coppie Forex! Immaginate come migliorerà il vostro trading perché sarete in grado di individuare l'esatto punto di innesco di una nuova tendenza o di un'opportunit
TPSproTREND PrO
Roman Podpora
5 (15)
TPSpro TRENDPRO  - is a trend indicator that automatically analyzes the market and provides information about the trend and each of its changes, as well as giving signals for entering trades without redrawing! The indicator uses each candle, analyzing them separately. referring to different impulses - up or down impulse. Exact entry points into transactions for currencies, crypto, metals, stocks, indices!  -  Version MT5               DETAILED DESCRIPTION        /       TRADING SETUPS           
TPSpro RFI Levels
Roman Podpora
5 (13)
A key element in trading is zones or levels from which decisions to buy or sell a trading instrument are made. Despite attempts by major players to conceal their presence in the market, they inevitably leave traces. Our task was to learn how to identify these traces and interpret them correctly. Reversal First Impulse levels (RFI)   -  Version MT5                INSTRUCTIONS                 RUS                 ENG                                       R ecommended to use with an indicator   -  
Scalper Vault
Oleg Rodin
5 (27)
Scalper Vault è un sistema di scalping professionale che ti fornisce tutto il necessario per scalping di successo. Questo indicatore è un sistema di trading completo che può essere utilizzato dai trader di forex e opzioni binarie. L'intervallo di tempo consigliato è M5. Il sistema fornisce segnali di freccia accurati nella direzione della tendenza. Ti fornisce anche i segnali più alti e più bassi e i livelli di mercato di Gann. Gli indicatori forniscono tutti i tipi di avvisi, comprese le notifi
Attualmente 20% di sconto! La soluzione migliore per ogni principiante o trader esperto! Questo software per cruscotti funziona su 28 coppie di valute. Si basa su 2 dei nostri indicatori principali (Advanced Currency Strength 28 e Advanced Currency Impulse). Offre un'ottima panoramica dell'intero mercato Forex. Mostra i valori di forza delle valute avanzate, la velocità di movimento delle valute e i segnali per 28 coppie Forex in tutti i (9) timeframe. Immaginate come migliorerà il vostro t
Scopri il segreto per il trading Forex di successo con il nostro indicatore MT4 personalizzato! Ti sei mai chiesto come raggiungere il successo nel mercato Forex, guadagnando costantemente profitti minimizzando il rischio? Ecco la risposta che hai cercato! Permettici di presentare il nostro indicatore MT4 proprietario che rivoluzionerà il tuo approccio al trading. Versatilità unica Il nostro indicatore è appositamente progettato per gli utenti che preferiscono le formazioni di candele Ren
Trend Screener
STE S.S.COMPANY
4.83 (86)
Indicatore di tendenza, soluzione unica rivoluzionaria per il trading di tendenze e il filtraggio con tutte le importanti funzionalità di tendenza integrate in un unico strumento! È un indicatore multi-timeframe e multi-valuta al 100% non ridipingibile che può essere utilizzato su tutti i simboli/strumenti: forex, materie prime, criptovalute, indici e azioni. Trend Screener è un indicatore di tendenza che segue un indicatore efficiente che fornisce segnali di tendenza a freccia con punti nel gra
FX Power MT4 NG
Daniel Stein
5 (9)
Ricevi il tuo aggiornamento quotidiano sul mercato con dettagli e schermate tramite il nostro Morning Briefing qui su mql5 e su Telegram ! FX Power MT4 NG è la nuova generazione del nostro popolare misuratore di forza delle valute, FX Power. Cosa offre questo misuratore di forza di nuova generazione? Tutto ciò che avete amato dell'FX Power originale IN PIÙ Analisi della forza di ORO/XAU Risultati di calcolo ancora più precisi Periodi di analisi configurabili individualmente Limite di calcolo pe
Presentazione       Quantum Trend Sniper Indicator   , l'innovativo indicatore MQL5 che sta trasformando il modo in cui identifichi e scambi le inversioni di tendenza! Sviluppato da un team di trader esperti con un'esperienza di trading di oltre 13 anni,       Indicatore Quantum Trend Sniper       è progettato per spingere il tuo viaggio di trading verso nuove vette con il suo modo innovativo di identificare le inversioni di tendenza con una precisione estremamente elevata. *** Acquista Quant
Break and Retest
Mohamed Hassan
5 (6)
‍You can visually backtest Break & Retest to see how it behaved in the past!     Manual guide:   Click here $65  for only 4 copies left! Next price is $120 .  This Indicator only places quality trades when the market is really in your favor with a clear break and retest. Patience is key with this price action strategy! After many months of hard work and dedication, we are extremely proud to present you our  Break and Retest price action indicator created from scratch. One of
Scalper Inside PRO
Alexey Minkov
4.75 (55)
SALE NOW! Limited Time Offer! An exclusive indicator that utilizes an innovative algorithm to swiftly and accurately determine the market trend. The indicator automatically calculates opening, closing, and profit levels, providing detailed trading statistics. With these features, you can choose the most appropriate trading instrument for the current market conditions. Additionally, you can easily integrate your own arrow indicators into Scalper Inside Pro to quickly evaluate their statistics and
Currency Strength Wizard è un indicatore molto potente che ti fornisce una soluzione all-in-one per un trading di successo. L'indicatore calcola la potenza di questa o quella coppia forex utilizzando i dati di tutte le valute su più intervalli di tempo. Questi dati sono rappresentati in una forma di indice di valuta facile da usare e linee elettriche di valuta che puoi utilizzare per vedere il potere di questa o quella valuta. Tutto ciò di cui hai bisogno è collegare l'indicatore al grafico che
Quantum Breakout Indicator PRO
Bogdan Ion Puscasu
4.96 (26)
Presentazione       Quantum Breakout PRO   , l'innovativo indicatore MQL5 che sta trasformando il modo in cui scambi le zone di breakout! Sviluppato da un team di trader esperti con un'esperienza di trading di oltre 13 anni,   Quantum Breakout PRO   è progettato per spingere il tuo viaggio di trading a nuovi livelli con la sua strategia innovativa e dinamica della zona di breakout. Quantum Breakout Indicator ti fornirà frecce di segnalazione sulle zone di breakout con 5 zone target di prof
Presentazione dell'indicatore Miraculous Forex: Libera il potere del trading preciso Sei stanco di cercare il miglior indicatore Forex che fornisca risultati eccezionali su tutti i timeframe? Non cercare oltre! L'indicatore Miraculous Forex è qui per rivoluzionare la tua esperienza di trading e portare i tuoi profitti a nuove vette. Basato su tecnologia all'avanguardia e anni di sviluppo accurato, l'indicatore Miraculous Forex si distingue come l'apice di potenza e precisione nel mercato delle v
FX Volume
Daniel Stein
4.6 (35)
Ricevi il tuo aggiornamento quotidiano sul mercato con dettagli e schermate tramite il nostro Morning Briefing qui su mql5 e su Telegram ! FX Volume è il PRIMO e UNICO indicatore di volume che fornisce una visione REALE del sentiment del mercato dal punto di vista del broker. Fornisce informazioni straordinarie su come gli operatori di mercato istituzionali, come i broker, sono posizionati sul mercato Forex, molto più velocemente dei rapporti COT. Vedere queste informazioni direttamente sul vo
Price Action Entry Alerts
Stephen Sanjeeve Sahayam
5 (3)
Questo indicatore controlla ogni barra per la pressione di acquisto o vendita e identifica 4 tipi di modelli di candele con il volume più alto. Queste candele vengono quindi filtrate utilizzando diversi filtri lineari per mostrare segnali di acquisto o vendita. I segnali funzionano meglio, in combinazione con una direzione temporale più elevata e quando scambiati durante le ore ad alto volume. Tutti i filtri sono personalizzabili e funzionano in modo indipendente. Può visualizzare i segnali di
GOLD Impulse with Alert
Bernhard Schweigert
4.56 (9)
Questo indicatore è una super combinazione dei nostri 2 prodotti Advanced Currency IMPULSE with ALERT  +   Currency Strength Exotics . Funziona per tutti i time frame e mostra graficamente l'impulso di forza o debolezza per le 8 valute principali più un simbolo! Questo indicatore è specializzato nel mostrare l'accelerazione della forza delle valute per qualsiasi simbolo come oro, coppie esotiche, materie prime, indici o futures. Primo nel suo genere, qualsiasi simbolo può essere aggiunto
Advanced Supply Demand
Bernhard Schweigert
4.92 (310)
CURRENTLY 26% OFF !! Best Solution for any Newbie or Expert Trader! This indicator is a unique, high quality and affordable trading tool because we have incorporated a number of proprietary features and a new formula. With this update, you will be able to show double timeframe zones. You will not only be able to show a higher TF but to show both, the chart TF, PLUS the higher TF: SHOWING NESTED ZONES. All Supply Demand traders will love it. :) Important Information Revealed Maximize the potenti
PZ Harmonacci Patterns
PZ TRADING SLU
3.43 (7)
This is arguably the most complete harmonic price formation auto-recognition indicator you can find for the MetaTrader Platform. It detects 19 different patterns, takes fibonacci projections as seriously as you do, displays the Potential Reversal Zone (PRZ) and finds suitable stop-loss and take-profit levels. [ Installation Guide | Update Guide | Troubleshooting | FAQ | All Products ] It detects 19 different harmonic price formations It plots primary, derived and complementary Fibonacci pro
TrendMaestro
Stefano Frisetti
5 (2)
nota: questo indicatore e' per METATRADER4, se vuoi la versione per  METATRADER5 questo e' il link:  https://www.mql5.com/it/market/product/108123 TRENDMAESTRO riconosce un nuovo TREND sul nascere, non sbaglia mai. La sicurezza di identificare un nuovo TREND non ha prezzo. DESCRIZIONE TRENDMAESTRO identifica un nuovo TREND sul nascere, questo indicatore prende in esame la volatilita' i volumi ed il momentum per identificare il momento in cui c'e' un'esplosione di uno  opiu' di questi dati
TrendDecoder Premium
Christophe, Pa Trouillas
5 (3)
Identificare i range e le prossime mosse probabili   |  Ottenere i primi segnali e la forza delle tendenze   |  Ottenere uscite chiare prima dell'inversione   |  Individuare i livelli di Fibo che il prezzo testerà Indicatore non tracciante e non ritardato - ideale per il trading manuale e automatizzato - adatto a tutti gli asset e a tutte le unità temporali Offerta limitata nel tempo >>   50% OFF Dopo l'acquisto, contattatemi su questo canale  per le impostazioni personalizzate. Versione   MT5 :
Indicator : RealValueIndicator Description : RealValueIndicator is a powerful tool designed specifically for trading on the EURUSD pair. This indicator analyzes all EUR and USD pairs, calculates their real currency strength values, and displays them as a single realistic value to give you a head start on price. This indicator will tell you moves before they happen if you use it right. RealValueIndicator allows you to get a quick and accurate overview of the EURUSD currency pair tops and bottoms,
Innanzitutto, è importante sottolineare che questo sistema di trading è un indicatore non repainting, non redrawing e non lagging, il che lo rende ideale per il trading professionale. Il "Sistema di Trading di Supporto e Resistenza Intelligente" è un indicatore avanzato progettato per trader nuovi ed esperti. Permette ai trader di ottenere precisione e fiducia sul mercato forex. Questo sistema completo combina più di 7 strategie, 10 indicatori e varie approcci di trading, tra cui strategie di
ICT, SMC, SMART MONEY CONCEPTS, SMART MONEY, Smart Money Concept, Support and Resistance, Trend Analysis, Price Action, Market Structure, Order Blocks, BOS/CHoCH,   Breaker Blocks ,  Momentum Shift,   Supply&Demand Zone/Order Blocks , Strong Imbalance, HH/LL/HL/LH,    Fair Value Gap, FVG,  Premium  &   Discount   Zones, Fibonacci Retracement, OTE, Buy Side Liquidity, Sell Side Liquidity, BSL/SSL Taken, Equal Highs & Lows, MTF Dashboard, Multiple Time Frame, BigBar, HTF OB, HTF Market Structure, 
Royal Scalping Indicator M4
Vahidreza Heidar Gholami
4.17 (6)
Royal Scalping Indicator is an advanced price adaptive indicator designed to generate high-quality trading signals. Built-in multi-timeframe and multi-currency capabilities make it even more powerful to have configurations based on different symbols and timeframes. This indicator is perfect for scalp trades as well as swing trades. Royal Scalping is not just an indicator, but a trading strategy itself. Features Price Adaptive Trend Detector Algorithm Multi-Timeframe and Multi-Currency Trend Low
Advanced Currency IMPULSE with ALERT
Bernhard Schweigert
4.91 (494)
ATTUALMENTE SCONTATO DEL 31%! La soluzione migliore per ogni principiante o trader esperto! Questo indicatore è uno strumento di trading unico, di alta qualità e conveniente perché abbiamo incorporato una serie di caratteristiche proprietarie e una formula segreta. Con un solo grafico fornisce avvisi per tutte le 28 coppie di valute. Immaginate come migliorerà il vostro trading perché sarete in grado di individuare l'esatto punto di innesco di una nuova tendenza o opportunità di scalping!
PTS Divergence Buy Finder
PrecisionTradingSystems
PTS - Divergence Buy Finder di Precision Trading Systems Il Precision Divergence Finder è stato progettato per individuare i minimi di mercato con estrema precisione e lo fa frequentemente. Nell'analisi tecnica, l'arte di individuare i minimi di mercato è generalmente molto più semplice rispetto a individuare i massimi, e questo strumento è progettato appositamente per questa finalità. Dopo aver identificato una divergenza rialzista, è saggio attendere che la tendenza si inverta prima di ac
L'indicatore di vendita PTS Divergence Finder di Roger Medcalf - Precision Trading Systems. Questo indicatore fornisce solo segnali ribassisti - di vendita. In primo luogo, mi è stato chiesto molte volte perché non avessi fornito un indicatore di divergenza di vendita mentre fornivo volentieri un indicatore di ricerca di divergenza di segnali di acquisto da molti anni. Ho risposto che le divergenze di vendita sono meno affidabili delle divergenze di acquisto, cosa che è ancora vera. Alcune soluz
PipFinite Exit Scope
Karlo Wilson Vendiola
4.95 (21)
Did You Have A Profitable Trade But Suddenly Reversed? Exiting a trade is equally important as entering! Exit Scope helps maximize your current trade profit and avoid turning winning trades to losers. Attention Exit Signals are NOT to be used in entering a trade! Exit means closing your trades to avoid correction/reversal which can wipe out existing profit or haunt break-even orders. Please watch presentation (Click Here) Features Generates instant exit signals based on price action, volat
Altri dall’autore
Marcus
Petr Plechac
Marcus = market customization is 3 in 1 indicator. Universal business tool from professional traders that helps visualizing interesting market situations. Preview markets using price action and sentiment in the market. Three tools necessary to understand the market situation and the anticipation of further movement. Finally, you will see what parquet traders see. With these tools, you will see the important supports and resistances. It shows you the entry of big players on the market. The indica
Hidden123Gap (123Gap) is universal business tool from the professional traders that helps to visualize market situation. It previews markets using a price action and a sentiment in the market. The tool is necessary to understand the market situation and the anticipation of further movement. Finally, you will see how traders estimate the market. With this tool, you will see important supports and resistances. It shows you the entry of big players on the market. The indicator works on all timefram
PivotHighLow
Petr Plechac
1 (1)
PivotHighLow. Universal business tool from professional traders that helps to visualize interest market situations. It previews markets using a price action and sentiment in the market. Tool is necessary to understand the market situation and the anticipation of further movement. Finally, you will see how traders estimate the market. With this tool, you will see important supports and resistances. It shows you the entry of big players on the market. The indicator works on all timeframes. You are
InitialBalance. Universal business tool from professional traders that helps to visualize interest market situations. It previews markets using a price action and sentiment in the market. Tool necessary to understand the market situation and the anticipation of further movement. Finally, you will see how traders estimate the market. Who knows the first steps in the market can estimate the point where the market will stop and reflect! With this tool, you will see important supports and resistance
Extender
Petr Plechac
Extender represents a multifunctional indicator which can be used for own investing strategy or can be easily adopted as a part your own investing strategy. After installation as a secondary indicator you can see a multiframe visualization of selected timeframes of analyzed underlying asset. The multiframe visualization has a few modifications which can be selected in section Indicator Setup. Input parameters Indicator setup Timeframes – definition of selected timeframes for visualization, e.g
Sensor
Petr Plechac
Sensor utility is a tool for protecting the capital against unexpected market movements. Today's markets are unpredictable. Are you afraid of big moves? This tool monitors the movements of the market and may remove pending orders or open positions while increased volatility. The utility works with the actual movement of the market. The indicator works on all timeframes. You are not limited by use of different timeframes, the indicator is able to adapt. On the screenshots, you can see basic setti
This is a simple and efficient indicator based on market logic. The indicator creates a range chosen by a trader. Trader selects only two parameters. The first one is the number of candles that define the frame. The second one is the number of candles needed for confirmation frame. The indicator shows all situations in history and works with the actual movement of the market. The indicator works on all timeframes . You are not limited by use of different timeframes, the indicator is able to adap
Manager
Petr Plechac
A new way of managing your trades – efficiently, automatically and with no emotions. Control various markets and manage many different trades at one moment. Grasp your competitive advantage and ultimately find out what profitable trading looks like! Trademanager is a piece of software developed for MT4 platforms. This tool enables you to completely set up all parameters for many different trades on many different markets – at one time and with no emotions as psychological obstacles. Must-need to
Price level alert is a software that gives you an overview of your all drawn levels (supports and resistances) for more than 10 markets in only one elegant table which you can see right in your chart. Price alert is not only this, it also sends you notification (alert) when a market has reached one of your predefined levels. Therefore, this is a must-have tool for all traders who want to cut the time sitting in front of a computer significantly and not to miss any trade. Settings (inputs) Symb
Filtro:
Nessuna recensione
Rispondi alla recensione
Versione 1.2 2021.11.22
New version 2021