Daily Trend Scalper

Scalper trend giornaliero (DTS)

DTS è un indicatore di tendenza giornaliero che utilizza Price Action, Dynamic Support e Resistances.
È progettato per essere utilizzato da chiunque, anche il principiante assoluto nel trading può usarlo.
NON ridipinge MAI.
Le indicazioni sono date da vicino a vicino.
Progettato per essere utilizzato da solo, non sono necessari altri indicatori.
Ti dà la tendenza e il potenziale Take Profit all'inizio della giornata.

Come funziona
DTS utilizza una strategia di breakout combinata con un'azione sui prezzi e supporto e resistenze dinamici.
L'andamento notturno e la volatilità vengono analizzati per essere utilizzati durante il giorno successivo.
Da questa analisi vengono determinati i limiti di breakout (linee blu e arancio scuro) e anche il Take Profit
Il "successo" della strategia e delle impostazioni può essere verificato istantaneamente grazie ai dati dello Storico.
La parte storica permette di vedere immediatamente se ci sono dei "buchi" nella strategia ed eventualmente selezionare un altro TimeFrame o Simbolo che si adatterebbe meglio.
In tempo reale dalla chiusura della candela alla chiusura della candela l'indicatore di tendenza attende che le condizioni del segnale siano valide e poi lo mostra con una freccia (verde per acquisto e arancione per vendita).
Le linee tratteggiate rosse indicano dove posizionare il Take Profit e l'eventuale Stop Loss.
Gli scambi sono indicati uno per uno, non ci sono mai due scambi contemporaneamente.
La maggior parte degli scambi (80%) sono terminati durante il giorno.


DTS indica:
Per tutti i simboli selezionati sul carrello:
Dove aprire le tue operazioni.
Prendi profitto e ferma la perdita.
La quantità potenziale di semi che possono essere catturati.


DTS funziona
Con qualsiasi strumento come coppie FX, indici, metalli, futures o qualsiasi altro se le quotazioni vengono fornite durante la notte.
Da M15 a H1.
Con qualsiasi broker.


Funzionalità DTS
Segnali di acquisto/vendita affidabili.
Ingressi molto semplici.
Avviso su schermo + Notifiche push + Notifiche e-mail
Tutte le notifiche sono molto dettagliate e danno anche Take Profit, permette di fare trading da un dispositivo mobile.
L'indicatore integrato viene visualizzato su un grafico collegato facendo clic su un simbolo.


Come usare DTS
Mettilo sul tuo grafico (s).
Basta seguire le frecce e le indicazioni Take Profit/Stop Loss.


Ingressi
ShowForex: [Bool] Verrà mostrato, fasle nasconderà i simboli Forex
ForexColor: [Color] Seleziona il colore dei simboli Forex
Fx Meat Start: [Integer] Immettere qui l'ora per l'inizio del trend notturno. Il valore predefinito è l'una; si adatta alla maggior parte delle coppie Fx quotate da 0 a 23:59.
FX Meat End: [Integer] Immettere qui l'ora per la fine del trend notturno e l'inizio della sessione di scambio. Il valore predefinito si adatta alla maggior parte degli strumenti.
ShowCFD: [Bool] Verrà visualizzato, fasle nasconderà i simboli CFD
CFDColor: [Color] Seleziona il colore dei simboli CFD
CFD Meat Start: [Intero] Immettere qui l'ora per l'inizio del trend notturno. Il valore predefinito è l'una.
CFD Meat End: [Integer] Inserisci qui l'ora per la fine del trend notturno e l'inizio della sessione di trading. Il valore predefinito si adatta alla maggior parte degli strumenti.
Fine sessione CFD: [Intero] Non mostrerà le negoziazioni dopo questo tempo.
Lo stesso per future e indici.
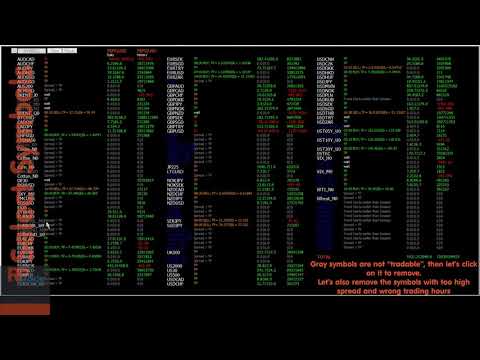
Mostra solo negoziabili: [Bool] True mostrerà solo i simboli che possono essere scambiati, false mostrerà tutti i simboli
Lotsize [Doppio] Utilizzato per il calcolo del profitto
Divisore: [Double] Divide la distanza tra Trend Start e Trend End per calcolare Take Profit e SL. Il valore predefinito è 3, significa che TP e SL saranno 1/3 della distanza di volatilità notturna.
Consenti rendimenti commerciali [Bool] : True consentirà la restituzione degli scambi se il prezzo sta andando nella direzione opposta, False manterrà la direzione iniziale
Modalità di trading: [Intero] Preciso = 0; Wild = 1; Super Preciso =2, Rigoroso Giornaliero =3
Mostra il grafico dei profitti: [Bool] true = mostra il grafico dei profitti, false = non mostra.

Test
IMPORTANTE! SI PREGA DI GUARDARE IL VIDEO TUTORIAL PER IL TEST
Video Daily Trend Scalper
Prodotti consigliati
Gold Titan King Scalper
Dodong Christian Arnon
Indicator Description GOLD TITAN KING SIGNAL INDICATOR High-Precision Gold Scalping Buy/Sell Signals – Manual Trading Assistant Overview The Gold Titan King Signal Indicator is a manual trading assistant tool designed for high-frequency scalping on Gold (XAUUSD) and other major pairs. It generates clear BUY/SELL signals with precise entry levels, along with adjustable Stop Loss and Take Profit levels displayed directly on the chart. ️ This tool is NOT an EA. It does not execute trades
L'indicatore SMC Venom Model BPR è uno strumento professionale per i trader che operano nell'ambito del concetto di Smart Money (SMC). Identifica automaticamente due modelli chiave sul grafico dei prezzi: FVG   (Fair Value Gap) è una combinazione di tre candele, in cui c'è un gap tra la prima e la terza candela. Forma una zona tra livelli in cui non c'è supporto di volume, il che spesso porta a una correzione dei prezzi. BPR   (Balanced Price Range) è una combinazione di due modelli FVG che for
Owl smart levels
Sergey Ermolov
4.24 (37)
Versione MT5  |  FAQ L' indicatore Owl Smart Levels   è un sistema di trading completo all'interno dell'unico indicatore che include strumenti di analisi di mercato popolari come i   frattali avanzati di Bill Williams , Valable ZigZag che costruisce   la corretta struttura a onde   del mercato, e i   livelli di Fibonacci che segnano i livelli esatti di entrata nel mercato e luoghi per prendere profitti. Descrizione dettagliata della strategia Istruzioni per lavorare con l'indicatore Consulente-
Auto Fibo Pro m
DMITRII GRIDASOV
Indicatore "Auto FIBO Pro" Crypto_Forex: è un ottimo strumento ausiliario nel trading! - L'indicatore calcola e posiziona automaticamente sul grafico i livelli di Fibo e le linee di tendenza locali (colore rosso). - I livelli di Fibonacci indicano le aree chiave in cui il prezzo può invertirsi. - I livelli più importanti sono 23,6%, 38,2%, 50% e 61,8%. - Puoi usarlo per lo scalping di inversione o per il trading di zone grid. - Ci sono molte opportunità per migliorare il tuo sistema attuale us
Indicatore Crypto_Forex "Morning Star pattern" per MT4. - L'indicatore "Morning Star pattern" è un indicatore molto potente per il trading Price Action: nessuna rielaborazione, nessun ritardo. - L'indicatore rileva i pattern rialzisti Morning Star sul grafico: segnale freccia blu sul grafico (vedi immagini). - Con avvisi su PC, dispositivi mobili ed e-mail. - È disponibile anche il suo fratello, l'indicatore ribassista "Evening Star pattern" (segui il link qui sotto). - L'indicatore "Morning S
Daily Candle Predictor è un indicatore che prevede il prezzo di chiusura di una candela. L'indicatore è destinato principalmente all'uso sui grafici D1. Questo indicatore è adatto sia per il trading forex tradizionale che per il trading di opzioni binarie. L'indicatore può essere utilizzato come sistema di trading autonomo o può fungere da aggiunta al sistema di trading esistente. Questo indicatore analizza la candela corrente, calcolando alcuni fattori di forza all'interno del corpo della cande
Happy Scalping Indicator
Leandro Bernardez Camero
Questo indicatore è stato progettato per uno scalping aggressivo e per entrate rapide nelle opzioni binarie , generando segnali su ogni candela in modo da sapere esattamente cosa sta succedendo in ogni momento. Unisciti al canale Happy Scalping: MQL5 Non ripinta : il segnale della candela attuale viene generato in tempo reale , il che significa che può cambiare mentre la candela è ancora in formazione, a seconda che il prezzo salga o scenda rispetto alla chiusura della candela precedente. Tutt
QuantumEdge Trader
Hossam Ali Ahmed Ali
QuantumEdge Trader v1.0 AI-Powered Precision Signals for Serious Traders QuantumEdge Trader is a smart and reliable indicator that delivers accurate BUY and SELL signals using advanced market analysis and trend detection. Designed for M1 to M60 timeframes, it's ideal for scalping and intraday strategies. --- Key Features: No Repaint – Signals never change after appearing Smart trend filters to reduce noise Adjustable sensitivity and alerts Perfect for XAUUSD, EURUSD, and m
EARLY REMINDER: The Starting price is 65 price will rise soon up to 365$ and then 750$ after first 10 copies of sales. Grab this offer now! Introduction Hello, traders! Welcome to the demonstration of the Forex Beast Indicator , a comprehensive tool designed to assist aspiring traders in navigating the complexities of the forex market. This indicator incorporates seven essential components to provide a well-rounded trading experience: Moving Averages Colored Zones Support and Resistance Levels
This is a new strategy for SUPPLY DEMAND areas It is based on a calculation using the tick volume to detect the big price action in market for both bear /bull actions this smart volume action candles are used to determine the supply and demand areas prices in between main supply and demand lines indicate sideway market  up arrows will be shown when prices moves above the main supply and the secondary supply lines Down arrows will be shown when prices moves below the main demand and the secondary
Super Reversal Pattern
Parfait Mujinga Ndalika
Super Reversal Pattern Indicator Unlock the power of advanced pattern recognition with our Super Reversal Pattern Indicator. Designed for traders seeking precision and reliability, this indicator identifies one of the most effective reversal patterns in technical analysis, offering a significant edge in your trading strategy. Key Features: Non-Repainting Accuracy: Enjoy the confidence of non-repainting technology. Once a Super Reversal Pattern is detected, it remains static, providing consiste
Trendlines Chart Patterns Indicator (MT4) Automated Chart Patterns & Breakout Signals for MT4: Trade with Precision! The "Trendlines Chart Patterns Indicator" is an advanced trading tool for MetaTrader 4 (MT4) , meticulously designed to identify high-probability buy and sell signals based on dynamically forming, robust trend lines and popular chart patterns . This powerful forex indicator automates the complex process of identifying patterns like triangles, flags, ranges, ascending/descending tr
PZ Mean Reversion MT4
PZ TRADING SLU
3 (4)
Indicatore unico che implementa un approccio professionale e quantitativo al trading di reversione. Sfrutta il fatto che il prezzo devia e ritorna alla media in modo prevedibile e misurabile, il che consente regole di entrata e uscita chiare che superano di gran lunga le strategie di trading non quantitative. [ Installation Guide | Update Guide | Troubleshooting | FAQ | All Products ] Segnali di trading chiari Incredibilmente facile da scambiare Colori e dimensioni personalizzabili Implementa l
Awesome Oscillator by Bill Williams with the ability to fine-tune and replace the averaging algorithms of the indicator, which significantly expands the possibilities of using this oscillator in algorithmic trading and brings it closer in its properties to such an indicator as the MACD. To reduce price noise, the final indicator is processed with an additional Smooth averaging. The indicator has the ability to give alerts, send mail messages and push signals when the direction of movement of th
Traccia automaticamente i livelli di Fibonacci, basati sui prezzi Massimo e Minimo del timeframe specificato Più barre   possono essere unite: ad esempio, puoi ottenere un Fibonacci basato sui Massimi e Minimi di 10 giorni Il mio   #1   Strumento : 66+ funzionalità, incluso questo indicatore  |   Contattami  per qualsiasi domanda  |    Versione MT5 Aiuta a identificare potenziali livelli di inversione; I pattern formati ai livelli di Fibonacci tendono a essere più forti; Riduce   notevolmente  
The Th3Eng PipFinite indicator is based on a very excellent analysis of the right trend direction with perfect custom algorithms. It show the true direction and the best point to start trading. With StopLoss point and Three Take Profit points. Also it show the right pivot of the price and small points to order to replace the dynamic support and resistance channel, Which surrounds the price. And Finally it draws a very helpful Box on the left side on the chart includes (take profits and Stop loss
This EA is an extension for the free trade indicator Trend Mate . https://www.mql5.com/en/market/product/50082 The main idea is to support your decision to  trade  according to the current trend. It is possible to configure alert and push notification to receive when entering to first candle for bull / bear trend. For this extension of the free indicator now it is possible to filter the current trend info with other timeframes. For example show trend for timeframe M5 considering also timeframe
L'indicatore Morning Star PRT utilizza il principio di breakout mattutino piatto. L'indicatore visualizza i livelli di piatto mattutino e mostra i possibili obiettivi. È stato aggiunto un ulteriore livello di Fibonacci all'indicatore, nonché avvisi sonori sull'intersezione di entrambi i livelli obiettivo specificati nelle impostazioni e il livello di piatto notturno. L'indicatore Morning Star PRT crea un canale di piatto notturno alla fine della notte, nonché due livelli di prezzo di Fibonacci
This product is a part of  ON Trade Waves Patterns Harmonic Elliot Wolfe you can test free version on EURJPY from this link  Wolf Waves Indicator Scopri le Onde del Lupo - Il tuo Ultimo Strumento di Trading! Sei alla ricerca di uno strumento potente per individuare facilmente le Onde del Lupo su qualsiasi intervallo di tempo? Non cercare oltre! Il nostro indicatore delle Onde del Lupo fa il lavoro in modo impeccabile. Ecco perché è perfetto per te: Caratteristiche Principali: Rilevamento Autom
Indicatore Crypto_Forex "Force Index con zone dinamiche di ipervenduto/ipercomprato" per MT4, senza ridisegno. - Force Index è uno degli indicatori principali che combina i dati di prezzo e volume in un singolo valore. - È fantastico per prendere le negoziazioni di vendita dalla zona dinamica di ipercomprato e le negoziazioni di acquisto dalla zona dinamica di ipervenduto. - Questo indicatore è eccellente per il trading di momentum nella direzione del trend. - Zona dinamica di ipercomprato - s
Innanzitutto, vale la pena sottolineare che questo Strumento di Trading è un Indicatore Non-Ridipingente, Non-Ridisegnante e Non-Laggante, il che lo rende ideale per il trading professionale. Corso online, manuale utente e demo. L'Indicatore Smart Price Action Concepts è uno strumento molto potente sia per i nuovi che per i trader esperti. Racchiude più di 20 utili indicatori in uno solo, combinando idee di trading avanzate come l'Analisi del Trader del Circolo Interno e le Strategie di Trading
Trend PA
Mikhail Nazarenko
5 (3)
The Trend PA indicator uses   Price Action   and its own filtering algorithm to determine the trend. This approach helps to accurately determine entry points and the current trend on any timeframe. The indicator uses its own algorithm for analyzing price changes and Price Action. Which gives you the advantage of recognizing, without delay, a new nascent trend with fewer false positives. Trend filtering conditions can be selected in the settings individually for your trading style. The indicator
Royal Dutch Skunk
Sayan Vandenhout
ROYAL DUTCH SKUNK USES THE TREND WAVE INDICATOR AND IT CAN IDENTIFY THE BEGINNING AND THE END OF A NEW WAVE TREND MOVEMENT. AS AN OSCILLATOR, THE INDICATOR IDENTIFIES THE OVERBOUGHT AND OVERSOLD ZONES. IT WORKS GREAT TO CATCH THE SHORT TERM PRICE REVERSALS AND USES A MARTINGALE STRATEGY TO CLOSE ALL TRADES IN PROFIT. USE DEFAULT SETTINGS ON H1 OR HIGHER TIME FRAME ON ANY PAIR FOR MORE ACCURATE TRADES WHY THIS EA : Smart entries calculated by 6 great strategies The EA can be run on even a $20000
GeoWprPro
Georgij Komarov
WPR by Profile, or WPR for Professionals Geo_WprPro is one of the well-known currency profile indicators. It simultaneously displays two WPR indicators with different parameters in the matrix form on all timeframes of multiple currency pairs forming the currency profile . As follows from the description, " WPR is a leading indicator that often goes ahead of the price chart. The oscillator frequently reaches extreme values before the price reversal as if anticipating that event: it almost always
Cosmic Diviner X Planet
Olena Kondratenko
4 (2)
This unique multi-currency strategy simultaneously determines the strength of trends and market entry points, visualizing this using histograms on the chart. The indicator is optimally adapted for trading on the timeframes М5, М15, М30, Н1. For the convenience of users, the indicator renders the entry point (in the form of an arrow), recommended take profit levels (TP1, TP2 with text labels) and the recommended Stop Loss level. The take profit levels (TP1, TP2) are automatically calculated for
Fibonacci retracement and extension line drawing tool Fibonacci retracement and extended line drawing tool for MT4 platform is suitable for traders who use  golden section trading Advantages: There is no extra line, no too long line, and it is easy to observe and find trading opportunities Trial version: https://www.mql5.com/zh/market/product/35884 Main functions: 1. Multiple groups of Fibonacci turns can be drawn directly, and the relationship between important turning points can be seen
L'indicatore dei livelli di trading è un sistema di trading progettato per determinare i punti di ingresso, mantenere posizioni e la direzione del trend. Include diversi meccanismi che funzionano in un unico complesso, analisi delle onde della direzione del trend, analisi del livello durante la costruzione dei segnali, mostra possibili obiettivi TP e SL. Funzionalità dell'indicatore Le frecce di segnale appaiono sulla candela corrente e non vengono ricolorate. Utilizza algoritmi speciali per c
Signal trend indicator. Detects the direction of the trend and is coloured accordingly.  Has built in audible and visual alerts when trends change. Can send notifications to your phone or email. Allows Trend and Counter-Trend trading. Works on all timeframes, all currency pairs, metals, indices and cryptocurrencies. Can be used with binary options. Distinctive features No re-drawing; Simple and clear settings; Four types of alerts; Works on all timeframes and all trading tools; Suitable
RSI Speed mp
DMITRII GRIDASOV
Indicatore Crypto_Forex "RSI SPEED" per MT4 - ottimo strumento predittivo, senza bisogno di ridisegnare. - Il calcolo di questo indicatore si basa su equazioni fisiche. L'RSI SPEED è la derivata prima dell'RSI stesso. - L'RSI SPEED è ottimo per scalping di ingresso nella direzione del trend principale. - Usalo in combinazione con un indicatore di trend appropriato, ad esempio HTF MA (come nelle immagini). - L'indicatore RSI SPEED mostra la velocità con cui l'RSI cambia direzione: è molto sensi
PZ Harmonacci Patterns
PZ TRADING SLU
3.17 (6)
Trade smarter, not harder: Empower your trading with Harmonacci Patterns This is arguably the most complete harmonic price formation auto-recognition indicator you can find for the MetaTrader Platform. It detects 19 different patterns, takes fibonacci projections as seriously as you do, displays the Potential Reversal Zone (PRZ) and finds suitable stop-loss and take-profit levels. [ Installation Guide | Update Guide | Troubleshooting | FAQ | All Products ] It detects 19 different harmonic pric
Gli utenti di questo prodotto hanno anche acquistato
FFx Engulfing Setup Alerter gives trade suggestions with Entry, Target 1, Target 2 and StopLoss. Below are the different options available: Entry suggestion - pips to be added over the break for the entry 3 different options to calculate the SL - by pips, by ATR multiplier or at the pattern High/Low 3 different options to calculate the 2 TPs - by pips, by ATR multiplier or at Risk/Reward Offset the dashboard - any place on the chart Remove the suggestion once the price reached the SL line Lines
FFx InsideBar Setup Alerter gives trade suggestions with Entry, Target 1, Target 2 and StopLoss. Below are the different options available: Entry suggestion - pips to be added over the break for the entry Minimum candle size - to avoid too close buy/sell entry suggestions 3 different options to calculate the SL - by pips, by ATR multiplier or at the pattern High/Low 3 different options to calculate the 2 TPs - by pips, by ATR multiplier or at Risk/Reward Offset the dashboard - any place on the c
FFx OutsideBar Setup Alerter gives trade suggestions with Entry, Target 1, Target 2 and StopLoss. Below are the different options available: Entry suggestion - pips to be added over the break for the entry. 3 different options to calculate the SL - by pips, by ATR multiplier or at the pattern High/Low. 3 different options to calculate the 2 TPs - by pips, by ATR multiplier or at Risk/Reward. Offset the dashboard - any place on the chart. Remove the suggestion once the price reached the SL line.
FFx PinBar Setup Alerter gives trade suggestions with Entry, Target 1, Target 2 and StopLoss. Below are the different options available: Entry suggestion - pips to be added over the break for the entry Minimum candle size - to avoid too small candles 3 different options to calculate the SL - by pips, by ATR multiplier or at the pattern High/Low 3 different options to calculate the 2 TPs - by pips, by ATR multiplier or at Risk/Reward Offset the dashboard - any place on the chart Remove the sugges
The purpose of this new version of the MT4 standard indicator provided in your platform is to display in a sub-window multiple timeframes of the same indicator with its divergences. See the example shown in the picture below. But the display isn't like a simple MTF indicator. This is the real display of the indicator on its timeframe. Here's the options available in the FFx divergences indicator: Select the timeframes to be displayed (M1 to Monthly) Define the width (number of bars) for each tim
The purpose of this new version of the MT4 standard indicator provided in your platform is to display in a sub-window multiple timeframes of the same indicator with its divergences. See the example shown in the picture below. But the display isn't like a simple MTF indicator. This is the real display of the indicator on its timeframe. Here's the options available in the FFx divergences indicator: Select the timeframes to be displayed (M1 to Monthly). Define the width (number of bars) for each ti
The FFx Dashboard MTF alerter will show you on a single chart all the timeframes (M1 to Monthly) with their own status for the indicator. 2 Alert Options: Single timeframe: each selected timeframe alert separately when a signal occurs Multi timeframes: all selected timeframes must agree for an alert to be triggered Both options have an input to select the timeframes to be used for the alert(s). How to Understand the Status: Green/Red square: histogram above/below 0 line Green square + Red bord
The FFx Dashboard MTF alerter will show you on a single chart all the timeframes (M1 to Monthly) with their own status for the indicator. 2 Alert Options: Single timeframe: each selected timeframe alert separately when a signal occurs Multi timeframes: all selected timeframes must agree for an alert to be triggered Both options have an input to select the timeframes to be used for the alert(s). How to understand the status: Green/Red square: RSI above/below 50 line Green square + Red border: R
The FFx Dashboard MTF alerter will show you on a single chart all the timeframes (M1 to Monthly) with their own status for the indicator. 2 Alert Options: Single timeframe: each selected timeframe alert separately when a signal occurs Multi timeframes: all selected timeframes must agree for an alert to be triggered Both options have an input to select the timeframes to be used for the alert(s). How to understand the status: Green/Red square: Stoch above/below 50 line Green square + Red border:
The FFx Dashboard MTF alerter will show you on a single chart all the timeframes (M1 to Monthly) with their own status for the indicator. 2 Alert Options: Single timeframe: each selected timeframe alert separately when a signal occurs Multi timeframes: all selected timeframes must agree for an alert to be triggered Both options have an input to select the timeframes to be used for the alert(s). How to understand the status: Green/Red square: Price above/below Cloud (Kumo) Green square + Red bo
The FFx Dashboard MTF alerter will show you on a single chart all the timeframes (M1 to Monthly) with their own status for the indicator. 2 Alert Options: Single timeframe: each selected timeframe alert separately when a signal occurs Multi timeframes: all selected timeframes must agree for an alert to be triggered Both options have an input to select the timeframes to be used for the alert(s). How to understand the status: Green/Red square: MA pointing Up/Down Green square + Red border: MA po
The FFx Dashboard MTF alerter will show you on a single chart all the timeframes (M1 to Monthly) with their own status for the indicator. 2 Alert Options: Single timeframe: each selected timeframe alert separately when a signal occurs. Multi timeframes: all selected timeframes must agree for an alert to be triggered. Both options have an input to select the timeframes to be used for the alert(s). How to understand the status: Green square: Price above PSAR Red square: Price below PSAR Options
The FFx Dashboard MTF alerter will show you on a single chart all the timeframes (M1 to Monthly) with their own status for the indicator. 2 Alert Options: Single timeframe: each selected timeframe alert separately when a signal occurs Multi timeframes: all selected timeframes must agree for an alert to be triggered Both options have an input to select the timeframes to be used for the alert(s). How to understand the status: Green/Red square: CCI above/below levels (ie. 100/-100) Grey square: C
The FFx Dashboard MTF alerter will show you on a single chart all the timeframes (M1 to Monthly) with their own status for the indicator. 2 Alert Options: Single timeframe: each selected timeframe alert separately when a signal occurs Multi timeframes: all selected timeframes must agree for an alert to be triggered Both options have an input to select the timeframes to be used for the alert(s). How to understand the status: Green/Red square: ADX above level Grey square: ADX below level Red bor
The FFx Dashboard MTF alerter will show you on a single chart all the timeframes (M1 to Monthly) with their own status. 2 Alert Options: Single timeframe: each selected timeframe alert separately when a signal occurs Multi timeframes: all selected timeframes must agree for an alert to be triggered Both options have an input to select the timeframes to be used for the alert(s). How to understand the status: Green/Red square: bullish/bearish candle Options available in the FFx Dashboard Alerter
The [GRAFF] III manual trading system is based on multiple MetaTrader (MT4) indicators. Together, the entire PACK of GRAFF III indicators makes an advanced trading tool. The system consists of over 20 different custom-built indicators which have been carefully selected and tested in the long term to produce strong and efficient trading signals. The particular indicators are based on different mathematical formulas, so the entire system is calibrated to remove false signals from its own indicator
FFx Universal Strength Meter PRO is more than a basic strength meter. Instead of limiting the calculation to price, it can be based on any of the 19 integrated strength modes + 9 timeframes. With the FFx USM, you are able to define any period for any combination of timeframes. For example, you can set the dashboard for the last 10 candles for M15-H1-H4… Full flexibility! Very easy to interpret... It gives a great idea about which currency is weak and which is strong, so you can find the best pai
FFx Basket Scanner
Eric Venturi-Bloxs
MetaTrader 5 version available here : https://www.mql5.com/en/market/product/24882 FFx Basket Scanner is a global tool scanning all pairs and all timeframes over up to five indicators among the 16 available. You will clearly see which currencies to avoid trading and which ones to focus on. Once a currency goes into an extreme zone (e.g. 20/80%), you can trade the whole basket with great confidence. Another way to use it is to look at two currencies (weak vs strong) to find the best single pairs
MetaTrader 5 version available here: https://www.mql5.com/en/market/product/25794 FFx Pivot SR Suite PRO is a complete suite for support and resistance levels. Support and Resistance are the most used levels in all kinds of trading. Can be used to find reversal trend, to set targets and stop, etc. The indicator is fully flexible directly from the chart 4 periods to choose for the calculation: 4Hours, Daily, Weekly and Monthly 4 formulas to choose for the calculation: Classic, Camarilla, Fibonac
Sweet Waffle
Christophe Godart
The arrows are calculated with: -     2 Parabolic  parameters -     2 ADX parameters -     4 Stochastic parameters We recommend to combine it with Parabolic, ZigZag or Elliot waves indicator. Always trade the trend! If you make sure to draw your trend lines and support/resistance zones you will just have to wait for the signal to appear. Take the trade. For Binary Options it is advisable to set the expiry time to 5-15 min in M1 chart. THIS INDICATOR IS ZERO REPAINT Best assets to trade: - EUR
Let´s try to make some real money! Call me profit addicted. I thought why not try to make THE dream come reality. With discipline, a clear strategy and this indicator I focus on entering the perfect trades. This indicator is very easy to use as you will get perfect entry points for Put or Call trades. The arrows are calculated with: -     Momentum  parameters -     Candle stick patterns -     Fundamental Price action We recommend to combine it with Parabolic, ZigZag or Elliot waves indicator
Golden Chip
Daishon Cotman
Golden Chip provides Basic Market Structure, Fibonacci, supply and Demand Zones. Letting you identify when a sell off point is approaching or whne a buy opportunity is arriving. The awesome thing about Golden Chip is that, you will see rejection levels or continuation before ANYBODY ! This indicator moves directly with price and lines up perfectly with the Chart. Some indicators would lag but NOT this one ! Golden Chip is amazing for Clean chart (Naked Chart). GOLDEN CHIP IS ONLY ON METATRADER (
Namiri Trade Engine is an ALL in ONE trading system that combines price structure, volume pressure, market condition & risk management to give you the BEST opportunities for A+ trade setups with auto lot size WAIT FOR YOUR A+ SETUP || ONLY TAKE YOUR A+ TRADE || RINSE REPEAT YOUR A+ MOVE Chart Features Panel - Shows the asset, market, price, pip, account, trade & profit|loss information Structure - Shows areas of support & resistance Risk Management - Shows risk analysis period of 100 bars, buy
***** The REAL , ORIGINAL, Non-Repainting, Non-Delaying, Arrow Trade Entry indicator for Very Low-Risk market execution ***** ***This is the Golden standard in arrow indicators for MT4.*** BING Setup Arrows Indicator(BSA) will show easy-to-read High Probability trading situations with Non-Repainting , Non-Delaying , Up or Down arrows on the graph.  So simple, it's brilliant. Always shows very good trading setups, no flashy colors, confusing configurations, hard-to-read dashboards, etc.  Perfec
****** Easy to understand, correct Trade direction indicator, quick and easy to visualize******* BING Proper Path Indicator(BPP) will show BUY/SELL signals on-screen in an easy-to-understand 'Traffic Light' format. Provides a final 'reassurance' and 'peace of mind' for taking an educated, high probability, low-risk, trade decision. In the same way, you use a rearview mirror for instantaneous information while taking a driving decision, the same way BING Proper Path Indicator(BPP) will help you
Risk Reward ratio indicator for MT4  BING Risk Reward indicator is a powerful, basic, very needed tool for every trader. Clearly visualize Open Price , Stop Loss , and Top Profit levels on your graphs with easy-to-see colors and trendlines. Does BING Risk Reward show alerts? Of course! BING Risk Reward Indicator offers all Alerts available for the MT4 platform(Email, Popups, Sound, and Push). It shows alerts on Open Price , Stop Loss , and Top Profit. That way, besides easily seeing what is go
The channels
Mansour Rahkhofteh
Counter trade type indicator. Jcounter can capture the timing of the trend collapse phase. There are signs of a trend collapse. It is the world standard to confirm the sign with LSMA adopted by Jcounter. The numerical setting of LSMA is very important, but after many years of verification, the numerical value was identified and completed. When the trend starts, the rising market moves like a support, and the falling market moves like a resistance. Gradually overtake the candlestick and
Altri dall’autore
PipsMinerFast
Remi Passanello
3 (2)
PipsMinerFast is mainly a trend follower with a bit of price action. At first sight, you will think: "Oh well, one more indi showing everything I've missed today but not giving a clue about what will happen..." Okay, you can believe this when just looking at it but start a test it and you will see that PipsMinerFast: Shows you the trend immediately Is not repainting Has minimum lagging Counts pips immediately Adapts to your spread level Works from M1 to H1 Is heading in the right direction 90% o
Scalp Tool
Remi Passanello
5 (1)
Scalp Tool è un indicatore di controtendenza molto efficiente. È progettato per essere utilizzato da chiunque, anche il principiante completo del trading può usarlo. Lo strumento per il cuoio capelluto non si ridipinge. Le indicazioni sono fornite da vicino a vicino o da vicino a un livello visibile. Lo strumento per il cuoio capelluto può essere utilizzato da solo, non sono necessari altri indicatori. Strumento per il cuoio capelluto indica Dove aprire le tue operazioni. Quando chiuderli. D
Trend Wave
Remi Passanello
5 (5)
Trend Wave è uno strumento di trading avanzato; indicatore di trend e counter trade basato su Supporti e Resistenze. Trend Wave è progettato per avere un trading attivo in qualsiasi momento Trend Wave non è in ritardo Le indicazioni vengono fornite all'inizio di una nuova candela Trend Wave indica La finestra dell'indicatore mostra il conteggio effettivo di S e R per ottenere la tendenza generale La linea bianca mostra la tendenza istantanea. Nella finestra principale del grafico, vengono vi
Trend Compound
Remi Passanello
3 (2)
Trend Compound is a trend indicator using a mix of 3 internal other indicators. Please have a look at "how to test in the tester" at the bottom of this page before to test. It's designed to be used by anyone, even the complete newbie in trading can use it. Trend Compound does not repaint . Indications are given from close to close. Trend Compound can be used alone , no other indicators are required. Trend Compound indicates Where to open your trades. When to close them. The potential quantity o
È progettato per essere utilizzato da chiunque, anche il principiante assoluto nel trading può usarlo. NON ridipinge MAI. Le indicazioni sono date da vicino a vicino. Progettato per essere utilizzato da solo, non sono necessari altri indicatori. Ti dà la tendenza e il potenziale Take Profit all'inizio della giornata. Un grafico specifico mostra il potenziale profitto in base ai dati storici. Come funziona Breakout Pro Scalper Solution utilizza una strategia di breakout combinata con azione su
Waxter D1
Remi Passanello
Come funziona WAXTER è un EA Trend-Wise, significa che la sua strategia è quella di operare nella direzione del trend. WAXTER utilizza una strategia Trend combinata con un'azione sui prezzi e un supporto dinamico e resistenze. L'indicatore WAX ​​incorporato specifico viene utilizzato per determinare il Trend Quando viene rilevato un trend, in base ai parametri, viene avviato un trade nella sua direzione Gli scambi vengono interrotti da TP/SL/TS o dal successivo scambio opposto a venire. Nessun
BPSPanel
Remi Passanello
BPS Panel Breakout Pro Scalper Solution Panel This indicator is part of the   RPTrade Pro Solutions  systems. BPS Panel   is a daily trend indicator using Price Action, Dynamic Support and Resistances. It's designed to be used by anyone, even the absolute beginner in trading can use it. NEVER repaints . Indications are given   from close to close . Designed to   be used alone , no other indicators are required. Gives you the trend and potential Take Profit at the beginning of the day. How doe
Market Shaver
Remi Passanello
Rasoio da mercato   Scalper del mercato Questo indicatore fa parte dei sistemi RPTrade Pro Solutions. Market Scalper è un indicatore di tendenza giornaliero che utilizza Price Action, Dynamic Support e Resistances. È progettato per essere utilizzato da chiunque, anche il principiante assoluto nel trading può usarlo. NON ridipinge MAI. Le indicazioni sono date da vicino a vicino. Progettato per essere utilizzato da solo, non sono necessari altri indicatori. Ti dà indicazioni chiare e semplici
Il commerciante quotidiano   Questo indicatore fa parte dei sistemi RPTrade Pro Solutions. Il Daily Trader è un indicatore giornaliero che utilizza solo statistiche. È progettato per essere utilizzato da chiunque, anche il principiante assoluto nel trading può usarlo. NON ridipinge MAI. Le indicazioni sono date da vicino a vicino. Progettato per essere utilizzato da solo, non sono necessari altri indicatori. Ti dà indicazioni chiare e semplici Come funziona Il sistema statistico analizza la c
GannRS Trend Scalper   GannRS is an advanced trading tool based on Gann Law and Supports and Resistances. designed to have an   active trading at any time not lagging Indications are given at the beginning of a new candle Please watch the full tutorial video. How to use GannRS Very easy to set up... Put it on your chart Adjust inputs Inputs Show Resistance and support : [bool]  true = Shows R/S on chart false = does not show Show Levels :[bool]  true = Shows levels on the chart false = does n
Progettato per essere utilizzato da solo, non sono necessari altri indicatori. Un grafico specifico mostra il profitto e l'eventuale drawdown in base ai dati storici. Come funziona Scalper Pro Line utilizza un indicatore di tendenza interno combinato con un sistema di azione sui prezzi. All'avvio, il sistema sta analizzando le prime 10000 barre della cronologia per trovare le impostazioni migliori. Quindi queste impostazioni vengono applicate all'intera cronologia e utilizzate in tempo reale;
TrendSwift
Remi Passanello
TrendSwift È progettato per essere utilizzato da chiunque, anche il principiante assoluto nel trading può usarlo. NON ridipinge MAI. Le indicazioni sono fornite da vicino a vicino. Progettato per essere utilizzato da solo, non sono necessari altri indicatori. Come funziona TrensSwift utilizza un indicatore di tendenza interno combinato con un'azione dei prezzi e un sistema Fibonacci. La strategia viene applicata rigorosamente senza alcun ricalcolo successivo, livellamento o interpolazione. Il
UniversalTrader
Remi Passanello
4.64 (11)
Universal Trader (UT) This EA is part of the  RPTrade Pro Solutions  systems. UT  is a trading robot using a trend and oscillator indicators.  It's designed to be used by anyone, even the absolute beginner in trading can use it. Designed for every TimeFrames Uses Takes Profit, Stop Loss and Trailing stop. Can also work as a switch without SL/TP Works with any pairs How does it work UT is a trend follower.  It's using A build in Supertrend Indicator to find trades entries and Parabolic SAR to S
Netting Scalper
Remi Passanello
5 (2)
Questo robot fa parte dei sistemi RPTrade Pro Solutions. Netting Scalper è un robot di trading veloce che utilizza la dinamica dei tick e il sistema di netting. È progettato per essere utilizzato da chiunque, anche il principiante assoluto nel trading può usarlo. Progettato SOLO per M1 Utilizza Takes Profit, Stop Loss e Trailing stop. Può funzionare anche come interruttore senza SL/TP Funziona con qualsiasi coppia Come funziona Netting Scalper è un veloce scalper M1. Non utilizza alcun indicat
GannRS Trend Scalper   GannRS is an advanced trading tool based on Gann Law and Supports and Resistances. designed to have an   active trading at any time not lagging Indications are given at the beginning of a new candle Please watch the full tutorial video. How to use GannRS Very easy to set up... Put it on your chart Adjust inputs Inputs Show Resistance and support : [bool]  true = Shows R/S on chart false = does not show Show Levels :[bool]  true = Shows levels on the chart false = does n
Straddle Scalper
Remi Passanello
Panoramica: Lo scalper a cavallo è un'apertura a cavallo di EA in orari e/o giorni particolari. Il Take Profit viene generato dinamicamente utilizzando il rapporto ATR. Requisiti: Per aprire gli straddle è necessario un conto di copertura. Una rigorosa ottimizzazione (a prezzi aperti) è obbligatoria. Cos'è una cavalcatura? Uno straddle è l'azione per aprire un Buy e un Sell allo stesso tempo. Come funziona questo EA? Dopo essere stato ottimizzato con successo, l'EA aprirà uno straddle ad
Filtro:
Nessuna recensione
Rispondi alla recensione