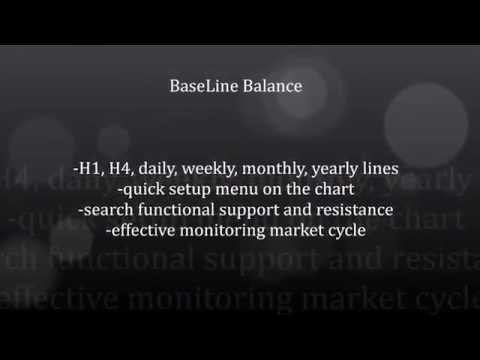
BaseLine Balance
- Indicadores
- Versión: 1.2
- Actualizado: 22 noviembre 2021
- Activaciones: 5
La herramienta Baseline Balance muestra múltiples líneas pivote para ciclos de mercado a corto, medio y largo plazo. De este modo, el operador puede identificar fácilmente los niveles S/R (soporte/resistencia) locales o globales para una mejor sincronización de las inversiones y entradas en el mercado. Gracias al menú multifuncional directamente en el gráfico, la configuración es rápida y precisa. Las líneas pivote se generan para H1, H4, diario, semanal, mensual y anual.
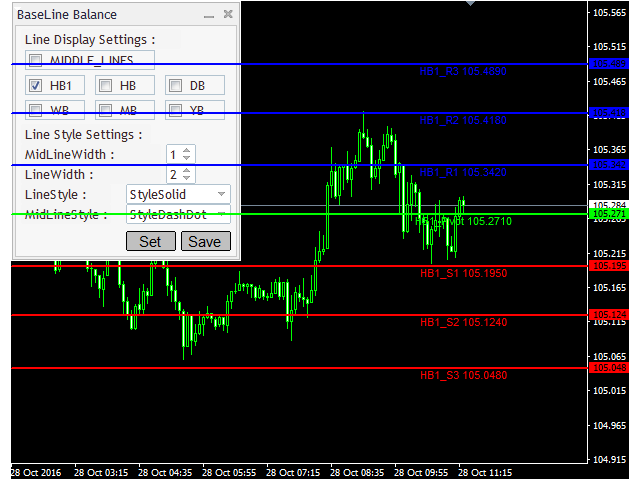
El menú en el gráfico muestra los siguientes ajustes:
Ajustes de visualización de líneas
- Middle_Lines - muestra los niveles medios de cálculo para el marco de tiempo seleccionado.
- HB1 - muestra el cálculo de líneas pivote, marco de tiempo de una hora
- HB - muestra el cálculo de líneas pivote, marco de tiempo de cuatro horas
- DB - muestra el cálculo de las líneas pivote, marco temporal diario
- WB - muestra el cálculo de las líneas pivote, marco temporal semanal
- MB - muestra el cálculo de las líneas pivote, marco temporal mensual
- YB - muestra el cálculo de las líneas pivote, marco temporal anual
Configuración del estilo de línea
- MidLineWidth - ajuste del ancho de línea para las líneas medias
- LineWidth - ajuste del ancho de línea para las líneas pivote
- LinesStyle - configuración del estilo de línea - sólido, punto, guión , punto y guión
- MidLinesStyle - configuración del estilo de línea - sólido, punto, guión , punto y guión
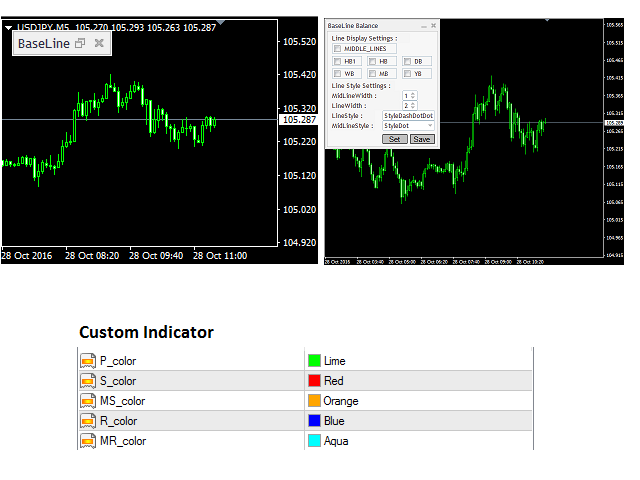
Ajustes internos
- P_color - configuración del color de las líneas pivote principales
- S_color - configuración del color de las líneas pivote de apoyo
- MS_color - configuración de color para las líneas de soporte medio
- R_color - configuración de color para las líneas pivote de resistencia
- MR_color - configuración de color para las líneas de resistencia media