Gold Mtf Phase Engine Dashboard

MTF Phase Engine Mini Dashboard


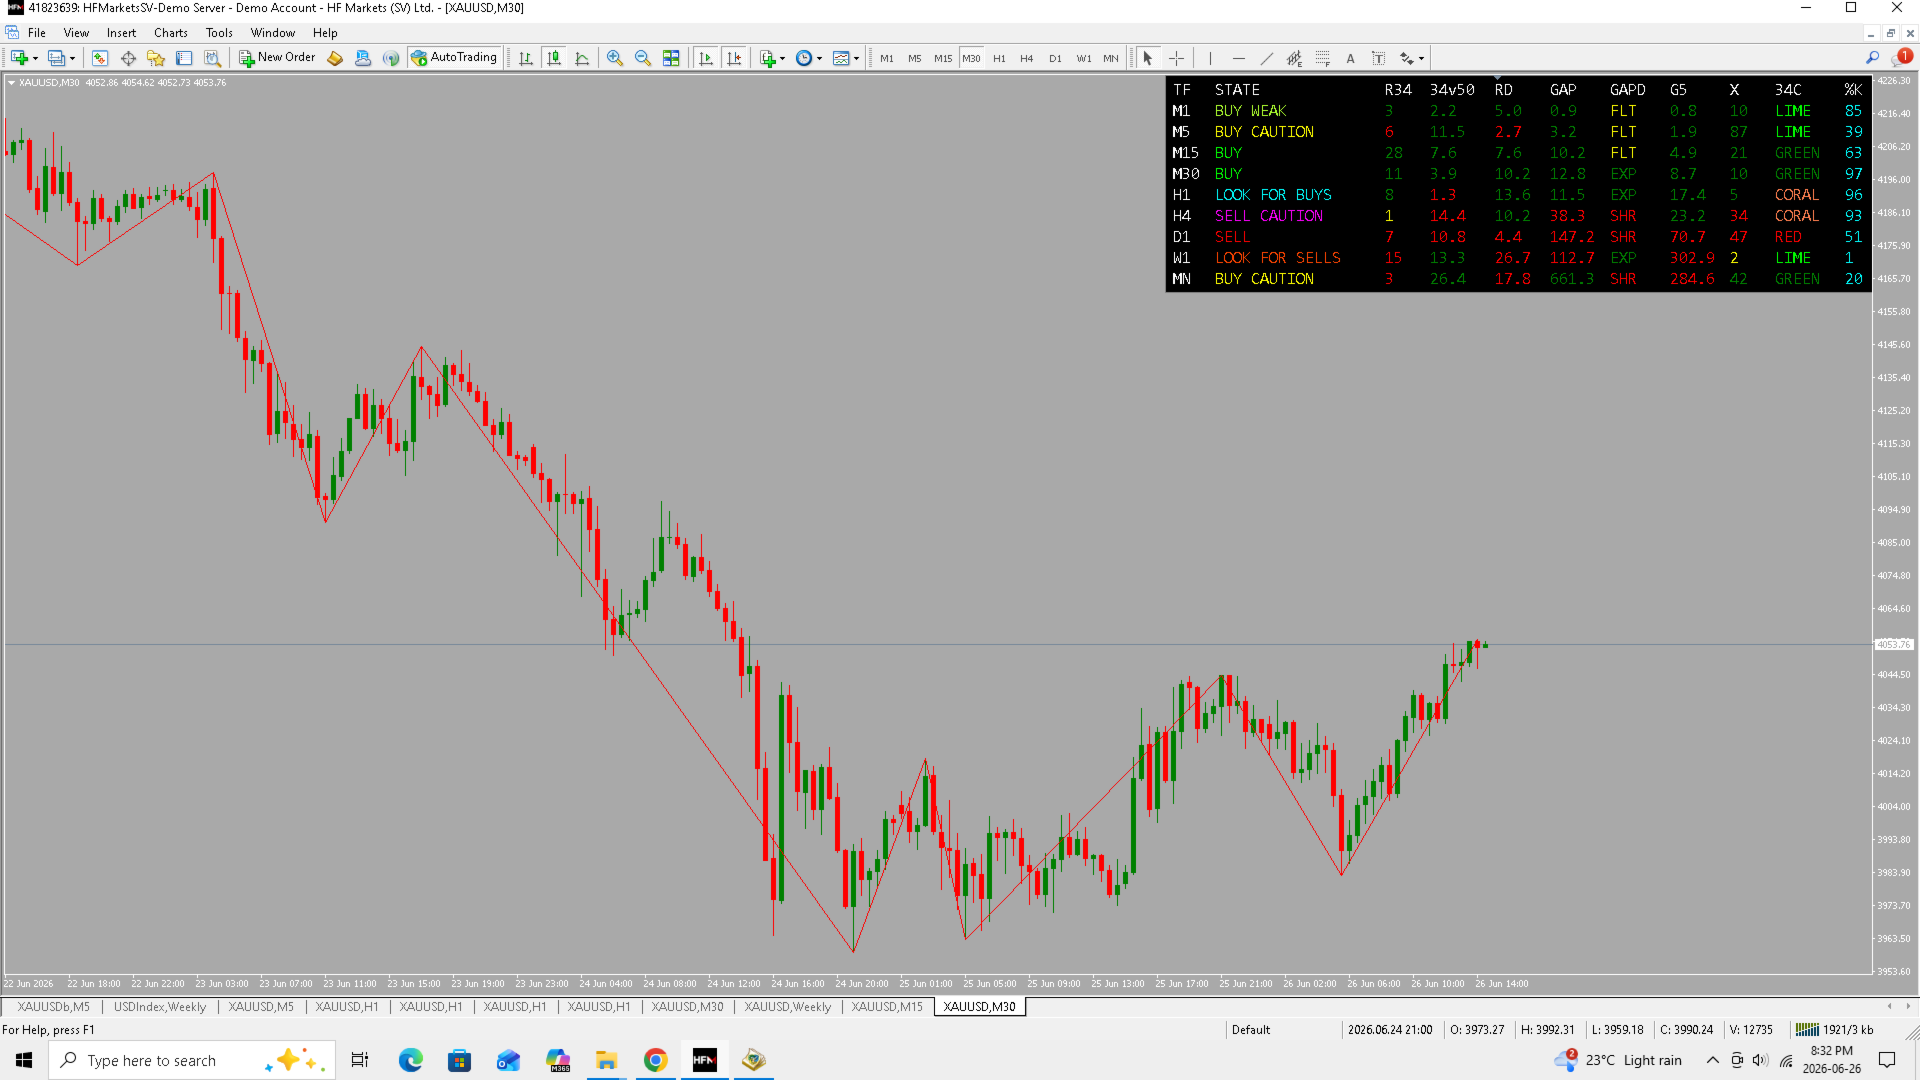
MTF Phase Engine Mini Dashboard is a compact multi-timeframe market condition panel designed for traders who want to read trend phase, RSI pressure, moving average structure, and momentum strength quickly across multiple timeframes.

Instead of loading several indicators or switching between charts, this dashboard displays the key condition data for M1, M5, M15, M30, H1, H4, D1, W1, and MN in one clean on-chart panel.

The indicator combines 5/13 moving average structure, RSI 14, RSI 34SMA, RSI 50-level pressure, MA gap behavior, price distance from the 5 MA, and Stoch RSI %K into a simple multi-timeframe view.

It is built for traders who want to quickly see which timeframes are aligned, which timeframes are weakening, and where momentum may be shifting.

Main Features

✅ Compact Multi-Timeframe Dashboard
View multiple timeframes in one clean panel without switching charts.

✅ Phase-Based Market State
The dashboard classifies each timeframe into clear market condition states such as BUY, SELL, EARLY BUY, EARLY SELL, LOOK FOR BUYS, LOOK FOR SELLS, BUY CAUTION, SELL CAUTION, BUY WEAK, SELL WEAK, or NO TRADE.

✅ RSI 34SMA Phase Engine
The indicator uses RSI 14 and a 34-period SMA of RSI to detect whether momentum is above or below the important 50 level and whether the RSI 34SMA is rising or falling.

✅ 5/13 Moving Average Structure
The dashboard tracks the relationship between the fast MA and slow MA to help show whether each timeframe is currently in a bullish or bearish MA regime.

✅ Live MA Gap and Gap Direction
See not only the current distance between MA5 and MA13, but also whether that gap is expanding, shrinking, or flat.

✅ Price Distance From MA5
The G5 column shows how far price is from the fast moving average, helping traders identify stretched moves or possible pullback conditions.

✅ Bars Since MA Cross
The X column shows how many bars have passed since the latest MA5/MA13 cross, helping traders compare fresh crosses against older running trends.

✅ Stoch RSI %K Momentum Reading
The %K column gives a fast momentum reading based on smoothed Stoch RSI.

✅ Customizable Panel Layout
Panel corner, width, font, row height, opacity, colors, and column positions can be adjusted.

✅ Selectable Timeframes
Each timeframe row can be enabled or disabled individually.

Column Guide

TF

Shows the timeframe being analyzed.

Available rows include:

M1, M5, M15, M30, H1, H4, D1, W1, and MN.

Each timeframe can be turned on or off from the inputs.

STATE

Shows the current market condition for that timeframe.

The state is calculated from:

  • MA5 vs MA13

  • RSI 14 vs RSI 34SMA

  • RSI position above or below 50

  • RSI 34SMA position above or below 50

  • RSI 34SMA slope direction

Possible states include:

BUY
The timeframe has bullish MA structure and RSI strength above the RSI 34SMA and above the 50 level.

BUY WEAK
The timeframe is still in a buy condition, but the 34C phase color shows weakening pressure.

LOOK FOR BUYS
Early bullish structure is forming with MA support and RSI strength beginning to build.

EARLY BUY
RSI conditions are improving before the full buy structure is confirmed.

SELL
The timeframe has bearish MA structure and RSI weakness below the RSI 34SMA and below the 50 level.

SELL WEAK
The timeframe is still in a sell condition, but the 34C phase color shows weakening selling pressure.

LOOK FOR SELLS
Early bearish structure is forming with MA support and RSI weakness beginning to build.

EARLY SELL
RSI conditions are weakening before the full sell structure is confirmed.

BUY CAUTION
A warning state where price may look bullish, but RSI has moved below the RSI 34SMA while still above the 50 area. This can warn that buy pressure is weakening.

SELL CAUTION
A warning state where price may look bearish, but RSI has moved above the RSI 34SMA while still below the 50 area. This can warn that sell pressure is weakening.

NO TRADE
The timeframe does not currently meet a clean buy, sell, early, or caution condition.

R34

Shows how many bars have passed since RSI last crossed its 34-period RSI SMA.

This helps traders see whether the RSI move is fresh or already mature.

  • A low number means the RSI cross is recent.

  • A higher number means the RSI condition has been running longer.

  • The color shows whether RSI is currently above or below its 34SMA.

34v50

Shows the distance between the RSI 34SMA and the 50 level.

This helps identify whether the RSI 34SMA is clearly above or below the centerline.

  • Green means the RSI 34SMA is above 50.

  • Red means the RSI 34SMA is below 50.

  • Yellow means it is near the neutral zone.

The number is displayed as an absolute distance, while the color shows direction.

RD

Shows the distance between live RSI and the RSI 34SMA.

This helps show how far RSI has separated from its average.

  • Green means RSI is above the RSI 34SMA.

  • Red means RSI is below the RSI 34SMA.

  • Yellow means RSI is close to the RSI 34SMA.

A larger number means RSI is farther away from the 34SMA.

GAP

Shows the live distance between MA5 and MA13.

This helps traders see whether the moving averages are close together or strongly separated.

  • Green means MA5 is above MA13.

  • Red means MA5 is below MA13.

  • Yellow means the gap is very small or near neutral.

The number is displayed as an absolute distance in pips or chart units depending on the symbol.

GAPD

Shows whether the MA5/MA13 gap is expanding, shrinking, or flat compared with the previous bar.

Possible values:

EXP
The MA gap is expanding.

SHR
The MA gap is shrinking.

FLT
The MA gap is flat or has not changed enough to be meaningful.

This column is useful for spotting whether momentum is increasing or fading.

G5

Shows the live distance between current price and MA5.

This helps traders see how far price has moved away from the fast moving average.

  • Green means price is above MA5.

  • Red means price is below MA5.

  • Yellow means price is very close to MA5.

The number is displayed as an absolute distance in pips or chart units depending on the symbol.

X

Shows how many bars have passed since the most recent MA5/MA13 cross.

This helps traders compare fresh MA crosses against older running trends.

  • A low number means the MA cross is recent.

  • A high number means the current MA structure has been running longer.

  • Green means the current MA structure is bullish.

  • Red means the current MA structure is bearish.

  • Yellow can highlight the freshest cross among the displayed timeframes if enabled.

34C

Shows the current color state of the RSI 34SMA phase engine.

The 34C column is based on whether the RSI 34SMA is above or below 50 and whether it is rising or falling.

Possible values:

GREEN
RSI 34SMA is above 50 and rising.

LIME
RSI 34SMA is above 50 but falling.

CORAL
RSI 34SMA is below 50 but rising.

RED
RSI 34SMA is below 50 and falling.

This column helps traders quickly understand whether momentum structure is strengthening, weakening, recovering, or declining.

%K

Shows the smoothed Stoch RSI %K value.

This gives a fast momentum reading from 0 to 100.

By default, the %K value is displayed as a momentum number, not as a direct buy or sell signal. Optional threshold colors can be used for high and low %K areas.

How Traders Can Use It

MTF Phase Engine Mini Dashboard can help traders:

  • Compare market condition across multiple timeframes

  • See whether lower and higher timeframes are aligned

  • Identify early buy or sell development

  • Spot weakening buy or sell conditions

  • Track RSI strength versus RSI 34SMA

  • Monitor whether the MA5/MA13 gap is expanding or shrinking

  • See how stretched price is from the 5 MA

  • Find fresh MA crosses across multiple timeframes

  • Confirm whether momentum is building, fading, or neutral

This makes it useful for scalping, intraday trading, swing trading, trend-following, pullback planning, and multi-timeframe confirmation.

Best Used For

This indicator can be used on:

  • Gold

  • Forex pairs

  • Indices

  • Crypto

  • Oil and commodities

  • Any MetaTrader symbol with active price movement

It is especially useful for traders who use RSI, moving averages, momentum structure, and multi-timeframe alignment in their trading decisions.

Important Note

MTF Phase Engine Mini Dashboard is a technical analysis tool. It does not predict future price movement and does not guarantee profitable trades.

The dashboard is designed to help organize market information and highlight current conditions. It should be used together with your own trading plan, market analysis, and risk management.
Prodotti consigliati
Con questo strumento di trading puoi scansionare 15 mercati contemporaneamente. Presentazione del nuovo indicatore di trading 2024: ️ Dashboard Stocastico multi valuta e multi time frame. Ci sono almeno due ragioni per cui ho creato questo strumento di trading: Innanzitutto, sono stanco di osservare solo un mercato. In secondo luogo, non voglio perdere il momento di ingresso in un altro mercato. Ecco perché voglio conoscere contemporaneamente altre condizioni di mercato. Per questo motiv
Trend Transition is a hybrid indicator, as it is based on signals from several well-known products: RSI and MA. MA is a trend indicator of the average true range, which determines the range of minimum and maximum price fluctuations, as well as closing prices. RSI is an indicator of the family of oscillators. The indicator helps to calculate the oversold and overbought levels of a trading instrument. When a trend changes, the Trend Transition indicator uses a color alarm: blue - when changing f
Определения текущей тенденции одна из самых важных задач трейдера не зависимо от стиля торговли. Индикатор  Price Detect   Volume поможет с достаточно высокой вероятностью это сделать. Price Detect Volume  - индикатор распознавания тенденции, использующий авторский алгоритм расчета, использующий объемы. Показания индикатора не изменяются не при каких условиях. Также с помощью индикатора можно наблюдать за коррекцией цены в сторону глобального тренда, определять возможные границы окончания отката
TWO SYMBOLS CORRELATION  line indicator    It compares the power/strength lines of two user input symbols and create a SMOOTHED line that indicates the degree of deviation of the 2 symbols Strategy#1- FOLLOW THE INDICATOR THICK LINE when CROSSING O LEVEL DOWN --- TRADE ON INDICATOR THICK LINE (TREND FRIENDLY) !! Strategy#2- TRADE INDICATOR PEAKS (Follow indicator Reversal PEAKS Levels)!! you input - the index of calculation ( 10/20/30....)                 - the indicator Drawing start point (ind
A top-quality from the famous XSuper Trend indicator. It is completely loyal to the original algorithm, and implements many useful features Which includes Trend Indicators as Filters like MACD,CCI and Alligator. The Chefs Super Trend Plus Indicator is a great way to identify the current market trend. The indicator shows a clear distinction between uptrends and downtrends. The indicators has optional filters for sound signal. Suitable for the following trending pairs: EUR/USD, GBP/USD, USD/JPY,
The HHHC-LLLC indicator uses candle by candle analysis, based on the principle of trend confirmation from Higher High, Higher Close candles (bullish) and Lower Low, Lower Close candles (bearish). There is no lag, no re-painting, and averaging is not used. HHHC-LLLC helps confirm: market structure and levels - look left to see them line up trends, pullbacks & reversals Bull moves (blue), Bear moves (red) Structure Zig Zags (black dotted lines), for summarizing market moves exhaustion and stalling
Description Trend Influencer is an indicator that determines the potential dynamics of the influence of trend wave movements on the market. The indicator is based on the value of moving averages corrected by the standard deviation. The indicator is displayed as a main dash-dotted moving average and a signal solid moving average. The signal moving average is colored blue or red depending on what type of trend is currently observed in the market. The indicator also draws inhibition levels - blue a
Normalized Volume 99% of indicators are based on price analysis. This indicator is based on volume. Volume is overlooked piece of information in most trading systems. And this is a big mistake since volume gives important information about market participants. Normalized Volume is an indicator that can be used to confirm reversal points. The indicator code volume with colors indicating high, normal and low volume. You could enhance dramatically your trading system using volume analysis. 
Multi-Timeframe EMA Momentum Filter — Version 1.0 This indicator is designed to help traders evaluate short-term EMA crossovers in the context of higher timeframe momentum. Its purpose is to reduce noise and highlight setups that align with the broader market trend. How it works: On the main chart, arrows appear when a fast EMA crosses a slow EMA on the current timeframe, provided that higher timeframe momentum confirms the direction. In the subwindow, a histogram displays the difference betwee
FREE
Atomic CHOCH BOS Trend Indicator v1.4 TRADING AUTOMATION EXPERTS - MT4 tools designed to enhance trader performance. Master the Smart Money Strategy with Precision _____________________________________________________________________________________________________________________________________________________________________________ Smart Market Structure Analysis Unlock the power of smart market structure analysis with the Atomic Break of Structure Change of Character (CHOCH) / Break of Str
Heiken Ashi Smoothed Strategy is a very simple but powerful system to get forex market trend direction. This indicator is actually 2 indicators in 1 pack, Heiken Ashi and Heiken Ashi Smoothed Moving Average both included. Because HA (Heiken Ashi) and HAS (Heiken Ashi Smoothed) are calculated in the same one system event with necessary buffers and loop only, so it is the FAST, OPTIMIZED and EFFICIENT HA having the combined indicator of MetaTrader 4. You can choose to display HA and HAS in the sam
RSI Jurik
Augustine Kamatu
Introducing RSI Jurik—an innovative indicator designed to revolutionize your forex trading strategy by combining custom moving averages based on the Relative Strength Index (RSI) with the MetaTrader 4 indicator, RSI. Jurik moving averages are renowned for their accuracy and reliability in analyzing price movements in the forex market. They provide traders with smoother representations of price action, reducing noise and offering clearer signals for identifying trends and potential reversals.
FREE
ECRO – Extreme Compression & Release Oscillator ECRO (Extreme Compression & Release Oscillator) è un indicatore di analisi tecnica progettato per identificare stati di compressione, espansione e transizione del mercato tramite un oscillatore normalizzato basato sul prezzo di chiusura (0–100) . L’indicatore misura dove si posiziona l’attuale prezzo di chiusura all’interno di un range mobile e restituisce un valore compreso tra 0 e 100 , rendendo le condizioni di mercato immediate e facili da int
L'indicatore a quadrante "cool volumes" è stato creato sulla base dei volumi in teak su MT4. L'indicatore stesso tiene traccia in un determinato periodo di tempo (selezione del periodo di tempo) del numero di volumi per l'acquisto o la vendita. E quando c'è un eccesso anomalo dei volumi di venditori o acquirenti, emette un segnale per vendere o acquistare. Nella finestra in basso vengono disegnati grafici a barre colorati, in cui il colore verde mostra la predominanza degli acquirenti al mome
Sarangani Venom
Sherwin Dennis Tava Ruiz
sarangani venom is 100% profitable, easy to use indicator, a chart without indicator is stressful and will lead you to many losses, this indicator is pleasing to the eye that will gives you more confident to trade when there is signal, your computer will gives sound and the spider will animate, it can be used to all time frame and to all currency, you have many options, when the candlestick touches to upper line it is buy, when it touches to lower line it is sell, when the rope is pull to buy ar
Rung
Iurii Tokman
Trend indicator. The indicator identifies the major price movement trends and market them with different colors. It filters out and ignores the noise and short-term movements of the price against the main trend. This indicator is a tool that identifies the current trend in the market. With the default settings, the ascending ("bullish") trends are marked with green lines and the descending ("bearish") trends are marked with red lines. The indicator ignored sideways or flat movements, when the pr
FREE
Changend
Victor Golovkov
The Changend signal indicator works on all timeframes and any markets. Analyzes data in the specified period and gives signals for a possible trend change (sell or buy). The indicator has only two settings: Period bars   - the number of last bars for data analysis Deviation level of bars  -the degree of deviation from the analyzed data Additionally, in the indicator settings, you can set your own style of signal display: Size Arrow Code Arrow Buy Color Arrow Buy Code Arrow Sell Color Arrow Sel
Primus Smart Money is an indicator that shows the average of bulls and bears on an asset. Used as a confirmation indicator for bullish and bearish control to assist in predicting future price moves Advantages Used in ALL financial markets including binary options on ALL asset classes or instruments. To be used as a confirmation tool with other indicators Parameters Period - default set to 9 (Recommended) Entry requirements Focus on the clusters on the indicator - the height or depth of the bars
Engulfing Candle Scanner
Ibrahim Olalekan Ganiu
This is an indicator that helps you to scan the whole timeframe then informs you about the last candle position Engulfing Candlestick pattern was formed. The indicator also send alert to your mobile when a new engulfing candle is formed.  For the visual; 1. Green up arrow indicates a bullish engulfing candlestick pattern  2. Red down arrow indicates a bearish engulfing candlestick pattern
FREE
Trend Reversal Zone and Alert
Godwin Edward Enyali
5 (1)
Trend Reversal Zone and Alert Zone di Offerta & Domanda Multi-Timeframe + Segnali Precisi di Inversione di Trend Trend Reversal Zone and Alert è un indicatore professionale non repaint , progettato per i trader che vogliono identificare inversioni di trend ad alta probabilità su livelli chiave istituzionali . L’indicatore combina in modo intelligente zone di offerta e domanda sui timeframe superiori (H4 e D1) con segnali precisi di rifiuto sui massimi e minimi giornalieri , consentendo ingressi
Volume Divergence Pro shows whether volume confirms the trend and marks regular and hidden divergences on price and indicator. Volume Divergence Pro measures the direction of price with linear regression over a fast and a slow window, and checks whether trading volume is supporting that move or fading away from it. Swings in the indicator are compared with swings in price to find divergences, which are drawn both in the indicator window and directly on the candles. How it works The fast regressi
The indicator is based on pair trading methods. It is not redrawn unlike similar indicators. Shows correlation between two selected instruments in percent for a predetermined period, and the positions of the instruments relative to each other. Has a function for reverse display of any of the analyzed symbols - for instruments with negative correlation. Can be drawn as a line or as a histogram. Settings: Symb1 - first symbol name. Revers1 - reverse display of the first symbol. Symb2 - second symb
This is Multiple Timeframe of Malaysia SNR Levels and Storyline. The single timeframe version   here Features: + Display level on multiple timeframe (higher or lower) + Turn on/off level on timeframe + Alert when price touch level 1. if high > resistance level but close of candle < resistance level , this level become unfresh - Name of level will have "(m)" meaning mitigated if   close of candle > resistance level , this level become invalid and can be removed in chart (there is setting for keep
Wall of worry
Illia Zhavarankau
Description: The Wall of Worry indicator allows you to assess market sentiment and possible reversals. The indicator represents three lines that are displayed in a separate window. Black line (trend) - the amount of volumes in the candle body. Red line (bears) - the amount of volumes in the upper shadow of the candlestick. Blue line (bulls) - the amount of volumes in the lower shadow of the candle. The idea is based on "Wall of Worry" - this is the periodic tendency of financial markets to
Volatility Pullback Radar è un indicatore grafico che mostra la tendenza generale corrente e misura la profondità del ritracciamento rispetto alla volatilità attuale del mercato. Funziona sul simbolo e sul timeframe del grafico a cui viene applicato. L'indicatore non apre, chiude o gestisce operazioni. Fornisce informazioni sulla direzione del trend, sulla profondità del ritracciamento e sullo stato corrente del ritracciamento. Come funziona L'indicatore utilizza una media mobile esponenziale di
FREE
The DMI MultiTimeframe EMA indicator is designed to facilitate multi-timeframe analysis by displaying a moving average from a specific timeframe (like H1 or D1) on any other chart timeframe. This tool allows traders to have a broader view across multiple timeframes directly on the current chart, enhancing precision and understanding of market trends. Parameters : Moving Average Timeframe : Sets the timeframe for the moving average, such as H1 for hourly or D1 for daily. Default: H1. Moving Avera
This indicator works on every currency pairs and time frames (TF). One input parameter: nPeriod - number of bars for histogram calculation. I recommend to optimize nPeriod value for each TF. If Green histogram poles are crossing the zero line from below then Long position may be opened. If Red histogram poles are crossing the zero line from above then Long position may be opened.
RSI Scanner is a multi symbol multi timeframe RSI dashboard that monitors Relative Strength Index indicator for price entering and exiting overbought and oversold in up to 28 symbols and 9 timeframes. Download Demo here  (Scans only M1 and W1) Settings description   here MT5 version   here RSI Scanner features: Signals RSI entering and exiting the overbought and oversold zones. Monitors 28 customizable instruments and 9 timeframes at the same time. You can choose between 3 alert modes:  Singl
El indicador "MR BEAST ALERTAS DE LIQUIDEZ" es una herramienta avanzada diseñada para proporcionar señales y alertas sobre la liquidez del mercado basándose en una serie de indicadores técnicos y análisis de tendencias. Ideal para traders que buscan oportunidades de trading en función de la dinámica de precios y los niveles de volatilidad, este indicador ofrece una visualización clara y detallada en la ventana del gráfico de MetaTrader. Características Principales: Canal ATR Adaptativo: Calcula
Institutional Fusion Levels (Livelli di Fusione Istituzionale) Institutional Fusion Levels è un indicatore professionale di supporto e resistenza multi–timeframe, progettato per identificare zone di reazione del prezzo ad alta probabilità istituzionale utilizzando i livelli di struttura di mercato del giorno precedente, della settimana precedente e del mese precedente. L’indicatore traccia automaticamente sul grafico aree chiave di supporto e resistenza basate sulla liquidità e mette in evidenza
Gli utenti di questo prodotto hanno anche acquistato
Trend SniperX MT4
Sarvarbek Abduvoxobov
5 (5)
Trend Sniper X è un indicatore di trend-following multi-timeframe per MetaTrader 5 che aiuta i trader a identificare la direzione del trend e i potenziali punti di inversione con chiarezza e precisione. Per MT5: https://www.mql5.com/en/market/product/181101 Informazioni sul prezzo: Il prezzo attuale è promozionale ed è soggetto a modifiche con il rilascio dei prossimi aggiornamenti e nuove funzionalità. Canale Code2Profit Domina il mercato con l'analisi multi-timeframe! Come massimizzare il tuo
Currency Strength Wizard è un indicatore molto potente che ti fornisce una soluzione all-in-one per un trading di successo. L'indicatore calcola la potenza di questa o quella coppia forex utilizzando i dati di tutte le valute su più intervalli di tempo. Questi dati sono rappresentati in una forma di indice di valuta facile da usare e linee elettriche di valuta che puoi utilizzare per vedere il potere di questa o quella valuta. Tutto ciò di cui hai bisogno è collegare l'indicatore al grafico che
PRO Renko System
Oleg Rodin
5 (31)
PRO Renko System è un sistema di trading altamente accurato appositamente progettato per il trading di grafici RENKO. Questo è un sistema universale che può essere applicato a vari strumenti di trading. Il sistema neutralizza efficacemente il cosiddetto rumore di mercato che consente di accedere a segnali di inversione accurati. L'indicatore è molto facile da usare e ha un solo parametro responsabile della generazione del segnale. Puoi facilmente adattare lo strumento a qualsiasi strumento di
SR Liquidity
Oleg Rodin
5 (2)
SR Liquidity è un indicatore di trading progettato per individuare le zone nascoste in cui si concentra la liquidità di mercato e dove il prezzo reagisce con maggiore intensità. Queste aree di liquidità agiscono come potenti livelli di supporto e resistenza, offrendo una mappa chiara dei punti in cui è più probabile che il mercato inverta la propria direzione. Invece di tracciare le classiche linee di supporto e resistenza, SR Liquidity analizza l'effettivo comportamento dei prezzi per individua
Scalper Vault
Oleg Rodin
5 (40)
Scalper Vault è un sistema di trading potente e completo, progettato per i trader che desiderano ottenere risultati costanti nel trading intraday. Questo indicatore ad alta precisione funge da sistema di trading autonomo, offrendo analisi di livello istituzionale sia per il mercato Forex che per le Opzioni Binarie. CONTATTAMI DOPO L'ACQUISTO PER RICEVERE I MIEI CONSIGLI DI TRADING E UN FANTASTICO BONUS! Eliminando le congetture e le complesse analisi manuali, Scalper Vault ti permette di concen
Zoryk Gold mt4
Reda El Koutbane
5 (3)
ZORYK — Sistema avanzato di segnali e pianificazione per XAUUSD su MetaTrader 4 Conosci sicuramente questa situazione. Analizzi l’oro, aspetti l’ingresso e finalmente apri la posizione. Il prezzo si muove immediatamente contro di te. Chiudi troppo presto, sposti lo Stop Loss oppure esiti per alcuni secondi. Poco dopo, il mercato raggiunge esattamente la direzione e l’obiettivo che avevi previsto, ma senza di te. Il problema non era sempre la direzione. Il vero problema era l’incertezza. No
Smart Trend Trading System è un indicatore per MetaTrader 4 che riunisce informazioni sul trend, segnali di entrata e uscita e livelli di prezzo in un unico grafico. Combina più di 10 strumenti di trading in un unico sistema, inclusi rilevamento del trend, zone di inversione, Smart Cloud, logica di trailing stop, supporto e resistenza, colorazione delle candele, avvisi e analisi multi-timeframe. Il sistema è progettato per aiutarti a operare in diverse condizioni di mercato: Mercati in trend: I
Quant Direction
Georgios Kalomoiropoulos
Quant Direction è uno strumento di analisi di mercato 3D. Offre un'analisi di mercato perfettamente oggettiva, basata su algoritmi, calcolando con precisione le deviazioni percentuali su diversi parametri. Sviluppato utilizzando strumenti di modellazione avanzati basati sull'intelligenza artificiale e rigorosamente testato, questo algoritmo analizza il mercato con una precisione senza pari. È possibile analizzare qualsiasi coppia di valute o strumento finanziario sulla piattaforma. Che si pratic
Trend Lines PRO
Roman Podpora
5 (2)
LINEE DI TENDENZA PRO       Aiuta a capire dove il mercato sta realmente cambiando direzione. L'indicatore mostra reali inversioni di tendenza e punti in cui i principali attori rientrano. Vedi  Linee BOS   Cambiamenti di tendenza e livelli chiave su timeframe più ampi, senza impostazioni complesse o rumore inutile. I segnali non vengono ridisegnati e rimangono sul grafico dopo la chiusura della barra. VERSIONE MT 5     -      Svela il suo massimo potenziale se abbinato all'indicatore   RFI LEVE
AW Prime Oscillator
AW Trading Software Limited
5 (1)
Una combinazione di due oscillatori. Il primo mostra i punti di ingresso, il secondo mostra l'andamento attuale. L'indicatore può visualizzare i segnali dell'oscillatore tramite frecce in due modalità, tutti i segnali dell'oscillatore veloce o segnali solo nella direzione della tendenza attuale. Ha un pannello multi-intervallo temporale e tre tipi di notifiche di segnali. Benefici: Adatto per il trading giornaliero e scalping Filtraggio delle tendenze Configurazione semplice e sensibile Pannello
Atomic Analyst
Issam Kassas
5 (14)
Atomic Analyst — MetaTrader 4 Per domande sul prodotto, indicazioni sulla configurazione o supporto tecnico, scrivimi direttamente qui su MQL5. L’indicatore trasforma calcoli complessi del mercato in semplici segnali visivi, candele colorate, letture del trend, livelli di stop-loss e diverse zone di take-profit che i trader possono capire rapidamente e usare in condizioni reali di mercato. Principali utilizzi di trading: Scalping e trading intraday: Progettato per decisioni rapide, frecce chiar
M1 Sniper
Oleg Rodin
4.97 (30)
M1 SNIPER è un sistema di indicatori di trading facile da usare. Si tratta di un indicatore a freccia progettato per l'intervallo temporale M1. L'indicatore può essere utilizzato come sistema autonomo per lo scalping sull'intervallo temporale M1 e come parte del tuo sistema di trading esistente. Sebbene questo sistema di trading sia stato progettato specificamente per il trading sull'intervallo temporale M1, può comunque essere utilizzato anche con altri intervalli temporali. Inizialmente ho pro
SIO Oscillator: oscillatore auto-ottimizzante dello squilibrio di semivarianza Acquista l’indicatore e ricevi GRATIS l’Expert Advisor (EA) basato su di esso. La maggior parte degli oscillatori tratta ogni movimento di prezzo allo stesso modo. SIO separa la pressione rialzista da quella ribassista e misura lo squilibrio tra le due, mostrando quale parte controlla davvero il mercato: compratori o venditori. Quando lo squilibrio raggiunge un estremo, SIO genera un segnale chiaro con livelli di ingr
Hidden Cycles
Lev Vladimirovic Marushkin
5 (1)
The Only 100% Universal Tool! Stop trading against nature! This is your chance to secure the only indicator rooted in the absolute laws that govern the entire universe. Most tools guess—this one reveals the truth. Buy another toy or buy the truth. Your choice... Based on Universal Laws — NOT Some Guy’s Algorithm: Let the market adjust to the Hidden Cycles Geometry — not the other way around. Most indicators are based on a man-made formula. They often lag, fail over time, or need constant re-o
Neo Wave PRO
Nikolay Raykov
5 (1)
Price & Time Market Structure Indicator A professional market structure tool that analyzes waves through both price and time — not price alone. Main Description NeoWave PRO is a professional market structure indicator for MetaTrader 4 designed for traders who want to move beyond traditional one-dimensional wave tools such as ZigZag, swing indicators, and basic high/low systems. Most wave indicators analyze only one thing: Price. But a real market wave is not only a price movement. A true wave de

PZ Turning Points MT4
PZ TRADING SLU
1 (1)
Identify key turning points with reliable fractal analysis This indicator examines the price structure of fractals of different periods to determine possible reversal points in the market, providing timing to positional traders that already have a fundamental or technical valuation model. Unlike its younger brother, Reversal Fractals , this indicator won't miss reversals because of the period selected, and will find reversal fractals on a zig-zag fashion, ignoring those reversals which do not
CRT Multi-Timeframe Market Structure & Liquidity Sweep Indicator Non-Repainting | Multi-Asset | MT5 Version Available MT5 Version:   https://www.mql5.com/en/market/product/162075 Full User Guide — explains what each feature does and why:   https://www.mql5.com/en/blogs/post/767525 Quick Start User Guide  — explains how to configure and in what order:  https://www.mql5.com/en/blogs/post/767540 Indicator Overview CRT Ghost Candle HTF Fractal is a complete institutional-grade market structure too
Gann Time Clusters
Martin Eshleman
2.5 (2)
Gann Time Clusters Indicator This indicator is based on W. D. Gann's Square of 9 method for the time axis. It uses past market reversal points and applies the mathematical formula for Gann's Square of 9 and then makes projections into the future. A date/time where future projections line up is called a 'time cluster'. These time clusters are drawn as vertical lines on the right side of the chart where the market has not advanced to yet. A time cluster will result in a market reversal point (ex.
Non repaint MT4
Yan Zhen Du
5 (1)
This is a professional chart indicator designed for traders focused on stability and clear price action. It helps filter market noise and provides clear visual entry and exit zones for your trading decisions. Core Features: Strictly Non-Repainting: The system is built with strict non-repaint logic. What you see on the chart is the true historical performance. Confirmed Signals: Signals are triggered and confirmed only after the candle closes . Once a trading arrow appears on a closed candle, it
Forex Breath System è un sistema di trading basato sui trend che può essere utilizzato con qualsiasi mercato. Puoi utilizzare questo sistema con valute, metalli, materie prime, indici, criptovalute e persino azioni. Può essere utilizzato anche con qualsiasi intervallo di tempo. Il sistema è universale. Mostra la tendenza e fornisce segnali di freccia con la tendenza. L'indicatore può anche fornirti un tipo speciale di avvisi quando i segnali appaiono nella direzione del trend, il che rende il tr
Advanced Supply Demand
Bernhard Schweigert
4.91 (302)
Speciale Trading- SCONTO DEL 30% La soluzione migliore per qualsiasi trader principiante o esperto! Questo indicatore è uno strumento di trading unico, di alta qualità e conveniente, perché abbiamo incorporato una serie di funzionalità proprietarie e una nuova formula. Con questo aggiornamento, potrai visualizzare doppie zone di timeframe. Non solo potrai visualizzare un TF più alto, ma anche entrambi, il TF del grafico e il TF più alto: MOSTRA ZONE ANNIDATE. Tutti i trader che operano con Of
ATTUALMENTE SCONTATO DEL 40%! La soluzione migliore per ogni principiante o trader esperto! Questo indicatore è uno strumento di trading unico, di alta qualità e conveniente perché abbiamo incorporato una serie di caratteristiche proprietarie e una formula segreta. Con un solo grafico fornisce avvisi per tutte le 28 coppie di valute. Immaginate come migliorerà il vostro trading perché sarete in grado di individuare l'esatto punto di innesco di una nuova tendenza o opportunità di scalping! Co
Super Signal – Skyblade Edition Sistema professionale di segnali di tendenza senza repaint / senza ritardo con tasso di vincita eccezionale | Per MT4 / MT5 Funziona meglio su timeframe più bassi, come 1 minuto, 5 minuti e 15 minuti. Caratteristiche principali: Super Signal – Skyblade Edition è un sistema intelligente di segnali progettato specificamente per il trading di tendenza. Utilizza una logica di filtraggio multilivello per identificare esclusivamente i movimenti direzionali forti, supp
Liquidity Scalper System: un sistema di trading basato sulla liquidità in formato indicatore. La maggior parte degli indicatori mostra solo una freccia, poi è il trader a decidere dove mettere lo stop, dove si trova il target e se fidarsi del segnale. Liquidity Scalper System copre l'intero ciclo del trade: trova i pool di liquidità, dà un segnale alla loro rottura, calcola subito Entry, Stop Loss e tre target, e mostra sul pannello le statistiche e i risultati della verifica su dati nuovi. Il
Market Reversal Alerts
Lee Samson
4.19 (114)
Il profitto dalla struttura del mercato cambia quando il prezzo si inverte e si ritira. L'indicatore di avviso di inversione della struttura del mercato identifica quando una tendenza o un movimento di prezzo si sta avvicinando all'esaurimento e pronto a invertire. Ti avvisa dei cambiamenti nella struttura del mercato che in genere si verificano quando stanno per verificarsi un'inversione o un forte pullback. L'indicatore identifica inizialmente i breakout e lo slancio del prezzo, ogni volta c
Gann Made Easy
Oleg Rodin
4.84 (174)
Gann Made Easy è un sistema di trading Forex professionale e facile da usare che si basa sui migliori principi del trading utilizzando la teoria di mr. WD Gann. L'indicatore fornisce segnali ACQUISTA e VENDI accurati, inclusi i livelli di Stop Loss e Take Profit. Puoi fare trading anche in movimento utilizzando le notifiche PUSH. CONTATTAMI DOPO L'ACQUISTO PER RICEVERE GRATUITAMENTE LE ISTRUZIONI DI TRADING E OTTIMI INDICATORI EXTRA! Probabilmente hai già sentito parlare molte volte dei metodi d
Neuro Poseidon MT4
Daria Rezueva
4.74 (46)
Neuro Poseidon is a new indicator by Daria Rezueva. It combines precise trading signals with adaptive TP/SL levels - creating best possible trades as a result! Message me and get  Neuro Poseidon Assistant  as a gift to automize your trading process! What makes it stand out? 1. Proven profitability on all assets and timeframes 2. Only confirmed BUY and SELL signals present on the chart 3. Adaptive TP & SL levels generated by the software for each trade 4. Easy to understand - suitable for all
Break and Retest Hunter MT4 is a powerful MetaTrader 5 indicator designed to automatically identify support and resistance levels, breakout structures, and potential retest opportunities in real time. Bonus Indicator: After purchasing Break and Retest Hunter , contact me to receive Trade Indicator Assistant EA completely free as a bonus utility. $65 for the next 10 copies . Next price is $120.  Combining adaptive market analysis, clear BUY/SELL signals, Fibonacci-based profit targets, and a pre
Gold Channel is a volatility-based indicator, developed with a specific timing algorithm for the XAUUSD pair, which consists of finding possible corrections in the market. This indicator shows two outer lines, an inner line (retracement line) and an arrow sign, where the theory of the channel is to help identify overbought and oversold conditions in the market. The market price will generally fall between the boundaries of the channel. If prices touch or move outside the channel it is a tradi
Attualmente 30% di sconto! La soluzione migliore per ogni principiante o trader esperto! Questo software per cruscotti funziona su 28 coppie di valute. Si basa su 2 dei nostri indicatori principali (Advanced Currency Strength 28 e Advanced Currency Impulse). Offre un'ottima panoramica dell'intero mercato Forex. Mostra i valori di forza delle valute avanzate, la velocità di movimento delle valute e i segnali per 28 coppie Forex in tutti i (9) timeframe. Immaginate come migliorerà il vostro tra
Altri dall’autore
Liquidity zones
Martin Dennis Coman
Wick & Liquidity Zones Tracker – Advanced Gold & Forex Cluster Indicator “See Where Big Players Move — Trade Gold & Forex Like an Insider!” Liquidity Zones instantly reveals hidden liquidity clusters, swing reversals, and breakout points, giving you the edge most traders only dream of. Key Features  Liquidity Zone Detection: Automatically identifies unbalanced bullish & bearish candles , marking zones where price is likely to reverse or accelerate. Cluster Analysis: Groups consecutive candles
Gold Session Liquidity Map
Martin Dennis Coman
5 (1)
GOLD SESSION LIQUIDITY MAP Gold Session Liquidity Map is a multi-market MT4 indicator for session structure, liquidity, breakout probability, Fibonacci mapping and multi-timeframe momentum. Originally developed around Gold/XAUUSD, it can also be used on Forex, Oil, indices and cryptocurrencies. Calculations use the current chart symbol and timeframe. The indicator is built around three questions: LOCATION - Where is price relative to session structure? DIRECTION - Which side currently has st
Gold Weekly High Trap Zones Weekly High Trap Zones   is a clean MT4 weekly range-mapping indicator designed to help traders identify the key trap zone created around the current week’s high. The indicator finds the current weekly high, identifies the session range connected to that high, and then projects a structured trap-zone ladder from that range. It displays the important weekly high origin level, trap zone top and bottom, 100 level, 161.8 target, 261.8 target, and optional higher extensio
SmartADR v2.80 SmartADR v2.80   is an advanced Average Daily Range mapping indicator for MetaTrader 4. It is designed to help traders build a clear intraday range map using the Daily Open, ADR high/low projections, Fibonacci reaction levels, ADR zones, and previous unbroken ADR targets. Instead of showing only a simple ADR high and ADR low, SmartADR creates a full visual structure around the market open. This allows traders to see where price may expand, pause, reject, pull back, or complete it
GC Regime Divergence Panel GC Regime Divergence Panel   is a compact multi-timeframe market condition dashboard for MT4. It is designed to help traders quickly read trend regime, pullback conditions, and RSI divergence across multiple timeframes without switching charts. The indicator displays a clean on-chart panel showing each timeframe, the current market regime, and any detected RSI divergence. It combines moving average structure, MA gap behavior, RSI pressure, RSI 34SMA comparison, and s
RSI 34 Last Range Tracker RSI 34 Last Range Tracker   is a visual range-tracking indicator for MT4 that helps traders identify the most recent RSI momentum shift and project the important reaction zone from that candle. The indicator tracks crosses between RSI and its 34-period RSI moving average. When a bullish or bearish RSI cross occurs, the indicator marks the cross candle with a dot and draws the related price range, including the candle high, candle low, and the important 38.2 / 61.8 mi
GC Volume Profile GC Volume Profile   is a professional MT4 volume profile indicator designed to help traders see where market activity is concentrated, where buyers and sellers are positioned, and where important volume-based reaction zones may exist. The indicator builds a horizontal tick-volume profile directly on the chart using either a fixed lookback range or the visible chart area. It separates bullish and bearish volume, highlights important volume nodes, shows the Point of Control, di
Daily Weekly Monthly Open Map Daily Weekly Monthly Open Map   is a clean price-level mapping indicator for MT4 that helps traders track important open-price levels across the daily, weekly, and monthly market structure. If you purchase this indicator i will give you a free 40 minute zoom session one to one on how to use this. Many markets repeatedly react around previous daily, weekly, and monthly open prices. These levels can act as support, resistance, liquidity targets, unfinished-business a
Daily Open Mirror Engine — Wick & Body Mirror Levels for MT4 Daily Open Mirror Engine   is a professional MetaTrader 4 indicator designed to project mirrored price levels from the current daily open. Many intraday moves react strongly around the daily open. This indicator uses the daily open as the central reference point and automatically projects mirrored levels from important wick and body extremes, helping traders identify possible reaction zones, liquidity targets, support, resistance, an
Gold Zones Liquidity Wick Zones Liquidity   is a visual support and resistance zone indicator designed to help traders identify important reaction areas created from swing highs, swing lows, wick zones, and liquidity candle clusters. Instead of drawing random horizontal levels, the indicator studies the most important visible swing high and swing low on your chart using ZigZag structure. From those swing points, it automatically builds clean 38.2 and 61.8 liquidity zones that can act as reacti
Swing Volume Phase Swing Volume Phase   is a visual market-structure and volume-pressure indicator designed to help traders quickly understand who is controlling the current move:   buyers or sellers . Instead of looking at candles alone, this tool focuses on the volume behind important swing highs, swing lows, and completed price legs. It helps identify whether the current market phase is being supported by stronger buying pressure, stronger selling pressure, or a possible shift in control. T
MA Gap Tracker Engine — Multi-Timeframe 5/13 SMMA Distance & Trend Panel for MT4 MA Gap Tracker Engine   is a professional MetaTrader 4 indicator designed to track the live relationship between price, the 5 SMMA, and the 13 SMMA across multiple timeframes. This tool helps traders quickly see whether price is above or below the moving averages, whether the 5/13 MA structure is bullish or bearish, and most importantly, whether the moving average gap is   expanding, shrinking, or flat . Instead of
Session Liquidity Map Engine — Sydney, Asia, German, UK & US Range Structure for MT4 Session Liquidity Map Engine   is a professional MetaTrader 4 indicator designed to map the most important intraday trading sessions directly on your chart. The indicator automatically draws key session boxes, tracks session highs and lows, identifies active and taken liquidity levels, and displays a compact real-time information panel so traders can quickly understand where price is in relation to the major ma
Monday Asia Weekly Fib Engine — Weekly Session Projection Levels for MT4 Monday Asia Weekly Fib Engine   is a MetaTrader 4 indicator designed to project key weekly Fibonacci levels from the   Monday Asia trading session range . If you purchase this indicator i will give you a free 40 minute zoom session one to one on how to use this. Many weekly moves begin with a clear liquidity range during the early Asia session. This indicator automatically identifies that Monday Asia range and projects F
Gold Phase Detector
Martin Dennis Coman
Gold Phase Detector Gold Phase Detector is a MetaTrader 4 indicator designed to display RSI momentum, moving average alignment, and market phase conditions in a visual format. The indicator uses RSI, an RSI moving average, and a 5/13 moving average structure to help traders observe whether market conditions are trending, correcting, weakening, or transitioning. Gold Phase Detector is intended for chart analysis. It does not open, close, or manage trades. Main Features RSI phase coloring RSI 50 l
This dashboard shows you what is happening on all timeframes at the sametime. State - tells you what state that timeframe is currently in. R34 - tells you how many candles have closed above or below the 34sma G5 - tells you how far the price is from the 5sma moving average G13 - tells you how far the price is from the 13sma moving average RD - this tells you how far RSI is from the 34sma 34v50 - this tells you how far the 34sma is from 50 Gap - this tells you the current gap between the 5sma a
Dynamic Gap Engine
Martin Dennis Coman
GapZone Pro – Dynamic Gap Trading Engine for MT4 The Gap That Evolves with the Market Most gap indicators detect a gap once, draw a box, and never change it again. GapZone Pro is different. Its proprietary Dynamic Gap Engine continuously recalculates the active market gap as price evolves. As the size of the gap expands or contracts, every Fibonacci level, retracement zone, and distance calculation updates automatically in real time. Instead of trading yesterday's gap, you're trading the marke
Gold Session Trap Distance Map Gold Session Trap Distance Map is a clean intraday liquidity-mapping indicator designed for XAUUSD traders who want to track where price still has unfinished business from major trading sessions. Instead of filling the chart with random support and resistance, this indicator focuses on one simple idea: unbroken session trap zones can act like future liquidity magnets. The indicator tracks key session trap areas from the major trading periods and displays live dista
Gold Wick Support Resistance Map is a professional MT4 wick-reaction mapping indicator designed to help traders read hidden price reaction areas created by candle wicks, liquidity sweeps, rejection points, breakout zones, and market structure. Most support and resistance tools focus on simple highs, lows, or candle-body levels. This indicator takes a different approach. It focuses on wick structures, because wicks often show where price tested liquidity, reacted strongly, rejected, or completed
Gold Fuel
Martin Dennis Coman
Gold Fuel  is a professional MT4 chart-mapping indicator designed for traders who study price-leg movement, candle structure, reaction zones, and 161.8 completion targets. The indicator uses a selected market leg as the active structure, then automatically projects the working direction and displays the relevant zone and target map. It shows only the active directional zone, helping keep the chart clean and focused. When the selected leg projects downward, the indicator displays the active sell
Gold Swing Break Target Map is a MetaTrader 4 indicator designed to display projected target levels after a confirmed swing high or swing low is broken. The indicator is intended to help traders answer a common chart question: If price breaks this swing high, where could it continue upward? If price breaks this swing low, where could it continue downward? The tool does not open, close, or manage trades. It is designed for chart analysis and discretionary trading decisions. Main Purpose Gold Swin
Stop switching between charts just to understand the moving-average structure. CrossMap MTF MA Zones brings every important crossover, gap, age, and origin zone onto one chart. CrossMap MTF MA Zones is a clean, fully adjustable multi-timeframe moving-average indicator designed to show where each crossover began, how mature it is, and whether the distance between the averages is expanding or shrinking. The indicator can monitor every standard timeframe from M1 to MN1 while displaying only the ti

Filtro:
Nessuna recensione
Rispondi alla recensione