Gold Mtf Phase Engine Dashboard

MTF Phase Engine Mini Dashboard

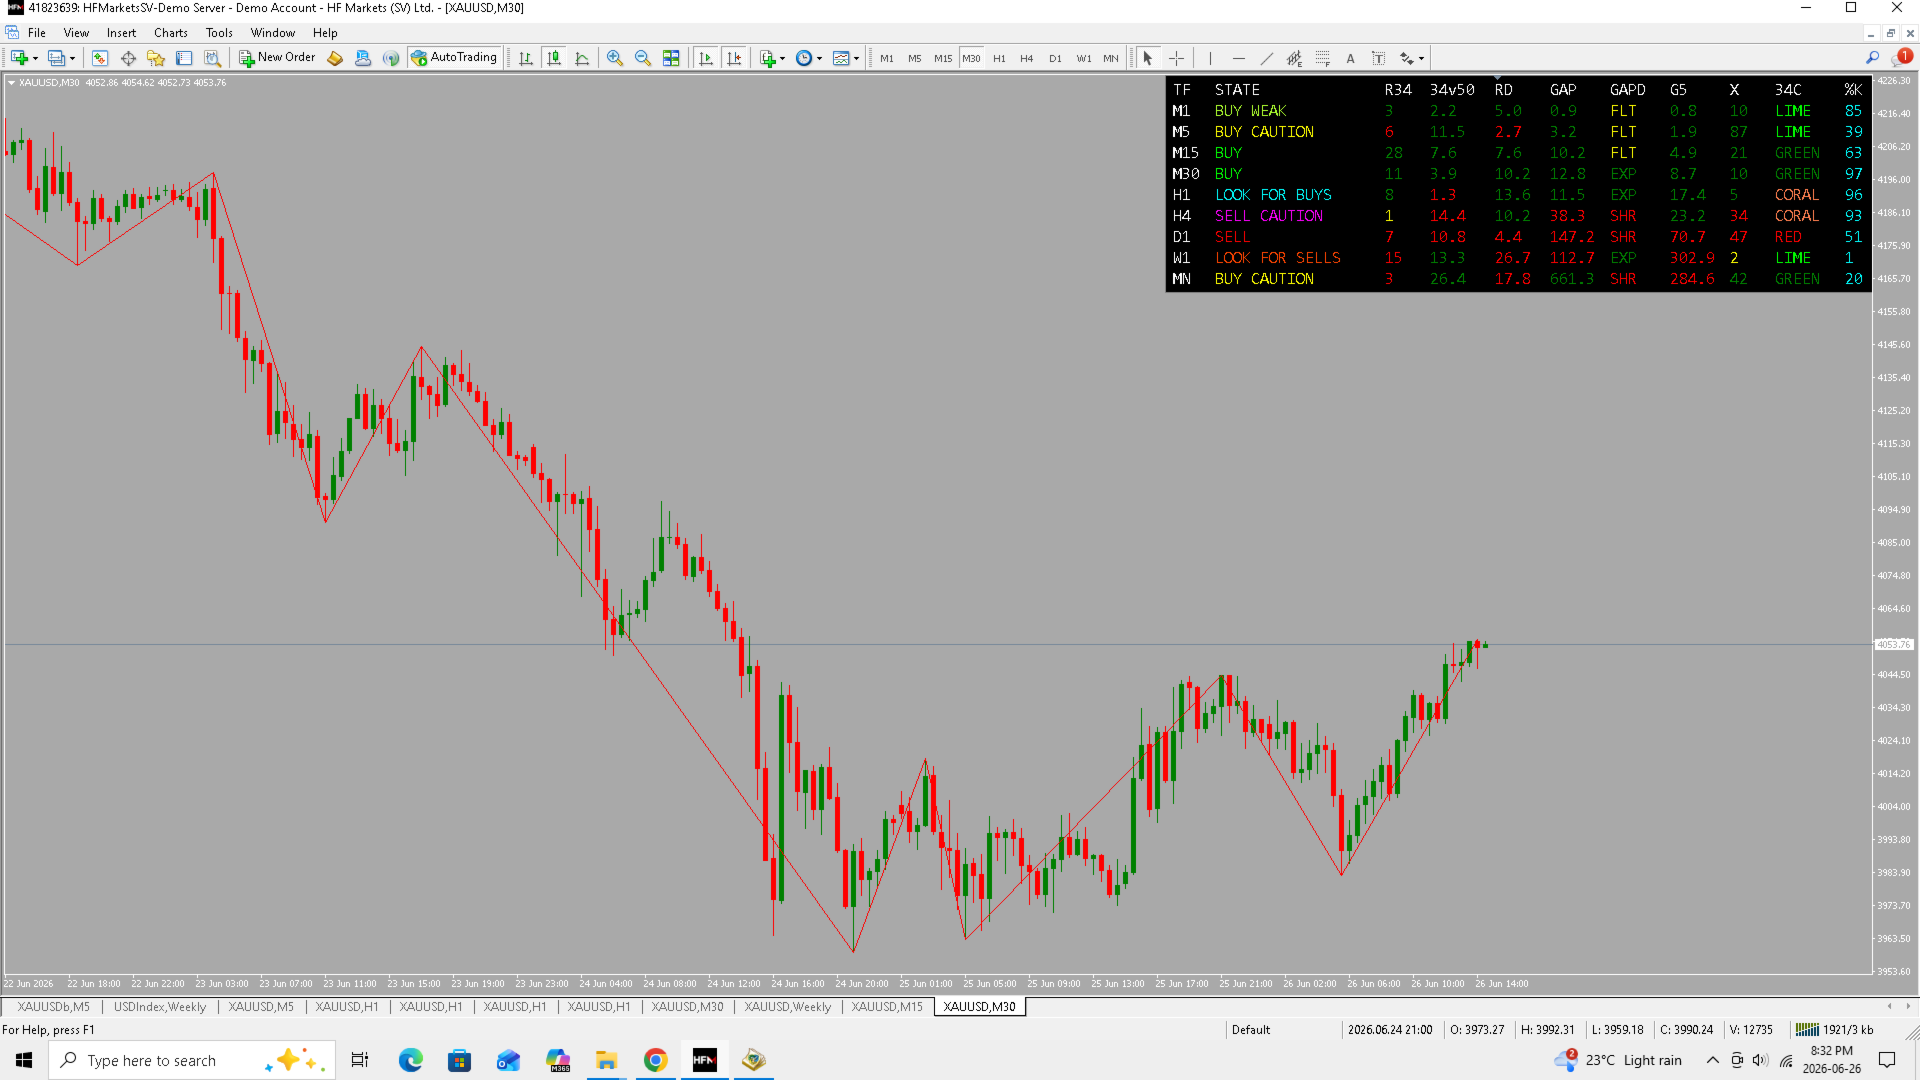
MTF Phase Engine Mini Dashboard is a compact multi-timeframe market condition panel designed for traders who want to read trend phase, RSI pressure, moving average structure, and momentum strength quickly across multiple timeframes.

Instead of loading several indicators or switching between charts, this dashboard displays the key condition data for M1, M5, M15, M30, H1, H4, D1, W1, and MN in one clean on-chart panel.

The indicator combines 5/13 moving average structure, RSI 14, RSI 34SMA, RSI 50-level pressure, MA gap behavior, price distance from the 5 MA, and Stoch RSI %K into a simple multi-timeframe view.

It is built for traders who want to quickly see which timeframes are aligned, which timeframes are weakening, and where momentum may be shifting.

Main Features

 Compact Multi-Timeframe Dashboard
View multiple timeframes in one clean panel without switching charts.

 Phase-Based Market State
The dashboard classifies each timeframe into clear market condition states such as BUY, SELL, EARLY BUY, EARLY SELL, LOOK FOR BUYS, LOOK FOR SELLS, BUY CAUTION, SELL CAUTION, BUY WEAK, SELL WEAK, or NO TRADE.

 RSI 34SMA Phase Engine
The indicator uses RSI 14 and a 34-period SMA of RSI to detect whether momentum is above or below the important 50 level and whether the RSI 34SMA is rising or falling.

 5/13 Moving Average Structure
The dashboard tracks the relationship between the fast MA and slow MA to help show whether each timeframe is currently in a bullish or bearish MA regime.

 Live MA Gap and Gap Direction
See not only the current distance between MA5 and MA13, but also whether that gap is expanding, shrinking, or flat.

 Price Distance From MA5
The G5 column shows how far price is from the fast moving average, helping traders identify stretched moves or possible pullback conditions.

 Bars Since MA Cross
The X column shows how many bars have passed since the latest MA5/MA13 cross, helping traders compare fresh crosses against older running trends.

 Stoch RSI %K Momentum Reading
The %K column gives a fast momentum reading based on smoothed Stoch RSI.

 Customizable Panel Layout
Panel corner, width, font, row height, opacity, colors, and column positions can be adjusted.

 Selectable Timeframes
Each timeframe row can be enabled or disabled individually.

Column Guide

TF

Shows the timeframe being analyzed.

Available rows include:

M1, M5, M15, M30, H1, H4, D1, W1, and MN.

Each timeframe can be turned on or off from the inputs.

STATE

Shows the current market condition for that timeframe.

The state is calculated from:

  • MA5 vs MA13

  • RSI 14 vs RSI 34SMA

  • RSI position above or below 50

  • RSI 34SMA position above or below 50

  • RSI 34SMA slope direction

Possible states include:

BUY
The timeframe has bullish MA structure and RSI strength above the RSI 34SMA and above the 50 level.

BUY WEAK
The timeframe is still in a buy condition, but the 34C phase color shows weakening pressure.

LOOK FOR BUYS
Early bullish structure is forming with MA support and RSI strength beginning to build.

EARLY BUY
RSI conditions are improving before the full buy structure is confirmed.

SELL
The timeframe has bearish MA structure and RSI weakness below the RSI 34SMA and below the 50 level.

SELL WEAK
The timeframe is still in a sell condition, but the 34C phase color shows weakening selling pressure.

LOOK FOR SELLS
Early bearish structure is forming with MA support and RSI weakness beginning to build.

EARLY SELL
RSI conditions are weakening before the full sell structure is confirmed.

BUY CAUTION
A warning state where price may look bullish, but RSI has moved below the RSI 34SMA while still above the 50 area. This can warn that buy pressure is weakening.

SELL CAUTION
A warning state where price may look bearish, but RSI has moved above the RSI 34SMA while still below the 50 area. This can warn that sell pressure is weakening.

NO TRADE
The timeframe does not currently meet a clean buy, sell, early, or caution condition.

R34

Shows how many bars have passed since RSI last crossed its 34-period RSI SMA.

This helps traders see whether the RSI move is fresh or already mature.

  • A low number means the RSI cross is recent.

  • A higher number means the RSI condition has been running longer.

  • The color shows whether RSI is currently above or below its 34SMA.

34v50

Shows the distance between the RSI 34SMA and the 50 level.

This helps identify whether the RSI 34SMA is clearly above or below the centerline.

  • Green means the RSI 34SMA is above 50.

  • Red means the RSI 34SMA is below 50.

  • Yellow means it is near the neutral zone.

The number is displayed as an absolute distance, while the color shows direction.

RD

Shows the distance between live RSI and the RSI 34SMA.

This helps show how far RSI has separated from its average.

  • Green means RSI is above the RSI 34SMA.

  • Red means RSI is below the RSI 34SMA.

  • Yellow means RSI is close to the RSI 34SMA.

A larger number means RSI is farther away from the 34SMA.

GAP

Shows the live distance between MA5 and MA13.

This helps traders see whether the moving averages are close together or strongly separated.

  • Green means MA5 is above MA13.

  • Red means MA5 is below MA13.

  • Yellow means the gap is very small or near neutral.

The number is displayed as an absolute distance in pips or chart units depending on the symbol.

GAPD

Shows whether the MA5/MA13 gap is expanding, shrinking, or flat compared with the previous bar.

Possible values:

EXP
The MA gap is expanding.

SHR
The MA gap is shrinking.

FLT
The MA gap is flat or has not changed enough to be meaningful.

This column is useful for spotting whether momentum is increasing or fading.

G5

Shows the live distance between current price and MA5.

This helps traders see how far price has moved away from the fast moving average.

  • Green means price is above MA5.

  • Red means price is below MA5.

  • Yellow means price is very close to MA5.

The number is displayed as an absolute distance in pips or chart units depending on the symbol.

X

Shows how many bars have passed since the most recent MA5/MA13 cross.

This helps traders compare fresh MA crosses against older running trends.

  • A low number means the MA cross is recent.

  • A high number means the current MA structure has been running longer.

  • Green means the current MA structure is bullish.

  • Red means the current MA structure is bearish.

  • Yellow can highlight the freshest cross among the displayed timeframes if enabled.

34C

Shows the current color state of the RSI 34SMA phase engine.

The 34C column is based on whether the RSI 34SMA is above or below 50 and whether it is rising or falling.

Possible values:

GREEN
RSI 34SMA is above 50 and rising.

LIME
RSI 34SMA is above 50 but falling.

CORAL
RSI 34SMA is below 50 but rising.

RED
RSI 34SMA is below 50 and falling.

This column helps traders quickly understand whether momentum structure is strengthening, weakening, recovering, or declining.

%K

Shows the smoothed Stoch RSI %K value.

This gives a fast momentum reading from 0 to 100.

By default, the %K value is displayed as a momentum number, not as a direct buy or sell signal. Optional threshold colors can be used for high and low %K areas.

How Traders Can Use It

MTF Phase Engine Mini Dashboard can help traders:

  • Compare market condition across multiple timeframes

  • See whether lower and higher timeframes are aligned

  • Identify early buy or sell development

  • Spot weakening buy or sell conditions

  • Track RSI strength versus RSI 34SMA

  • Monitor whether the MA5/MA13 gap is expanding or shrinking

  • See how stretched price is from the 5 MA

  • Find fresh MA crosses across multiple timeframes

  • Confirm whether momentum is building, fading, or neutral

This makes it useful for scalping, intraday trading, swing trading, trend-following, pullback planning, and multi-timeframe confirmation.

Best Used For

This indicator can be used on:

  • Gold

  • Forex pairs

  • Indices

  • Crypto

  • Oil and commodities

  • Any MetaTrader symbol with active price movement

It is especially useful for traders who use RSI, moving averages, momentum structure, and multi-timeframe alignment in their trading decisions.

Important Note

MTF Phase Engine Mini Dashboard is a technical analysis tool. It does not predict future price movement and does not guarantee profitable trades.

The dashboard is designed to help organize market information and highlight current conditions. It should be used together with your own trading plan, market analysis, and risk management.


Produtos recomendados
Trend Transition is a hybrid indicator, as it is based on signals from several well-known products: RSI and MA. MA is a trend indicator of the average true range, which determines the range of minimum and maximum price fluctuations, as well as closing prices. RSI is an indicator of the family of oscillators. The indicator helps to calculate the oversold and overbought levels of a trading instrument. When a trend changes, the Trend Transition indicator uses a color alarm: blue - when changing f
Определения текущей тенденции одна из самых важных задач трейдера не зависимо от стиля торговли. Индикатор  Price Detect   Volume поможет с достаточно высокой вероятностью это сделать. Price Detect Volume  - индикатор распознавания тенденции, использующий авторский алгоритм расчета, использующий объемы. Показания индикатора не изменяются не при каких условиях. Также с помощью индикатора можно наблюдать за коррекцией цены в сторону глобального тренда, определять возможные границы окончания отката
TWO SYMBOLS CORRELATION  line indicator    It compares the power/strength lines of two user input symbols and create a SMOOTHED line that indicates the degree of deviation of the 2 symbols Strategy#1- FOLLOW THE INDICATOR THICK LINE when CROSSING O LEVEL DOWN --- TRADE ON INDICATOR THICK LINE (TREND FRIENDLY) !! Strategy#2- TRADE INDICATOR PEAKS (Follow indicator Reversal PEAKS Levels)!! you input - the index of calculation ( 10/20/30....)                 - the indicator Drawing start point (ind
A top-quality from the famous XSuper Trend indicator. It is completely loyal to the original algorithm, and implements many useful features Which includes Trend Indicators as Filters like MACD,CCI and Alligator. The Chefs Super Trend Plus Indicator is a great way to identify the current market trend. The indicator shows a clear distinction between uptrends and downtrends. The indicators has optional filters for sound signal. Suitable for the following trending pairs: EUR/USD, GBP/USD, USD/JPY,
The HHHC-LLLC indicator uses candle by candle analysis, based on the principle of trend confirmation from Higher High, Higher Close candles (bullish) and Lower Low, Lower Close candles (bearish). There is no lag, no re-painting, and averaging is not used. HHHC-LLLC helps confirm: market structure and levels - look left to see them line up trends, pullbacks & reversals Bull moves (blue), Bear moves (red) Structure Zig Zags (black dotted lines), for summarizing market moves exhaustion and stalling
Description Trend Influencer is an indicator that determines the potential dynamics of the influence of trend wave movements on the market. The indicator is based on the value of moving averages corrected by the standard deviation. The indicator is displayed as a main dash-dotted moving average and a signal solid moving average. The signal moving average is colored blue or red depending on what type of trend is currently observed in the market. The indicator also draws inhibition levels - blue a
Com esta ferramenta de negociação, você pode analisar 15 mercados simultaneamente. Apresentando o novo indicador de negociação 2024: ️ Painel Estocástico Multi Moeda Multi Time Frame. Há pelo menos duas razões pelas quais criei esta ferramenta de negociação: Primeiro, estou cansado de observar apenas um mercado. Segundo, não quero perder o momento de entrada em outro mercado. É por isso que quero conhecer outras condições de mercado ao mesmo tempo. Por esta razão, preciso de um scanner q
Normalized Volume 99% of indicators are based on price analysis. This indicator is based on volume. Volume is overlooked piece of information in most trading systems. And this is a big mistake since volume gives important information about market participants. Normalized Volume is an indicator that can be used to confirm reversal points. The indicator code volume with colors indicating high, normal and low volume. You could enhance dramatically your trading system using volume analysis. 
Multi-Timeframe EMA Momentum Filter — Version 1.0 This indicator is designed to help traders evaluate short-term EMA crossovers in the context of higher timeframe momentum. Its purpose is to reduce noise and highlight setups that align with the broader market trend. How it works: On the main chart, arrows appear when a fast EMA crosses a slow EMA on the current timeframe, provided that higher timeframe momentum confirms the direction. In the subwindow, a histogram displays the difference betwee
FREE
Atomic CHOCH BOS Trend Indicator v1.4 TRADING AUTOMATION EXPERTS - MT4 tools designed to enhance trader performance. Master the Smart Money Strategy with Precision _____________________________________________________________________________________________________________________________________________________________________________ Smart Market Structure Analysis Unlock the power of smart market structure analysis with the Atomic Break of Structure Change of Character (CHOCH) / Break of Str
Heiken Ashi Smoothed Strategy is a very simple but powerful system to get forex market trend direction. This indicator is actually 2 indicators in 1 pack, Heiken Ashi and Heiken Ashi Smoothed Moving Average both included. Because HA (Heiken Ashi) and HAS (Heiken Ashi Smoothed) are calculated in the same one system event with necessary buffers and loop only, so it is the FAST, OPTIMIZED and EFFICIENT HA having the combined indicator of MetaTrader 4. You can choose to display HA and HAS in the sam
RSI Jurik
Augustine Kamatu
Introducing RSI Jurik—an innovative indicator designed to revolutionize your forex trading strategy by combining custom moving averages based on the Relative Strength Index (RSI) with the MetaTrader 4 indicator, RSI. Jurik moving averages are renowned for their accuracy and reliability in analyzing price movements in the forex market. They provide traders with smoother representations of price action, reducing noise and offering clearer signals for identifying trends and potential reversals.
FREE
ECRO – Extreme Compression & Release Oscillator ECRO (Extreme Compression & Release Oscillator) é um indicador de análise técnica desenvolvido para identificar estados de compressão, expansão e transição do mercado através de um oscilador normalizado baseado no fechamento (0–100) . O indicador mede onde o preço de fechamento atual está posicionado dentro de uma faixa de preços móvel (rolling range) e retorna um valor entre 0 e 100 , tornando as condições de mercado fáceis de interpretar rapidam
O indicador de seta "Cool volumes" foi criado com base nos volumes de ticks na MT4. O próprio indicador rastreia em um determinado período de tempo (escolha do período de tempo) o número de volumes para comprar ou vender. E quando há um excesso anormal de volumes de vendedores ou compradores, ele emite um sinal de venda ou compra. Na janela inferior, Os gráficos de barras coloridos são desenhados, onde a cor verde mostra a predominância de compradores no momento, o que significa uma possível
Sarangani Venom
Sherwin Dennis Tava Ruiz
sarangani venom is 100% profitable, easy to use indicator, a chart without indicator is stressful and will lead you to many losses, this indicator is pleasing to the eye that will gives you more confident to trade when there is signal, your computer will gives sound and the spider will animate, it can be used to all time frame and to all currency, you have many options, when the candlestick touches to upper line it is buy, when it touches to lower line it is sell, when the rope is pull to buy ar
Rung
Iurii Tokman
Rung   Indicador de tendência. O indicador identifica e marca em cores diferentes as principais tendências do movimento dos preços, ao mesmo tempo que elimina e não reage ao ruído e aos movimentos dos preços de curto prazo contra a tendência principal. O indicador é uma ferramenta que determina a tendência atual do mercado. Com as configurações padrão, uma tendência de alta ("tendência de alta"), o indicador marca com uma linha verde, uma tendência de baixa ("tendência de baixa") - com uma linha
FREE
Changend
Victor Golovkov
The Changend signal indicator works on all timeframes and any markets. Analyzes data in the specified period and gives signals for a possible trend change (sell or buy). The indicator has only two settings: Period bars   - the number of last bars for data analysis Deviation level of bars  -the degree of deviation from the analyzed data Additionally, in the indicator settings, you can set your own style of signal display: Size Arrow Code Arrow Buy Color Arrow Buy Code Arrow Sell Color Arrow Sel
Primus Smart Money is an indicator that shows the average of bulls and bears on an asset. Used as a confirmation indicator for bullish and bearish control to assist in predicting future price moves Advantages Used in ALL financial markets including binary options on ALL asset classes or instruments. To be used as a confirmation tool with other indicators Parameters Period - default set to 9 (Recommended) Entry requirements Focus on the clusters on the indicator - the height or depth of the bars
This is an indicator that helps you to scan the whole timeframe then informs you about the last candle position Engulfing Candlestick pattern was formed. The indicator also send alert to your mobile when a new engulfing candle is formed.  For the visual; 1. Green up arrow indicates a bullish engulfing candlestick pattern  2. Red down arrow indicates a bearish engulfing candlestick pattern
FREE
Trend Reversal Zone and Alert
Godwin Edward Enyali
5 (1)
Trend Reversal Zone and Alert Zonas de Oferta e Demanda Multi-Timeframe + Sinais Precisos de Reversão Trend Reversal Zone and Alert é um indicador profissional de estrutura de mercado sem repaint , desenvolvido para traders que desejam identificar reversões de alta probabilidade em níveis institucionais importantes . O indicador combina de forma inteligente zonas de oferta e demanda dos timeframes superiores (H4 e D1) com sinais precisos de rejeição nos máximos e mínimos diários , permitindo ent
RSI MA Regime Engine — Multi-Phase Trend & Momentum Filter for MT4 RSI MA Regime Engine   is a professional visual trading indicator designed to help traders understand market phase, momentum direction, and moving average structure at a glance. Instead of showing a plain RSI line, this tool transforms RSI into a   market regime map , combining RSI behavior, 34SMA trend structure, 5/13 moving average interaction, slope, cross conditions, and visual phase coloring. It is built for traders who want
The indicator is based on pair trading methods. It is not redrawn unlike similar indicators. Shows correlation between two selected instruments in percent for a predetermined period, and the positions of the instruments relative to each other. Has a function for reverse display of any of the analyzed symbols - for instruments with negative correlation. Can be drawn as a line or as a histogram. Settings: Symb1 - first symbol name. Revers1 - reverse display of the first symbol. Symb2 - second symb
This is Multiple Timeframe of Malaysia SNR Levels and Storyline. The single timeframe version   here Features: + Display level on multiple timeframe (higher or lower) + Turn on/off level on timeframe + Alert when price touch level 1. if high > resistance level but close of candle < resistance level , this level become unfresh - Name of level will have "(m)" meaning mitigated if   close of candle > resistance level , this level become invalid and can be removed in chart (there is setting for keep
Wall of worry
Illia Zhavarankau
Description: The Wall of Worry indicator allows you to assess market sentiment and possible reversals. The indicator represents three lines that are displayed in a separate window. Black line (trend) - the amount of volumes in the candle body. Red line (bears) - the amount of volumes in the upper shadow of the candlestick. Blue line (bulls) - the amount of volumes in the lower shadow of the candle. The idea is based on "Wall of Worry" - this is the periodic tendency of financial markets to
The DMI MultiTimeframe EMA indicator is designed to facilitate multi-timeframe analysis by displaying a moving average from a specific timeframe (like H1 or D1) on any other chart timeframe. This tool allows traders to have a broader view across multiple timeframes directly on the current chart, enhancing precision and understanding of market trends. Parameters : Moving Average Timeframe : Sets the timeframe for the moving average, such as H1 for hourly or D1 for daily. Default: H1. Moving Avera
This indicator works on every currency pairs and time frames (TF). One input parameter: nPeriod - number of bars for histogram calculation. I recommend to optimize nPeriod value for each TF. If Green histogram poles are crossing the zero line from below then Long position may be opened. If Red histogram poles are crossing the zero line from above then Long position may be opened.
RSI Scanner is a multi symbol multi timeframe RSI dashboard that monitors Relative Strength Index indicator for price entering and exiting overbought and oversold in up to 28 symbols and 9 timeframes. Download Demo here  (Scans only M1 and W1) Settings description   here MT5 version   here RSI Scanner features: Signals RSI entering and exiting the overbought and oversold zones. Monitors 28 customizable instruments and 9 timeframes at the same time. You can choose between 3 alert modes:  Singl
El indicador "MR BEAST ALERTAS DE LIQUIDEZ" es una herramienta avanzada diseñada para proporcionar señales y alertas sobre la liquidez del mercado basándose en una serie de indicadores técnicos y análisis de tendencias. Ideal para traders que buscan oportunidades de trading en función de la dinámica de precios y los niveles de volatilidad, este indicador ofrece una visualización clara y detallada en la ventana del gráfico de MetaTrader. Características Principales: Canal ATR Adaptativo: Calcula
Institutional Fusion Levels (Níveis de Fusão Institucional) Institutional Fusion Levels é um indicador profissional de suporte e resistência multi–timeframe, desenvolvido para identificar zonas de reação de preço com alta probabilidade institucional usando níveis de estrutura de mercado do dia anterior, semana anterior e mês anterior. O indicador plota automaticamente no gráfico áreas-chave de suporte e resistência baseadas em liquidez e destaca zonas de forte confluência onde níveis de timefram
Heikin-Ashi-Sniper is a perfect addition to your portfolio. It is meant to be traded on EURUSD on H1 Timeframe. It uses Heikin-Ashi High and Low/High of Monthly timeframe to determine optimal entry signals while having a reasonably low drawdown More EA´s will be published shortly to complete the Portfolio. The EA Trades not very frequently it waits for the right chance and places the order. The rest of the time, your capital is free to be traded on other strategies Please see backtest results i
FREE
Os compradores deste produto também adquirem
Neuro Poseidon MT4
Daria Rezueva
4.84 (43)
Neuro Poseidon is a new indicator by Daria Rezueva. It combines precise trading signals with adaptive TP/SL levels - creating best possible trades as a result! Message me and get  Neuro Poseidon Assistant  as a gift to automize your trading process! What makes it stand out? 1. Proven profitability on all assets and timeframes 2. Only confirmed BUY and SELL signals present on the chart 3. Adaptive TP & SL levels generated by the software for each trade 4. Easy to understand - suitable for all
Gann Made Easy
Oleg Rodin
4.84 (167)
Gann Made Easy é um sistema de negociação Forex profissional e fácil de usar, baseado nos melhores princípios de negociação usando a teoria do sr. W. D. Gann. O indicador fornece sinais precisos de COMPRA e VENDA, incluindo níveis de Stop Loss e Take Profit. Você pode negociar mesmo em movimento usando notificações PUSH. Entre em contato comigo após a compra para receber instruções de negociação e ótimos indicadores extras gratuitamente! Provavelmente você já ouviu muitas vezes sobre os métodos
Prop Firm Sniper
Mohamed Hassan
5 (1)
Prop Firm Sniper MT4  is a professional market structure indicator that automatically identifies high-probability BUY and SELL opportunities using BOS and CHoCH analysis. Recommended Timeframes: For backtesting, use the indicator on   M5 or M15   for Gold (XAUUSD), and   M15 or H1   for more volatile Forex pairs such as   GBPUSD, USDJPY, EURGBP , and similar markets. CONTACT ME AFTER PURCHASE TO CLAIM YOUR FREE BONUSES! Prop Firm Sniper  is a professional market structure indicator designed t
Super Signal – Skyblade Edition Sistema profissional de sinais de tendência sem repintar / sem atraso com taxa de acerto excepcional | Para MT4 / MT5 Funciona melhor em timeframes mais curtos, como 1 minuto, 5 minutos e 15 minutos. Principais características: Super Signal – Skyblade Edition é um sistema inteligente de sinais desenvolvido especificamente para operações com tendência. Utiliza uma lógica de filtragem em múltiplas camadas para detectar apenas movimentos direcionais fortes sustenta
Este produto foi atualizado para o mercado de 2026 e otimizado para as versões mais recentes do MT5. AVISO DE ATUALIZAÇÃO DE PREÇO: Smart Trend Trading System está atualmente disponível por $99 . O preço aumentará para $199 após as próximas 30 compras . OFERTA ESPECIAL: Após comprar o Smart Trend Trading System, envie-me uma mensagem privada para receber o Smart Universal EA GRÁTIS e transformar seus sinais do Smart Trend em operações automatizadas. Smart Trend Trading System é um sistema de tr
Neo Wave PRO
Nikolay Raykov
5 (1)
Price & Time Market Structure Indicator A professional market structure tool that analyzes waves through both price and time — not price alone. Main Description NeoWave PRO is a professional market structure indicator for MetaTrader 4 designed for traders who want to move beyond traditional one-dimensional wave tools such as ZigZag, swing indicators, and basic high/low systems. Most wave indicators analyze only one thing: Price. But a real market wave is not only a price movement. A true wave de
M1 Sniper
Oleg Rodin
5 (24)
O M1 SNIPER é um sistema indicador de negociação fácil de usar. É um indicador de seta projetado para o período M1. O indicador pode ser usado como um sistema independente para scalping no período M1 e pode ser usado como parte do seu sistema de negociação existente. Embora este sistema de negociação tenha sido projetado especificamente para negociação no M1, ele também pode ser usado em outros períodos. Originalmente, desenvolvi este método para negociar XAUUSD e BTCUSD. Mas considero-o útil ta
Trend Catcher ind
Ramil Minniakhmetov
5 (10)
INDICADOR TREND CATCHER O Indicador Trend Catcher analisa os movimentos de preços do mercado, utilizando uma combinação de indicadores de análise de tendências adaptativos, proprietários e personalizados pelo autor. Identifica a verdadeira direção do mercado, filtrando o ruído de curto prazo e focando a força do momentum subjacente, a expansão da volatilidade e o comportamento da estrutura de preços. Utiliza também uma combinação de indicadores personalizados de suavização e filtragem de tendê
ORB Seeker
Marcela Goncalves De Oliveira
Preço especial de lançamento! Apenas 79 dólares! O preço aumentará após 10 vendas, preço final de $199. Após a compra, entre em contato comigo para receber um EA bônus GRATUITO que pode operar com sinais de rompimento de forma totalmente automatizada e com arquivos de configuração otimizados. Faça sessões de tratamento eficazes com confiança! O ORB Seeker é um indicador profissional de Ruptura da Faixa de Abertura (ORB, na sigla em inglês) desenvolvido para traders que buscam precisão, simplic
Dynamic Forex28 Navigator
Bernhard Schweigert
4.43 (7)
Dynamic Forex28 Navigator - A ferramenta de negociação Forex de última geração. ATUALMENTE 49% DE DESCONTO. Dynamic Forex28 Navigator é a evolução dos nossos indicadores populares de longa data, combinando o poder de três em um: Indicador Advanced Currency Strength28 (695 avaliações) + Advanced Currency IMPULSE com ALERTA (520 avaliações) + Sinais CS28 Combo (Bônus). Detalhes sobre o indicador https://www.mql5.com/en/blogs/post/758844 O que o Next-Generation Strength Indicator oferece?  Tudo
Indicador Miraculous – Ferramenta 100% Não Repintável para Forex e Opções Binárias Baseada no Quadrado de Nove de Gann Este vídeo apresenta o Indicador Miraculous , uma ferramenta de negociação altamente precisa e poderosa, desenvolvida especificamente para traders de Forex e Opções Binárias . O que torna este indicador único é a sua base no lendário Quadrado de Nove de Gann e na Lei da Vibração de Gann , tornando-o uma das ferramentas de previsão mais precisas disponíveis na negociação moderna.
Advanced Supply Demand
Bernhard Schweigert
4.91 (300)
Atualmente com 30% de desconto! A melhor solução para qualquer Trader Novato ou especialista! Este indicador é uma ferramenta de negociação exclusiva, de alta qualidade e acessível porque incorporamos uma série de recursos proprietários e uma nova fórmula. Com esta atualização, você poderá mostrar fusos horários duplos. Você não só será capaz de mostrar um TF mais alto, mas também mostrar ambos, o TF do gráfico, MAIS o TF mais alto: MOSTRANDO ZONAS ANINHADAS. Todos os traders de Oferta e Demanda
ACTUALMENTE COM 40% DE DESCONTO A melhor solução para qualquer novato ou comerciante especializado! Este Indicador é uma ferramenta comercial única, de alta qualidade e acessível, porque incorporámos uma série de características proprietárias e uma nova fórmula. Com apenas UM gráfico, pode ler a força da moeda para 28 pares de Forex! Imagine como a sua negociação irá melhorar porque é capaz de apontar o ponto exacto do gatilho de uma nova tendência ou oportunidade de escalada? Manual do util
PZ Trend Trading
PZ TRADING SLU
4.8 (5)
O Trend Trading é um indicador projetado para lucrar o máximo possível com as tendências que ocorrem no mercado, cronometrando retrocessos e rupturas. Ele encontra oportunidades de negociação analisando o que o preço está fazendo durante as tendências estabelecidas. [ Guia de instalação | Guia de atualização | Solução de problemas | FAQ | Todos os produtos ] Negocie mercados financeiros com confiança e eficiência Lucre com as tendências estabelecidas sem ser chicoteado Reconhecer retrocessos
O sistema PRO Renko é um sistema de negociação altamente preciso especialmente concebido para a negociação de gráficos RENKO. Trata-se de um sistema universal que pode ser aplicado a vários instrumentos de negociação. O sistema neutraliza eficazmente o chamado ruído de mercado, dando-lhe acesso a sinais de inversão precisos. O indicador é muito fácil de usar e tem apenas um parâmetro responsável pela geração de sinal. Você pode facilmente adaptar a ferramenta a qualquer instrumento de negocia
Atomic Analyst
Issam Kassas
5 (8)
Este produto foi atualizado para o mercado de 2026 e otimizado para as versões mais recentes do MT5. AVISO DE ATUALIZAÇÃO DE PREÇO: Atomic Analyst está atualmente disponível por $99 . O preço aumentará para $199 após as próximas 30 compras . OFERTA ESPECIAL: Após comprar o Atomic Analyst, envie-me uma mensagem privada para receber o Smart Universal EA GRÁTIS e transformar seus sinais do Atomic Analyst em operações automatizadas. Atomic Analyst é um indicador de trading de Price Action sem repa
Scientific trade
Aleksey Ivanov
5 (1)
An extremely convenient indicator that truly makes the process of making money on the exchange easy. It is based on the scientifically rigorous theory of the market developed by the author, the beginning of which is presented here .                The full algorithm of this indicator operation is presented in the article .               The indicator calculates the most probable price movement trajectory and displays it on the chart. Based on the predicted price movement trajectory
Market Structure Patterns MT4
Samuel Manoel De Souza
5 (18)
Market Structure Patterns   é um indicador baseado em   smart money concepts   que apresenta elementos de   SMC/ICT   capazes de elevar suas decisões de negociação a um novo patamar. Aproveite os   alertas ,   notificações   push   e   mensagens  por  e-mail   para ser informado sobre quando um elemento se forma no gráfico, o preço cruza um nível e/ou entra em uma região delimitada por uma retângulo. Desenvolvedores podem acessar valores dos elementos do indicador por meio de   variáveis globais
CRT Candle Range Theory HTF MT4.   Ultimate CRT Indicator: Advanced ICT Concepts and Malaysian SnR Trading System Master the Market Maker's Footprints with the Most Advanced Candle Range Theory Indicator Discounted   Price   $50  !!     Secure your lifetime access   now   before it switches to   subscription-only ! Unlock the true power of  Smart Money Concepts (SMC)  and trade precisely like the institutions with the  Ultimate CRT Indicator . Built exclusively for serious traders, this indicat
Scalping Lines System -  é um sistema de scalping concebido especificamente para negociar o ativo Ouro (XAUUSD) em timeframes de M1 a H1. Combina indicadores de tendência, volatilidade e análise de mercado de sobrecompra/sobrevenda, reunidos num único oscilador para identificar sinais de curto prazo. Os principais parâmetros internos das linhas de sinal estão pré-configurados. Alguns parâmetros permanecem para ajuste manual: "Duração da Onda de Tendência", que regula a duração de uma série de
BTMM State Engine Pro is a MetaTrader 4 indicator for traders who use the Beat The Market Maker approach: Asian session context, kill zone timing, level progression, peak formation detection, and a multi-pair scanner from a single chart. It combines cycle state logic with a built-in scanner dashboard so you do not need the same tool on many charts at once. What it does Draws the Asian session range; session times can follow broker server offset or be set in inputs. Tracks level progression (L
Friends, we present to your attention our new Forex Gump Laser indicator. Since there are no designers in our team, but mainly mathematicians, financiers, programmers and traders, we did not make any special changes in the indicator design. In appearance, it resembles the usual Forex Gump. On the other hand, Forex Gump has become not just the name of an indicator, it is a brand. And we try to preserve the corporate identity in all its varieties. The whole essence of the indicator in its operatio
Scalper Inside PRO
Alexey Minkov
4.68 (69)
Scalper Inside PRO Scalper Inside PRO is an intraday trend and scalping indicator that uses exclusive built-in algorithms to evaluate market direction and key target levels. The indicator automatically calculates entry and exit points and several profit target levels, and it shows detailed performance statistics, so you can see how different instruments and strategies behaved on historical data. This helps you select instruments that fit current market conditions. You can also connect your own a
System Trend Pro
Aleksandr Makarov
5 (2)
System Trend Pro - This is the best trend trading indicator!!! The indicator no repaint!!!  The indicator has   MTF   mode, which adds confidence to trading on the trend (   no repaint   ). How to trade? Everything is very simple, we wait for the first signal (big arrow), then wait for the second signal (small arrow) and enter the market in the direction of the arrow. (See screens 1 and 2.) Exit on the opposite signal or take 20-30 pips, close half of it, and keep the rest until the opposite
Documentation for connecting Metatrader 4 with Python with a simple drag and drop EA.   A full end-to-end solution ,fully tested ,fast and efficient! The Pytrader ecosystem consists of a python script and a MT4 EA. (  MT5  version ) Further for the licensing an indicator is used.  The communication between the python script and the EA is based on sockets. EA is the  Server   and the python script the  Client .  It is always query(function / python script) and output(data / server). The EA doe
KURAMA GOLD SIGNAL PRO (MT4) — Filtro de 7 camadas · TP/SL automático · Pontuação de qualidade · Salvamento do histórico de sinais | Sistema completo de trading para XAUUSD Sem repintura em tempo real. No instante em que um sinal aparece, a seta, a entrada, o TP e o SL ficam travados no lugar e nunca mais se movem. O que você opera é esse sinal em tempo real. E na v7.20, cada sinal realmente enviado é salvo automaticamente e restaurado com exatidão após reiniciar. BÔNUS PARA
Day Trader Master é um sistema de negociação completo para day traders. O sistema é composto por dois indicadores. Um indicador é um sinal de seta para comprar e vender. É o indicador de seta que você obtém. Eu fornecerei o segundo indicador gratuitamente. O segundo indicador é um indicador de tendência especialmente projetado para ser usado em conjunto com essas setas. OS INDICADORES NÃO SE REPETEM E NÃO SE ATRASAM! A utilização deste sistema é muito simples. Você só precisa seguir os sinais de
Reversal Identifier MT5 - Um indicador capaz de encontrar pontos de reversão num gráfico. Funciona sem redesenhar ou apresentar atrasos, identifica picos e vales fractais e marca as reversões com setas. O indicador identifica pontos de reversão iniciais, após os quais ocorre uma correção ou mudança na direção da tendência. O melhor caso de utilização para este indicador é em dois períodos de tempo, utilizando o período mais longo para determinar a tendência e o período mais curto para receber s
Forex Breath System é um sistema de negociação baseado em tendências que pode ser usado em qualquer mercado. Você pode usar este sistema com moedas, metais, commodities, índices, criptografia e até ações. Também pode ser usado em qualquer período de tempo. O sistema é universal. Ele mostra tendência e fornece sinais de seta com a tendência. O indicador também pode fornecer um tipo especial de alerta quando os sinais aparecem na direção da tendência, o que torna a negociação de tendências uma tar
O Apollo BuySell Predictor é um sistema de negociação profissional que inclui vários módulos de negociação. Ele fornece ao trader zonas de rompimento exclusivas, níveis de suporte e resistência baseados em fibonacci, linha de tendência de pivô, sinais de volume de recuo e outros recursos úteis que qualquer trader precisa diariamente. O sistema funcionará com qualquer par. Os prazos recomendados são M30, H1, H4. Embora o indicador também possa funcionar com outros prazos, exceto os prazos superio
Mais do autor
Wick & Liquidity Zones Tracker – Advanced Gold & Forex Cluster Indicator “See Where Big Players Move — Trade Gold & Forex Like an Insider!” Liquidity Zones instantly reveals hidden liquidity clusters, swing reversals, and breakout points, giving you the edge most traders only dream of. Key Features  Liquidity Zone Detection: Automatically identifies unbalanced bullish & bearish candles , marking zones where price is likely to reverse or accelerate. Cluster Analysis: Groups consecutive candles
Gold Session Liquidity Map Gold Session Liquidity Map is a specialized intraday session-mapping indicator designed for Gold/XAUUSD traders who want a cleaner way to read session structure, liquidity zones, retest areas, wick-source zones, reaction gates, and Fibonacci extension targets. Most session indicators focus mainly on the major Asia, UK, and US sessions. Gold Session Liquidity Map goes deeper by focusing on two powerful but often-overlooked intraday structures: Sydney session range Germa
Opposite Candle Fuel Fib Engine — Advanced Fibonacci Projection Tool for MT4 Opposite Candle Fuel Fib Engine   is a professional MetaTrader 4 indicator designed to project Fibonacci levels from opposite-color candle structures inside an active price move. Many traders draw Fibonacci levels only from swing high to swing low. This tool uses a more specialized approach: it detects important opposite-color candles inside the current leg and treats those candles as key fuel/reference points for futur
Gold Weekly High Trap Zones Weekly High Trap Zones   is a clean MT4 weekly range-mapping indicator designed to help traders identify the key trap zone created around the current week’s high. The indicator finds the current weekly high, identifies the session range connected to that high, and then projects a structured trap-zone ladder from that range. It displays the important weekly high origin level, trap zone top and bottom, 100 level, 161.8 target, 261.8 target, and optional higher extension
SmartADR v2.80 SmartADR v2.80   is an advanced Average Daily Range mapping indicator for MetaTrader 4. It is designed to help traders build a clear intraday range map using the Daily Open, ADR high/low projections, Fibonacci reaction levels, ADR zones, and previous unbroken ADR targets. Instead of showing only a simple ADR high and ADR low, SmartADR creates a full visual structure around the market open. This allows traders to see where price may expand, pause, reject, pull back, or complete its
GC Regime Divergence Panel GC Regime Divergence Panel   is a compact multi-timeframe market condition dashboard for MT4. It is designed to help traders quickly read trend regime, pullback conditions, and RSI divergence across multiple timeframes without switching charts. The indicator displays a clean on-chart panel showing each timeframe, the current market regime, and any detected RSI divergence. It combines moving average structure, MA gap behavior, RSI pressure, RSI 34SMA comparison, and swi
RSI 34 Last Range Tracker RSI 34 Last Range Tracker   is a visual range-tracking indicator for MT4 that helps traders identify the most recent RSI momentum shift and project the important reaction zone from that candle. The indicator tracks crosses between RSI and its 34-period RSI moving average. When a bullish or bearish RSI cross occurs, the indicator marks the cross candle with a dot and draws the related price range, including the candle high, candle low, and the important 38.2 / 61.8 middl
GC Volume Profile GC Volume Profile   is a professional MT4 volume profile indicator designed to help traders see where market activity is concentrated, where buyers and sellers are positioned, and where important volume-based reaction zones may exist. The indicator builds a horizontal tick-volume profile directly on the chart using either a fixed lookback range or the visible chart area. It separates bullish and bearish volume, highlights important volume nodes, shows the Point of Control, disp
Daily Weekly Monthly Open Map Daily Weekly Monthly Open Map   is a clean price-level mapping indicator for MT4 that helps traders track important open-price levels across the daily, weekly, and monthly market structure. Many markets repeatedly react around previous daily, weekly, and monthly open prices. These levels can act as support, resistance, liquidity targets, unfinished-business areas, and important reference points for intraday and swing trading. This indicator automatically plots curre
Daily Open Mirror Engine — Wick & Body Mirror Levels for MT4 Daily Open Mirror Engine   is a professional MetaTrader 4 indicator designed to project mirrored price levels from the current daily open. Many intraday moves react strongly around the daily open. This indicator uses the daily open as the central reference point and automatically projects mirrored levels from important wick and body extremes, helping traders identify possible reaction zones, liquidity targets, support, resistance, and
Gold Zones Liquidity Wick Zones Liquidity   is a visual support and resistance zone indicator designed to help traders identify important reaction areas created from swing highs, swing lows, wick zones, and liquidity candle clusters. Instead of drawing random horizontal levels, the indicator studies the most important visible swing high and swing low on your chart using ZigZag structure. From those swing points, it automatically builds clean 38.2 and 61.8 liquidity zones that can act as reaction
Swing Volume Phase Swing Volume Phase   is a visual market-structure and volume-pressure indicator designed to help traders quickly understand who is controlling the current move:   buyers or sellers . Instead of looking at candles alone, this tool focuses on the volume behind important swing highs, swing lows, and completed price legs. It helps identify whether the current market phase is being supported by stronger buying pressure, stronger selling pressure, or a possible shift in control. The
MA Gap Tracker Engine — Multi-Timeframe 5/13 SMMA Distance & Trend Panel for MT4 MA Gap Tracker Engine   is a professional MetaTrader 4 indicator designed to track the live relationship between price, the 5 SMMA, and the 13 SMMA across multiple timeframes. This tool helps traders quickly see whether price is above or below the moving averages, whether the 5/13 MA structure is bullish or bearish, and most importantly, whether the moving average gap is   expanding, shrinking, or flat . Instead of
Session Liquidity Map Engine — Sydney, Asia, German, UK & US Range Structure for MT4 Session Liquidity Map Engine   is a professional MetaTrader 4 indicator designed to map the most important intraday trading sessions directly on your chart. The indicator automatically draws key session boxes, tracks session highs and lows, identifies active and taken liquidity levels, and displays a compact real-time information panel so traders can quickly understand where price is in relation to the major mar
Monday Asia Weekly Fib Engine — Weekly Session Projection Levels for MT4 Monday Asia Weekly Fib Engine   is a MetaTrader 4 indicator designed to project key weekly Fibonacci levels from the   Monday Asia trading session range . Many weekly moves begin with a clear liquidity range during the early Asia session. This indicator automatically identifies that Monday Asia range and projects Fibonacci expansion and retracement levels across the week, helping traders track possible breakout areas, conti
RSI MA Regime Engine — Multi-Phase Trend & Momentum Filter for MT4 RSI MA Regime Engine   is a professional visual trading indicator designed to help traders understand market phase, momentum direction, and moving average structure at a glance. Instead of showing a plain RSI line, this tool transforms RSI into a   market regime map , combining RSI behavior, 34SMA trend structure, 5/13 moving average interaction, slope, cross conditions, and visual phase coloring. It is built for traders who want
Filtro:
Sem comentários
Responder ao comentário