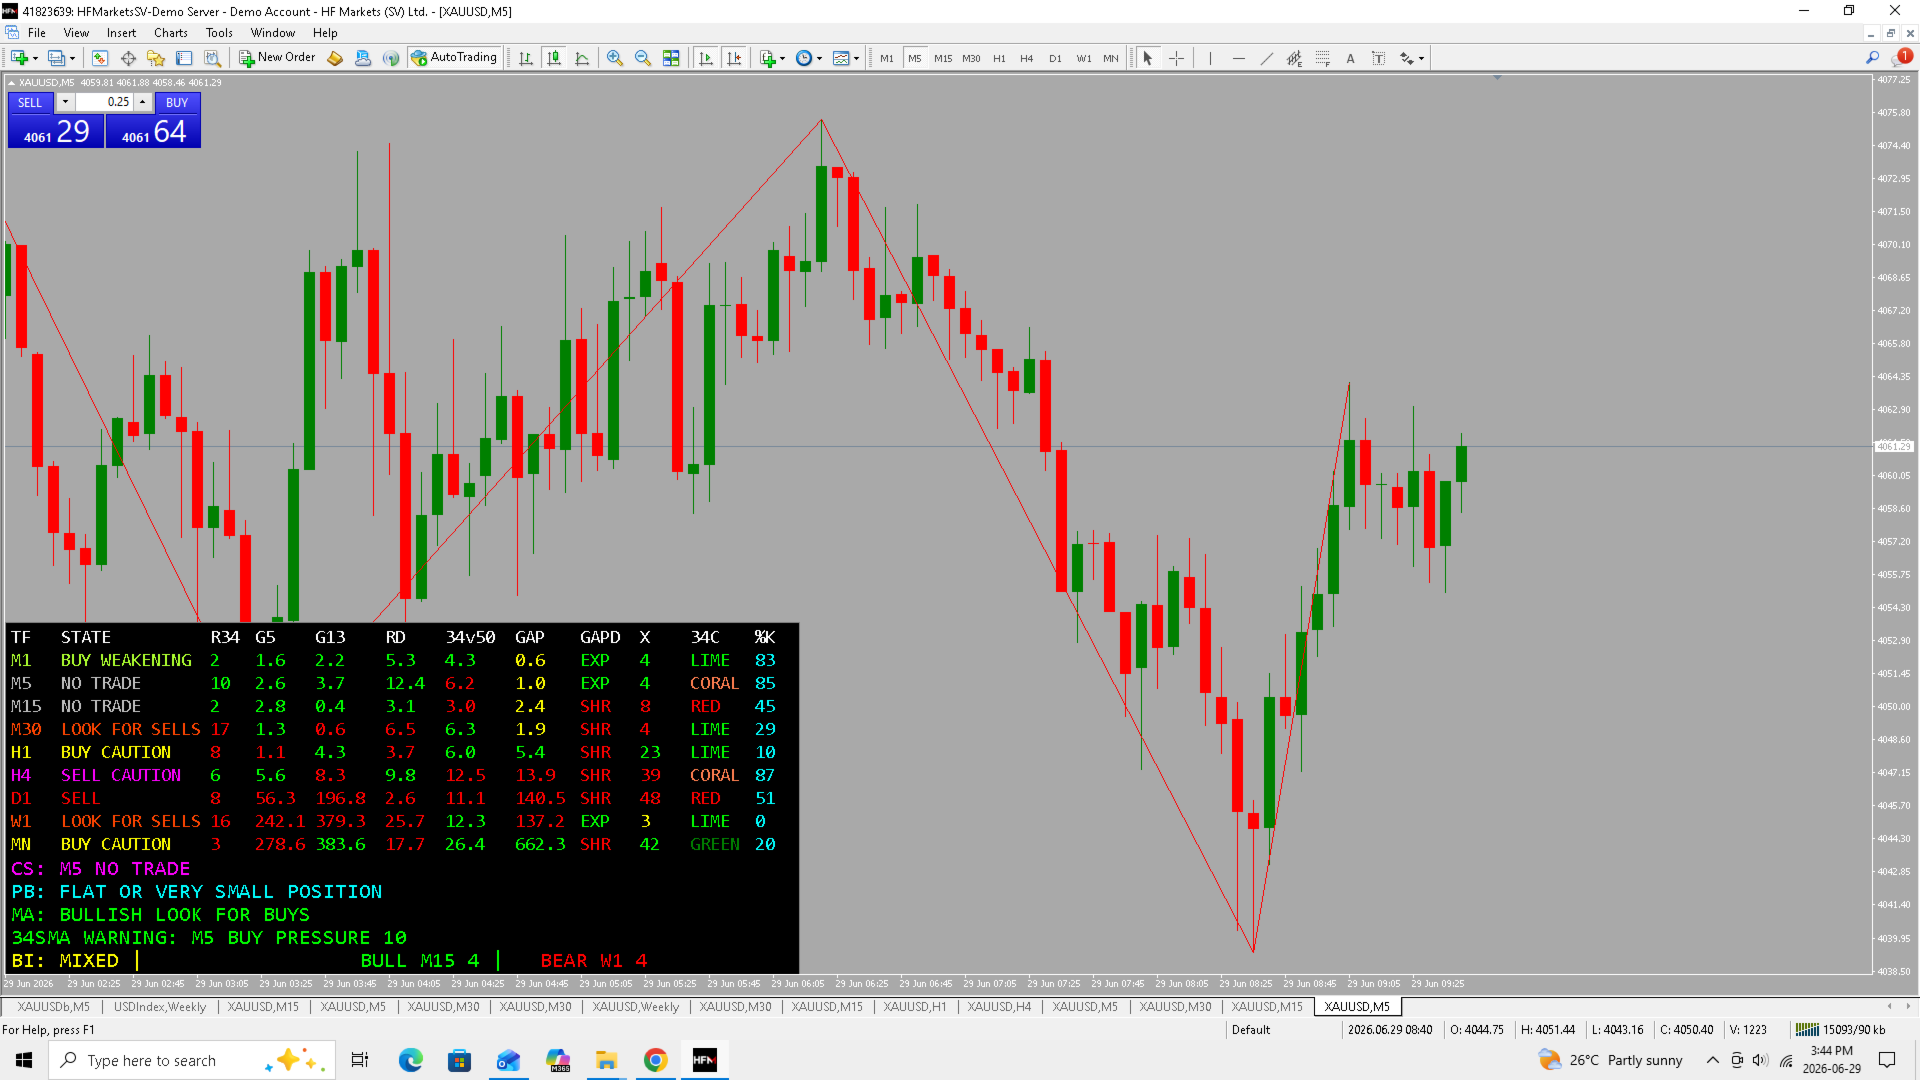
Gold multi timeframe panel
- Indicatori
- Versione: 2.0
- Attivazioni: 5
This dashboard shows you what is happening on all timeframes at the sametime.
State - tells you what state that timeframe is currently in.
R34 - tells you how many candles have closed above or below the 34sma
G5 - tells you how far the price is from the 5sma moving average
G13 - tells you how far the price is from the 13sma moving average
RD - this tells you how far RSI is from the 34sma
34v50 - this tells you how far the 34sma is from 50
Gap - this tells you the current gap between the 5sma and the 13sma
Gapd - this tells you if the gap is shrinking or expanding, or flat
X - this tells you how many candles there are since the last moving average crossover
34c - this tells you the current phase the 34sma is in lime buyers weakening, green buyers strengthening, coral buyers stronger below 50, red sell phase
K percent - this is the stochastic high number means possibly overbought, low number possibly oversold
CS - current timeframe state
PB - recommendation for the current timeframe
MA - current state of the moving averages
34sma - this reads the amount of candles above or below 34sma which is the r34 column
BI - bias
So when you see a high x look at the r34 number sometimes you can have a high bullish run, but r34 will be building with sellers indicating the run is coming to an end
This is a very advance panel, there are many possible strategies you can use, choose one or two columns compare them and watch what happens