Gold Session Trap Distance Map
- Indicatori
- Versione: 1.16
- Attivazioni: 5
Gold Session Trap Distance Map
Gold Session Trap Distance Map is a clean intraday liquidity-mapping indicator designed for XAUUSD traders who want to track where price still has unfinished business from major trading sessions.
Instead of filling the chart with random support and resistance, this indicator focuses on one simple idea:
unbroken session trap zones can act like future liquidity magnets.
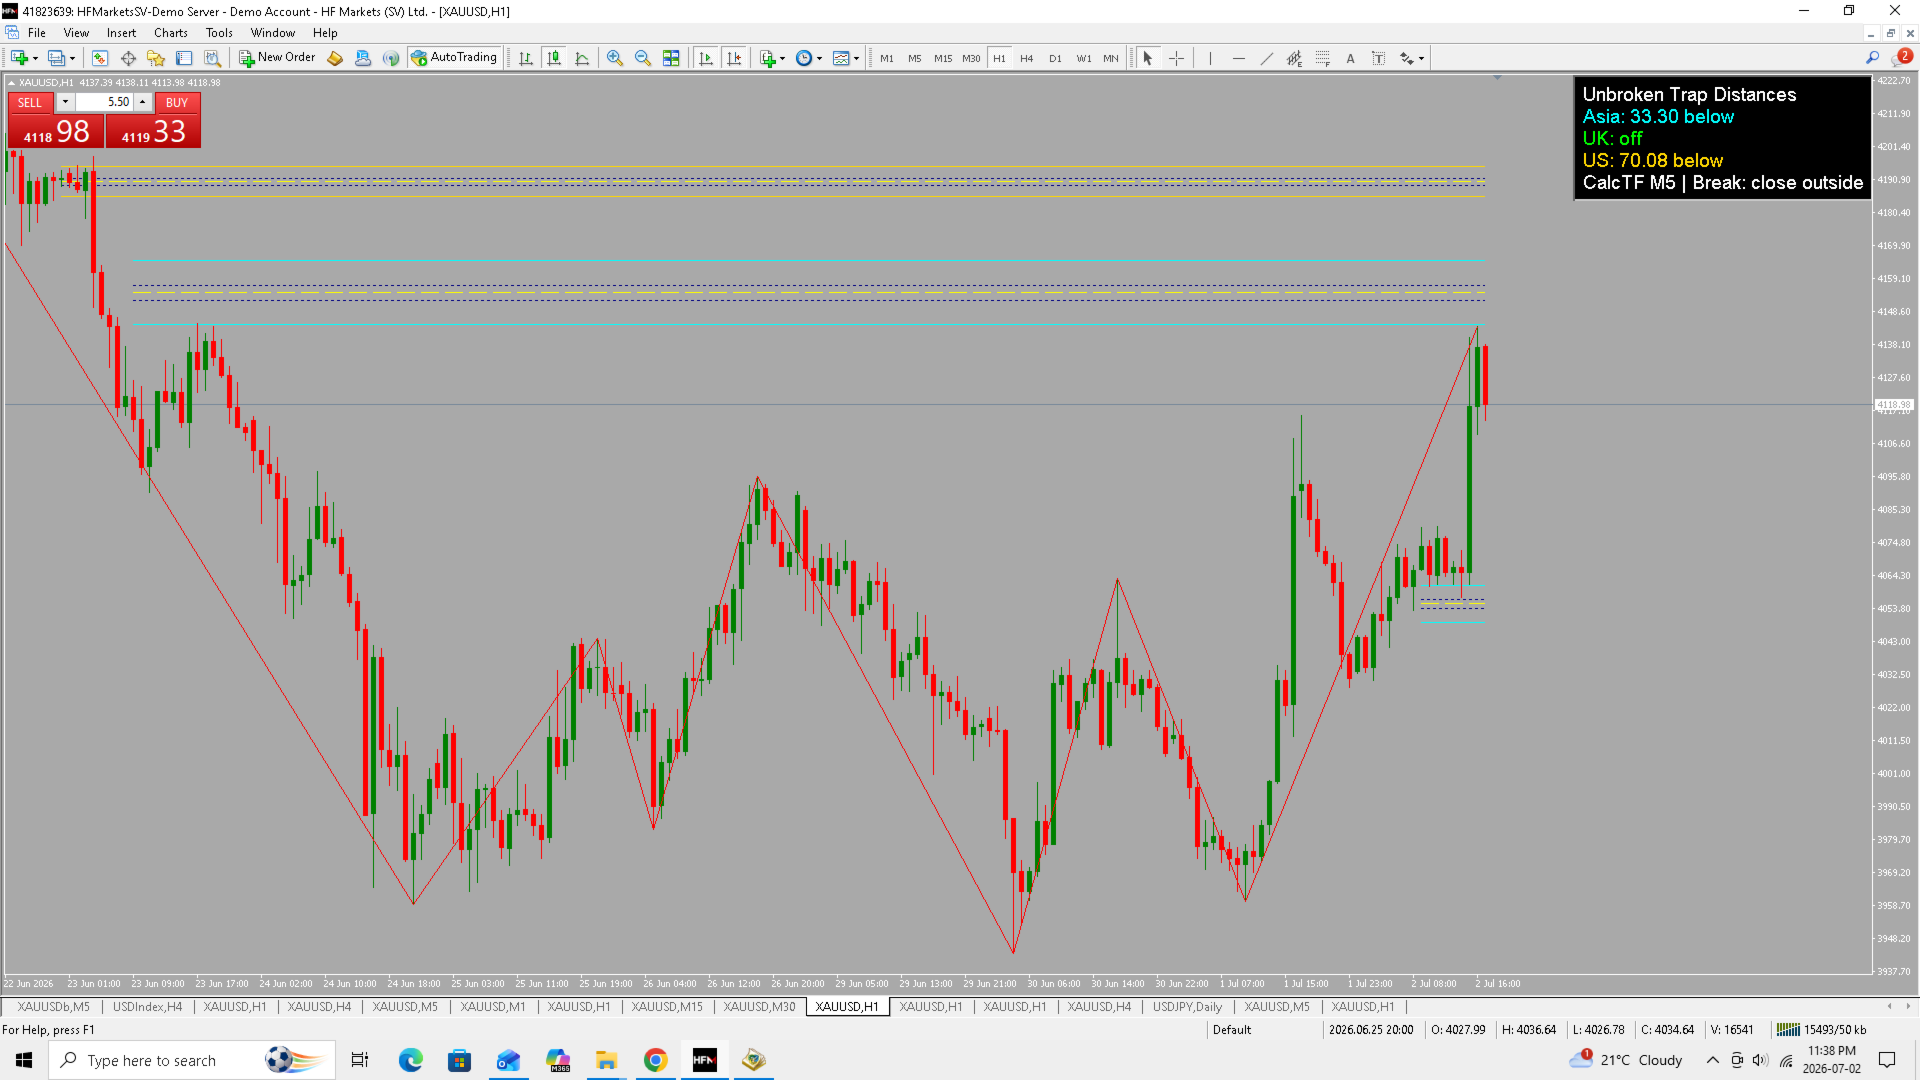
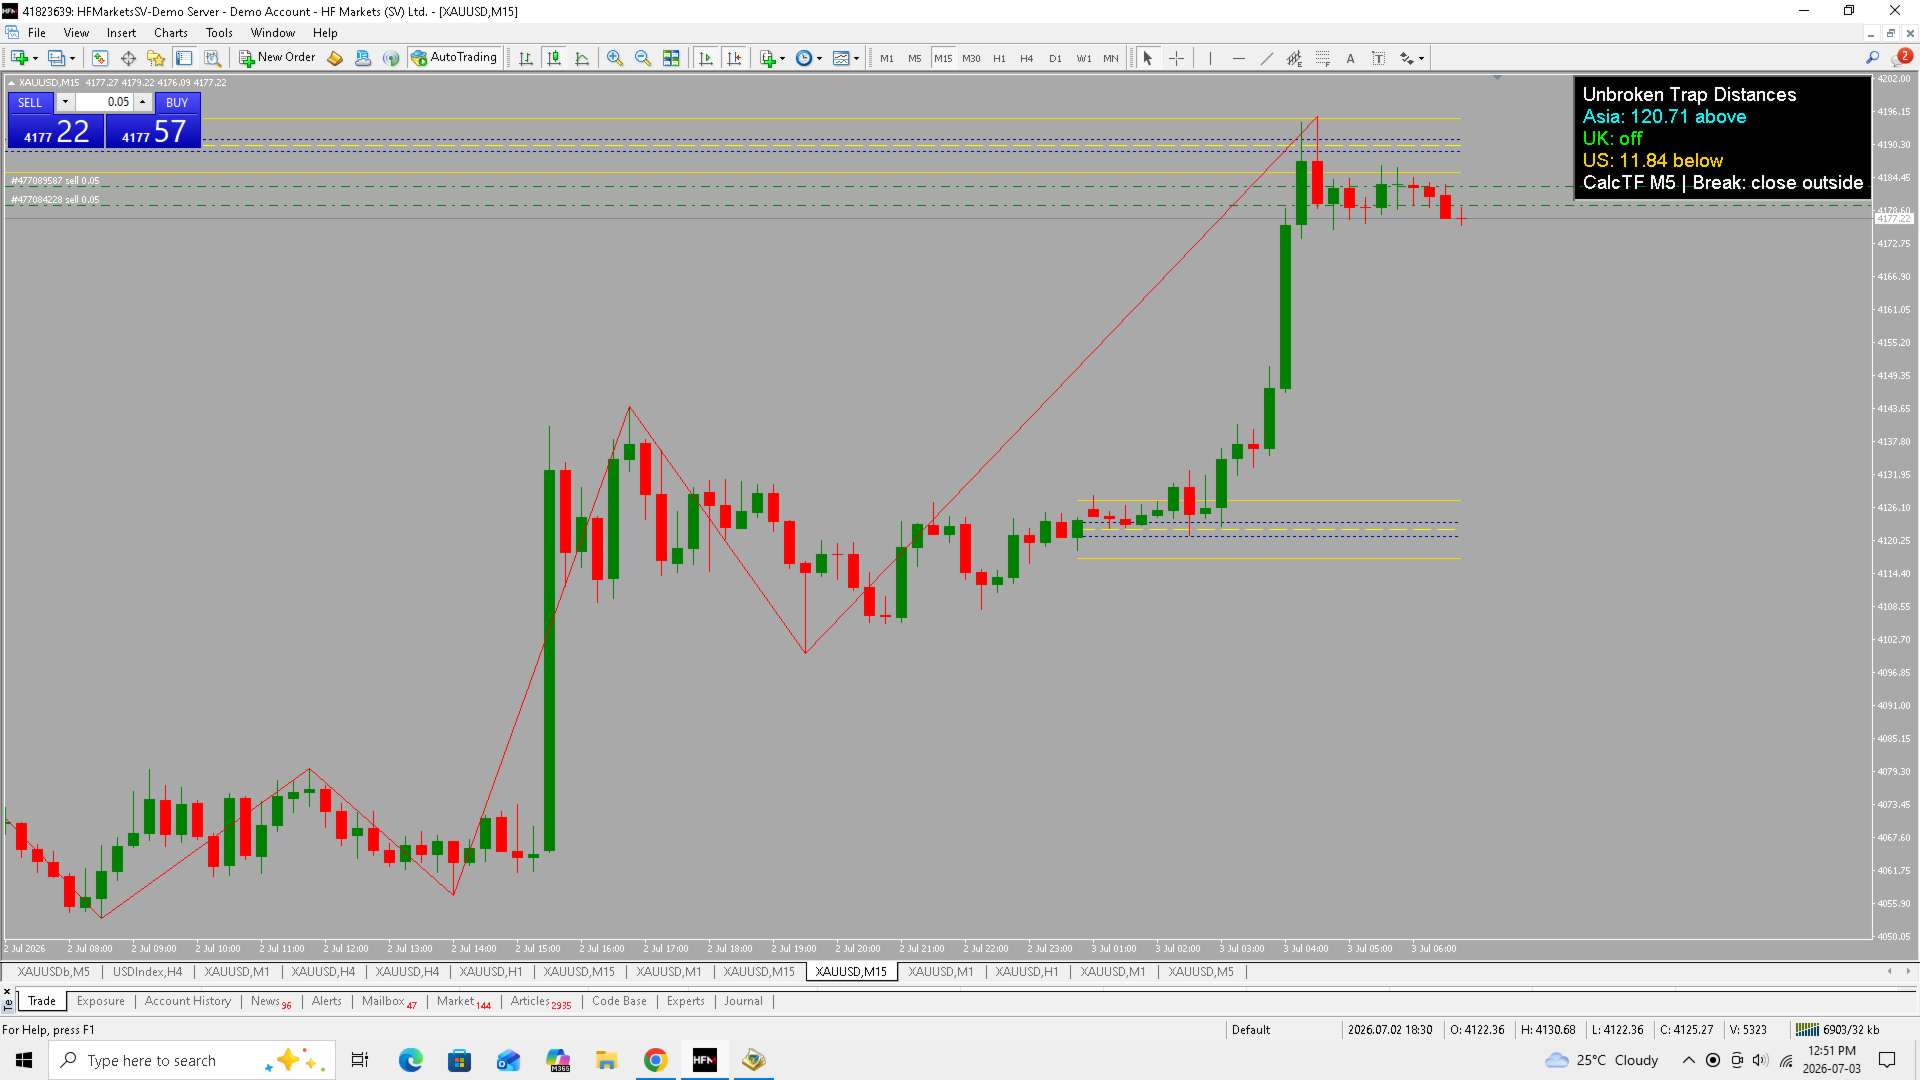
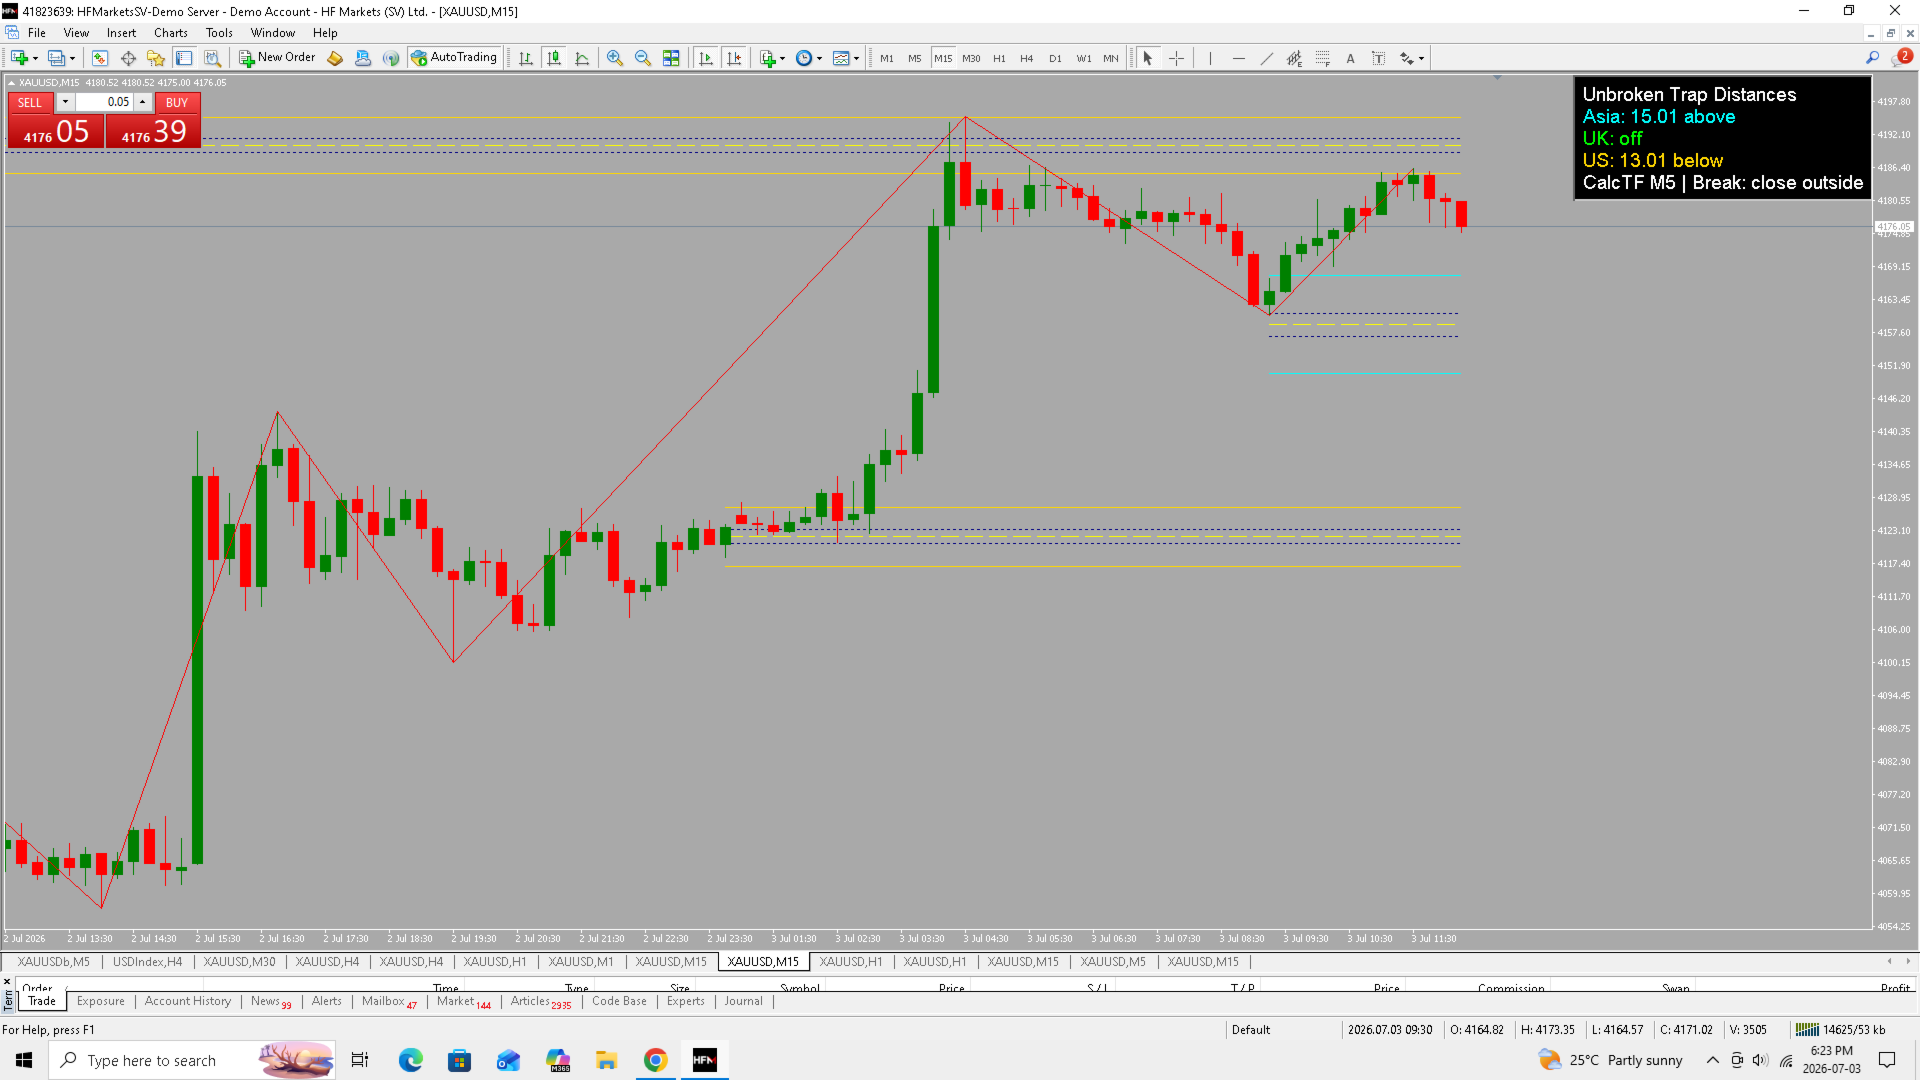
The indicator tracks key session trap areas from the major trading periods and displays live distance readings, so you can instantly see whether price is closest to an untaken Asia, UK, or US trap zone.
This is especially useful for Gold traders who watch session sweeps, liquidity grabs, fake breakouts, and continuation moves after news.
Main Purpose
Gold often moves from one unfinished session area to the next. A trap zone that has not been properly broken can remain important even after price moves away from it.
This indicator helps answer three important questions:
- Where is the next unbroken session trap?
- Is it above or below current price?
- How far away is it right now?
The built-in panel keeps this information visible without forcing you to manually measure every zone.
Key Features
Asia / UK / US Trap Tracking
The indicator tracks unbroken trap zones from major session structures:
- Asia trap zones
- UK trap zones
- US trap zones
Each session can be monitored separately, giving traders a clearer view of where price may react next.
Live Distance Panel
The on-chart panel displays live distance readings such as:
- Asia: distance above or below
- UK: distance above or below
- US: distance above or below
This makes it easy to spot which session trap is currently closest to price.
Clean Visual Session Levels
The indicator draws clear horizontal trap-zone levels on the chart, allowing traders to see important reaction areas without manually marking them.
The levels are designed to help identify:
- potential retest zones
- possible liquidity targets
- trap-zone reactions
- post-news spike destinations
- pullback magnets
Break / Deletion Logic
Trap zones remain active until price properly breaks them.
The break logic is designed to avoid removing zones too early from simple wick taps. Depending on settings, zones can be cleared only after price closes outside the trap area on the selected calculation timeframe.
This helps keep the chart focused on zones that are still structurally relevant.
Designed for Gold / XAUUSD
Gold is highly session-driven. Asia, UK, and US liquidity areas often become important later in the day or even after large news moves.
This indicator was built specifically with Gold trading behavior in mind.
How Traders Can Use It
Gold Session Trap Distance Map can be used to:
- locate nearby unfinished session zones
- avoid buying directly into overhead trap resistance
- avoid selling directly into lower trap support
- prepare for possible reactions at session liquidity areas
- track whether price is moving toward Asia, UK, or US unfinished zones
- monitor post-news spikes into major session targets
It works especially well alongside trend tools, moving averages, volume tools, Fibonacci projections, and session-based trading systems.
Why This Indicator Is Useful
Many traders mark session highs and lows, but they often forget about the trap zones that remain unbroken after price moves away.
This indicator keeps those zones visible and organized.
The live distance panel saves time because you do not have to manually check every level. You can immediately see which session trap is closest and whether it is above or below current price.
Best Used For
- Gold / XAUUSD intraday trading
- Asia session analysis
- London / UK open structure
- US session movement
- liquidity trap mapping
- post-news reaction zones
- session sweep trading
- support and resistance planning
Recommended Timeframes
The indicator can be used on multiple timeframes, but it is especially useful on:
- M5
- M15
- M30
- H1
Lower timeframes help with entries and reactions, while H1 gives a cleaner overview of the larger session map.
Important Note
This indicator does not place trades automatically. It is a visual analysis tool designed to help traders identify important session-based liquidity zones. Always use proper risk management and combine the indicator with your own trading plan.