TCL Auto Pivot Points
- Indicatori
- Versione: 1.4
 Ltd")
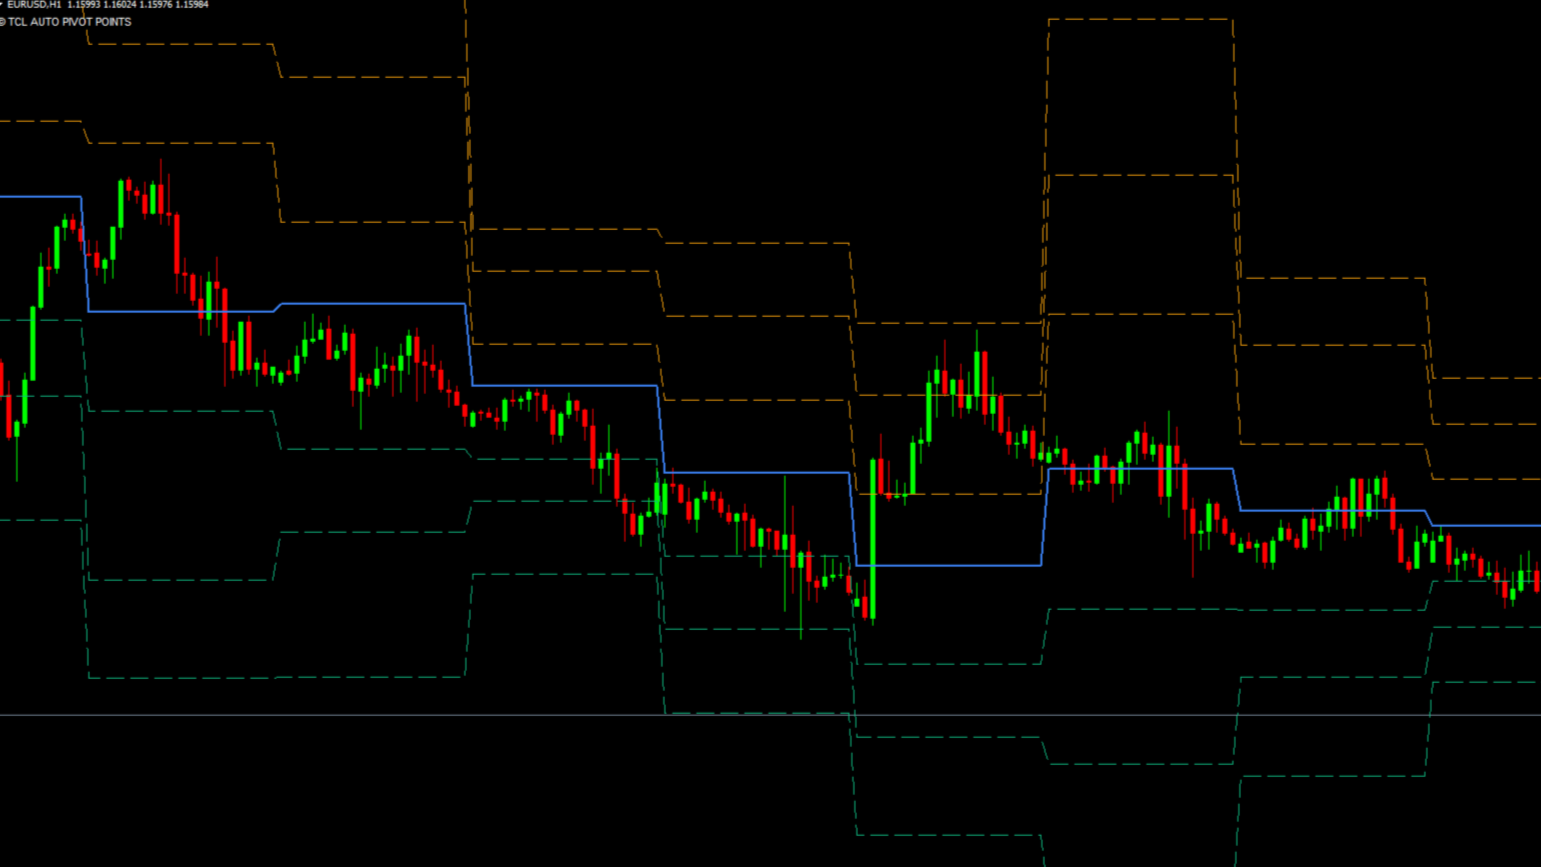
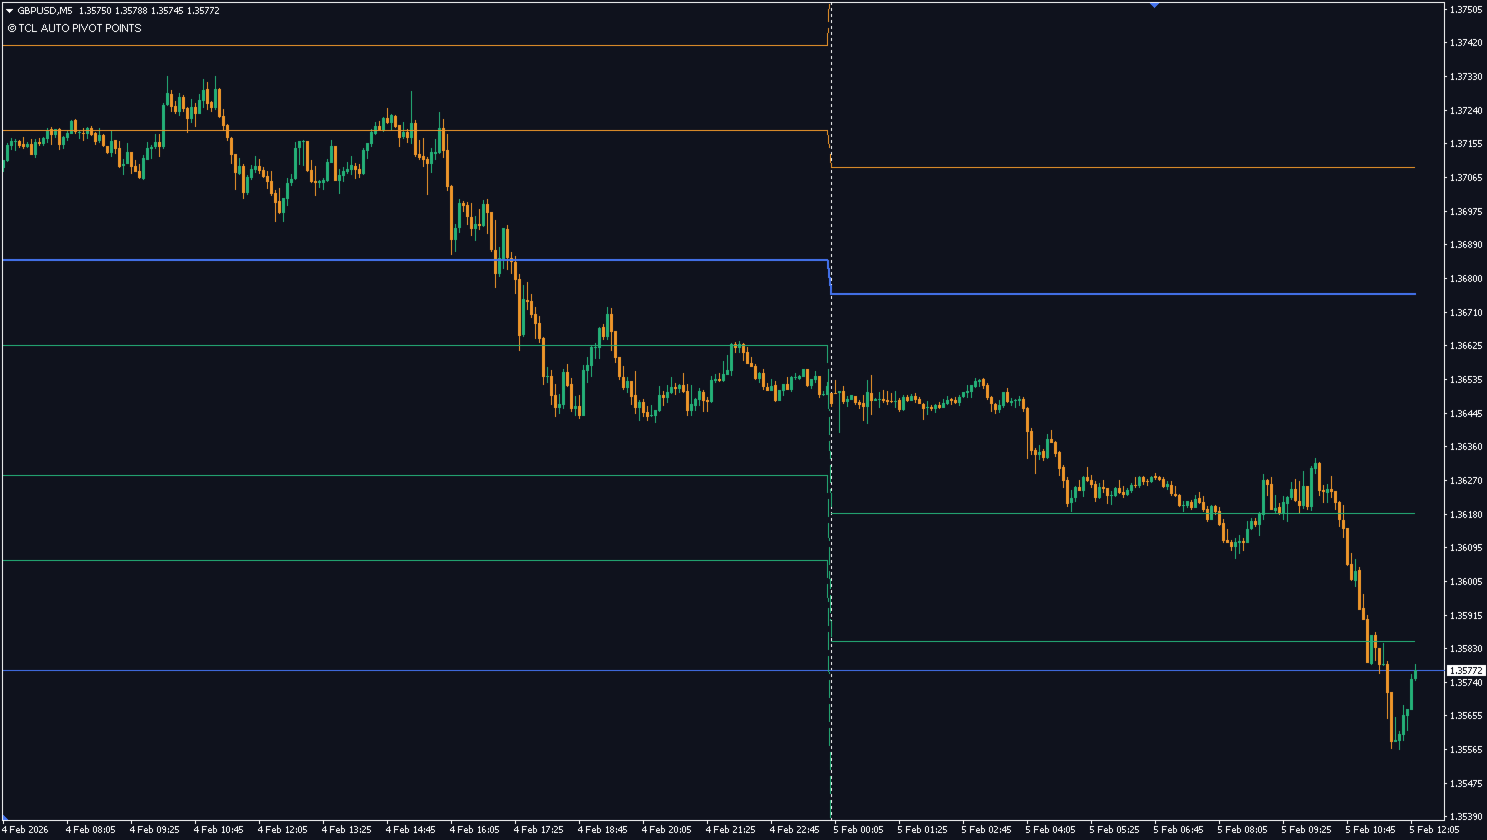
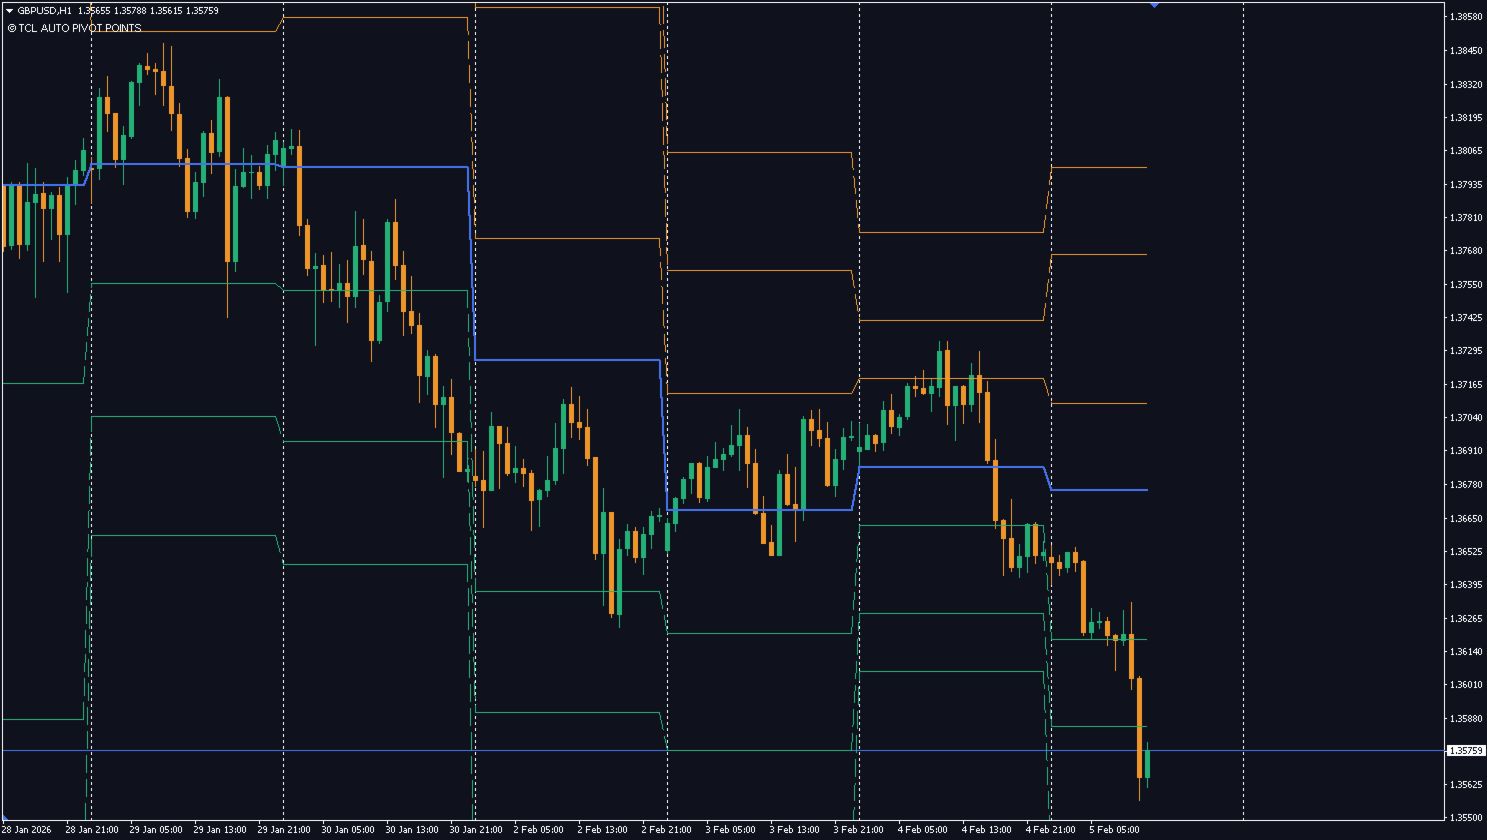
TCL Auto Pivot Points is a daily, weekly, and monthly pivot-point indicator for MetaTrader 4. It calculates classic institutional support and resistance levels (R1 through R3 and S1 through S3) using a choice of four formulas and plots them automatically on the chart.
What It Plots
The indicator draws seven horizontal lines: the central Pivot Point (P), three Resistance levels (R1, R2, R3) above it, and three Support levels (S1, S2, S3) below. The lines update at the start of each pivot period (daily, weekly, or monthly).
Calculation Methods
- Classic — the standard floor-trader formula based on the previous period's high, low, and close.
- Fibonacci — distances between pivot levels follow Fibonacci ratios (0.382, 0.618, 1.000).
- Woodie — gives extra weight to the previous period's close when calculating the pivot.
- Camarilla — narrower levels designed for intraday mean-reversion analysis.
Inputs
- Calculation Method — Classic, Fibonacci, Woodie, or Camarilla (default Classic)
- Timeframe Mode — Daily, Weekly, Monthly, or Auto Detect based on the current chart (default Auto Detect)
- Show R1 to R3 and S1 to S3 — toggle individual level visibility
- Line colors, styles, and widths — fully configurable
- Show labels with price values — toggle text labels at each level
Compatibility
The indicator works on MetaTrader 4. It is compatible with all instruments and all chart timeframes from M1 to MN. Pivot levels themselves are calculated from the chosen pivot period (Daily, Weekly, or Monthly).
Installation
- Download the file from MQL5 Market
- Restart MetaTrader if needed
- Drag the indicator onto any chart
For questions about parameters or behavior, please use the Comments tab.