Resistance and Support Levels

5

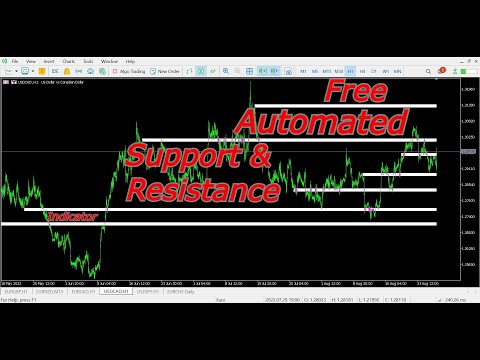
This indicators automatically draws the Support and resistances levels for you once you've dropped it on a chart. 

It reduces the hustle of drawing and redrawing these levels every time you analysis prices on a chart. With it, all you have to do is dropped it on a chart, adjust the settings to your liking and let the indicator do the rest. 

But wait, it gets better; the indicator is absolutely free! 

Get the new and improved version here: https://youtu.be/rTxbPOBu3nY

Parameters

Time-frame -> The indicator should draw the levels using data from which time-frame ? 

Number of levels -> How many resistance and support levels you would like on your chart.

If you've used the indicator and have recommendations for improvements to be made in the next version, inbox me or email me (david100muriithi@gmail). Thanks.  

Recensioni 8
gnanos123
942
gnanos123 2024.10.13 17:55 
 

Good IND

morteza ghasemi
49
morteza ghasemi 2023.04.26 13:06 
 

nice work

mr gecko
28
mr gecko 2022.12.04 01:41 
 

Very good

Prodotti consigliati
Free automatic Fibonacci is an indicator that automatically plots a Fibonacci retracement based on the number of bars you select on the BarsToScan setting in the indicator. The Fibonacci is automatically updated in real time as new highest and lowest values appears amongst the selected bars. You can select which level values to be displayed in the indicator settings. You can also select the color of the levels thus enabling the trader to be able to attach the indicator several times with differe
FREE
This indicator filters the Zigzag indicator to calculate the main support and resistance levels. Variables minimum gap between peaks : is the distance (GAP) between the peaks of the Zigzag peaks sensitivity : Minimum number of nearby peaks look back: it means that it has to test the last 50 peaks in the Zigzag object name perfix: a prefix for level’s line name on chart
FREE
Auto Fibo Retracement MT4
Nguyen Tuan Son
3.75 (4)
Auto Fibonacci Retracement Indicator — Flexible and Reliable This is not just another Auto Fibonacci Retracement indicator — it’s one of the most flexible and dependable tools available . If you find it useful, please leave a review or comment to support the project. Check out my other helpful tools below: Timeframes Trend Scanner    - Scan the trend of assets in difference timeframes with multiple indicators Market Trend Scanner   - Scan the trend of multiple-assets in with multiple indicators
FREE
Fibonacci SR Indicator
Martin Eshleman
5 (1)
Fibonacci SR Indicator This indicator creates support and resistance lines. This indicator is based on Fibonacci Retracement and Extension levels. It will consider many combinations of the Fibonacci levels and draw support/resistance lines based on these. This indicator uses tops and bottoms drawn by the ZigZag indicator in its calculations. The ZigZag can also be drawn on the chart, if necessary. The indicator considers many combinations of past reversal points and Fibonacci ratio levels, and w
FREE
UPD1 Fibo Levels
Vitaliy Kuznetsov
5 (3)
L'indicatore analizza il numero di candele specificato e costruisce i livelli di Fibonacci in base al massimo e al minimo. Poiché i livelli vengono ricostruiti, siamo interessati al lato destro dell'intervallo. Il prezzo è magnetico rispetto ai livelli e reagisce a un tocco. Utilizzate questo strumento per trovare un punto di ingresso nel trend dopo una correzione. Se a sinistra vediamo che i livelli sono perfettamente al rialzo, allora possiamo presumere di aver trovato la fine del movimento ne
FREE
-- Semplice ma efficace. Indicatore di inversione - Che cos'è? Un indicatore di sovrapposizione che segue il trend e combina la logica SuperTrend con la tecnologia della curva esponenziale. Rileva la direzione del trend, traccia un canale dinamico sul grafico e invia avvisi in tempo reale quando il trend si inverte. Come funziona? L'indicatore calcola una linea di base esponenziale utilizzando l'ATR e un fattore SuperTrend. Quando il prezzo chiude al di sopra o al di sotto di questa linea di
FREE
Description: The indicator measures, through the zigzag indicator, the levels of trend or correction. It shows in the chart the levels of each low or high detected. KEY LINKS:   How to Install  –  Frequent Questions  -  All Products  How is this indicator useful? This indicator determines, depending on Zigzag parameter if a trend is beginning, developing, or ending This indicator determines the direction of the trend Components Levels as positive or negative numbers, depending on the direction
FREE
PZ Penta O MT4
PZ TRADING SLU
2.33 (3)
The Penta-O is a 6-point retracement harmonacci pattern which usually precedes big market movements. Penta-O patterns can expand and repaint quite a bit. To make things easier this indicator implements a twist: it waits for a donchian breakout in the right direction before signaling the trade. The end result is an otherwise repainting indicator with a very reliable trading signal. The donchian breakout period is entered as an input. [ Installation Guide | Update Guide | Troubleshooting | FAQ | A
FREE
False Breakout Stochastic to be used with our Elliott Wave Indicator as part of the overall strategy on trading the 5th wave. As we cannot upload multiple files, we have listed this separately. False Breakout Stochastic is best used as a confirmation tool rather than the sole signal indicator The Elliott Wave Indicator Suite is designed around a simple but effective Swing Trading Strategy. The Indicator Suite is great for Stocks, Futures and Forex trading on multiple timeframes You can find the
FREE
Double HMA lines MTF
Pavel Zamoshnikov
5 (1)
This is a multi-timeframe version of the popular Hull Moving Average (HMA). The Double HMA MTF Light indicator combines two timeframes on a single chart. The HMA of the higher timeframe defines the trend, and the HMA of the current timeframe defines short-term price movements. The indicator is freely distributed and hasn't audio signals or messages. Its main function is the visualization of price movements. If you need advanced functionality of the HMA multi-timeframe indicator (information ab
FREE
Market Profile 3
Hussien Abdeltwab Hussien Ryad
3 (2)
Market Profile 3 MetaTrader 4 indicator  — is a classic Market Profile implementation that can show the price density over time, outlining the most important price levels, value area, and control value of a given trading session. This indicator can be attached to timeframes between M1 and D1 and will show the Market Profile for daily, weekly, monthly, or even intraday sessions. Lower timeframes offer higher precision. Higher timeframes are recommended for better visibility. It is also possible t
FREE
MultiFiboDynamicMT4 is a powerful, professional indicator for estimating the most important support and resistance levels. The main advantage is that it plots the Fibonacci levels at all timeframes simultaneously, which allows the trader to see the full picture of the possible price movement of the trading instrument! Advantages of the indicator The indicator is perfect for scalping and trading binary options. Suitable for beginners and experienced traders. Works on all timeframes. Works on any
FREE
Follow The Line
Oliver Gideon Amofa Appiah
3.94 (16)
FOLLOW THE LINE GET THE FULL VERSION HERE: https://www.mql5.com/en/market/product/36024 This indicator obeys the popular maxim that: "THE TREND IS YOUR FRIEND" It paints a GREEN line for BUY and also paints a RED line for SELL.  It gives alarms and alerts of all kinds. IT DOES NOT REPAINT and can be used for all currency pairs and timeframes. Yes, as easy and simple as that. Even a newbie can use it to make great and reliable trades. NB: For best results, get my other premium indicators for more
FREE
Ratio market
Aleksandr Krokhalev
4.33 (15)
Volatility under control. The indicator shows the optimal depth for setting goals within the day and on the average trend. It also builds pivot zones for the estimated correction depth. As an accompaniment, the key levels of the structure are displayed for several timeframes. Classical volatility indicators ATR & ADX on fixed timeframes are used for calculation. The calculation takes into account the spread, and if the market is slightly volatile, you will see a warning about the risk. You can c
FREE
Pivot Point Fibo RSJ è un indicatore che traccia le linee di supporto e resistenza del giorno utilizzando i tassi di Fibonacci. Questo spettacolare indicatore crea fino a 7 livelli di supporto e resistenza tramite Pivot Point utilizzando i tassi di Fibonacci. È fantastico come i prezzi rispettino ogni livello di questo supporto e resistenza, dove è possibile percepire possibili punti di entrata/uscita di un'operazione. Caratteristiche Fino a 7 livelli di supporto e 7 livelli di resistenza Im
FREE
Aroon Classic
Etsushi Ishizuka
Panoramica dell’indicatore Aroon Classic L’indicatore Aroon Classic è uno strumento tecnico che identifica quantitativamente l’insorgere e la persistenza dei trend su un grafico. Utilizza due linee — “Aroon Up” e “Aroon Down” — per mostrare la forza del trend e i punti di inversione nell’intervallo da 0 a 100. Un valore elevato di Aroon Up indica un forte trend rialzista, mentre un valore elevato di Aroon Down indica un forte trend ribassista. Caratteristiche principali Distinzione visiva tra in
FREE
Vanexio
Sayan Vandenhout
VANEXIO USES THE TREND WAVE INDICATOR AND IT CAN IDENTIFY THE BEGINNING AND THE END OF A NEW WAVE TREND MOVEMENT. AS AN OSCILLATOR, THE INDICATOR IDENTIFIES THE OVERBOUGHT AND OVERSOLD ZONES. IT WORKS GREAT TO CATCH THE SHORT TERM PRICE REVERSALS AND USES A MARTINGALE STRATEGY TO CLOSE ALL TRADES IN PROFIT. USE DEFAULT SETTINGS ON H1 OR HIGHER TIME FRAME ON ANY PAIR FOR MORE ACCURATE TRADES WHY THIS EA : Smart entries calculated by 5 great strategies The EA can be run on even a $20000 acco
FREE
The   Pivot Point indicator   automatically calculates and displays the pivot point line and support and resistance levels. Pivot can be calculated according to the Classic, Floor, Fibonacci, Woodie, Camarilla or DeMark formula. It is also possible to select the period for calculating the indicator. A trader can choose from daily, weekly, monthly, or user-defined periods. Types of pivots Classic Floor Fibonacci Woodie Camarilla DeMark Main features The indicator shows the current and historic
FREE
SRP (Strong Retracement/Reversal Points) is a powerful and unique support and resistance indicator. It displays the closest important levels which we expect the price retracement/reversal! If all level are broken from one side, it recalculates and draws new support and resistance levels, so the levels might be valid for several days depending on the market! Key Features You can use it in all time-frames smaller than daily! Displays closest significant support and resistance levels Update the le
FREE
Dragon Structure Filter
Rodion Matveichuk
4 (2)
Представляем "Dragon_Structure_Filter" — это не просто индикатор. Это ваш личный аналитический отдел, встроенный в MetaTrader 4. Он находит мощнейший разворотный паттерн "Дракон" и пропускает его через 7 степеней защиты от убыточных сделок. Наша Технология Фильтрации: Как Мы Отсеиваем 95% "Мусорных" Сигналов Каждый фильтр — это ваш личный страж, который стоит на защите вашего депозита. Вот как они работают: Фильтр 1: Согласование с Глобальным Трендом (Market Structure Filter) Как работает?
FREE
FiboFanSemiauto
Aleksandr Butkov
Advisor-assistant for those who like trading on Fibonacci levels. Automatically finds manually plotted Fibonacci Lines on the chart, and opens an order when the levels are broken. The Expert Advisor has 4 customizable levels and the ability to turn them off as unnecessary. Parameters:   Lot - order volume (lot);   Requote - price slippage;   Magic - individual number for all EA orders, works only with own orders;   Name Fibo - set initial name of Fibonacci lines;       Level parameters are ide
FREE
This indicator is stand alone version from  MP Pivot Levels  (All in one) containing Woodie Pivots. Woodie’s pivot points are made up of multiple key levels, calculated from past price points, in order to frame trades in a simplistic manner. The key levels include the ‘pivot’ itself, and multiple support and resistance levels (usually up to three each). Traders use these levels as a guide for future price movements when setting up trades. The pivot : (Previous high + previous low + 2 x previous
FREE
ENGLISH DESCRIPTION (MQL5 Standard Optimized) Product Name: Aether Elliott Wave Zigzag Pro (MT4) [Subtitle: Wave 3 Hunter | Fib 0.618 Retracement | Margin Guard] Introduction Aether Elliott Wave Zigzag Pro is a lightweight, market-compliant scalping system designed to automate the classic Elliott Wave theory. Instead of complex wave counting, it uses a precision ZigZag algorithm to identify the high-probability 1-2-3 Structure and targets the Wave 3 impulse. Engineered for MT4 stability, it feat
FREE
Trend Line Channel
David Muriithi
3.85 (13)
This indicators automatically draws the Trend Channels for you once you've dropped it on a chart.  It reduces the hustle of drawing and redrawing these levels every time you analysis prices on a chart. With it, all you have to do is dropped it on a chart, adjust the settings to your liking and let the indicator do the rest.  Get an alternative version of this indicator here:   https://youtu.be/lt7Wn_bfjPE For more free stuff visit:  https://abctrading.xyz Parameters 1) Which trend do you want t
FREE
pivot points using by many traders and pivot levels most of the times are very helpfull . this indicator is a custom with internal parameters. it can show two times pivot (weekly and daily). you can choose periods total for each time showing pivots.( 1 week , 2 week ,...1day , 2day ,...) when use weekly and daily pivots , it can show you many support and resistance zones. if have proposal comment too me for upgrading indicator.
FREE
The CandleStick Scanner is a tool that allow you to perform a   market scan   and search any candlestick pattern that you already created in the current chart, You can perform a quick search in the current chart (500 bars will be scanned),  This is a   lite version   of  CandleStick Factory for MT4   . The   full version   video can be found here :  https://www.youtube.com/watch?v=fq7pLXqVO94 The  full version  can be purchased here:  https://www.mql5.com/en/market/product/75628 How it works Yo
FREE
Basic Harmonic Pattern
Mehran Sepah Mansoor
4.58 (59)
Questo indicatore identifica i pattern armonici più popolari che predicono i punti di inversione del mercato. Questi modelli armonici sono formazioni di prezzo che si ripetono costantemente nel mercato forex e suggeriscono possibili movimenti di prezzo futuri / Versione MT5 gratuita Inoltre, questo indicatore è dotato di un segnale di entrata nel mercato e di vari take profit e stop loss. Va notato che, sebbene l'indicatore di pattern armonico possa fornire segnali di acquisto/vendita da solo,
FREE
This indicators automatically draws the   support and resistances   levels (key levels) for you once you've dropped it on a chart. It reduces the hustle of drawing and redrawing these levels every time you analyse prices on a chart. With it, all you have to do is drop it on a chart, adjust the settings to your liking and let the indicator do the rest. But wait, it gets better; the indicator is absolutely free! For more information:  https://youtu.be/rTxbPOBu3nY For more free stuff visit:  https:
FREE
Necessary for traders: tools and indicators Waves automatically calculate indicators, channel trend trading Perfect trend-wave automatic calculation channel calculation , MT4 Perfect trend-wave automatic calculation channel calculation , MT5 Local Trading copying Easy And Fast Copy , MT4 Easy And Fast Copy , MT5 Local Trading copying For DEMO Easy And Fast Copy , MT4 DEMO Easy And Fast Copy , MT5 DEMO The homeopathic indicator is also called the CCI indicator. The CCI indicator was proposed
FREE
CandlePips
Yawo Julio K Kavege Atileh
This indicator works on this way: Trader should provided the n period "Number of Candle" ( the default period is 6) Then the indicator  will calculate the number of pips in the last n period  (not the current candle) And that is display on the chart With that the should confirmed his up trend or down trend analyse according to the number of pips in the last  n candles( bullish or bearish) he has provided
FREE
Gli utenti di questo prodotto hanno anche acquistato
Gann Made Easy
Oleg Rodin
4.83 (155)
Gann Made Easy è un sistema di trading Forex professionale e facile da usare che si basa sui migliori principi del trading utilizzando la teoria di mr. WD Gann. L'indicatore fornisce segnali ACQUISTA e VENDI accurati, inclusi i livelli di Stop Loss e Take Profit. Puoi fare trading anche in movimento utilizzando le notifiche PUSH. CONTATTATEMI DOPO L'ACQUISTO PER RICEVERE CONSIGLI DI TRADING, BONUS E L'ASSISTENTE EA GANN MADE EASY GRATUITAMENTE! Probabilmente hai già sentito parlare molte volte d
Game Changer Indicator
Vasiliy Strukov
4.76 (17)
Game Changer è un indicatore di tendenza rivoluzionario, progettato per essere utilizzato su qualsiasi strumento finanziario, per trasformare il tuo MetaTrader in un potente analizzatore di trend. Funziona su qualsiasi intervallo temporale e aiuta a identificare i trend, segnala potenziali inversioni, funge da meccanismo di trailing stop e fornisce avvisi in tempo reale per risposte tempestive del mercato. Che tu sia un professionista esperto o un principiante in cerca di un vantaggio, questo st
GOLD Impulse with Alert
Bernhard Schweigert
4.64 (11)
Questo indicatore è una super combinazione dei nostri 2 prodotti Advanced Currency IMPULSE with ALERT  +   Currency Strength Exotics . Funziona per tutti i time frame e mostra graficamente l'impulso di forza o debolezza per le 8 valute principali più un simbolo! Questo indicatore è specializzato nel mostrare l'accelerazione della forza delle valute per qualsiasi simbolo come oro, coppie esotiche, materie prime, indici o futures. Primo nel suo genere, qualsiasi simbolo può essere aggiunto all
Scalper Inside PRO
Alexey Minkov
4.74 (69)
An exclusive indicator that utilizes an innovative algorithm to swiftly and accurately determine the market trend. The indicator automatically calculates opening, closing, and profit levels, providing detailed trading statistics. With these features, you can choose the most appropriate trading instrument for the current market conditions. Additionally, you can easily integrate your own arrow indicators into Scalper Inside Pro to quickly evaluate their statistics and profitability. Scalper Inside
Trend Lines PRO
Roman Podpora
5 (1)
LINEE DI TENDENZA PRO       Aiuta a capire dove il mercato sta realmente cambiando direzione. L'indicatore mostra reali inversioni di tendenza e punti in cui i principali attori rientrano. Vedi  Linee BOS   Cambiamenti di tendenza e livelli chiave su timeframe più ampi, senza impostazioni complesse o rumore inutile. I segnali non vengono ridisegnati e rimangono sul grafico dopo la chiusura della barra. VERSIONE MT 5     -      Svela il suo massimo potenziale se abbinato all'indicatore   RFI LEVE
Indicatore Miraculous – Strumento Forex e Binario 100% Non-Repaint Basato sul Quadrato di Nove di Gann Questo video presenta l' Indicatore Miraculous , uno strumento di trading altamente accurato e potente, sviluppato specificamente per i trader di Forex e Opzioni Binarie . Ciò che rende unico questo indicatore è la sua base sul leggendario Quadrato di Nove di Gann e sulla Legge della Vibrazione di Gann , rendendolo uno degli strumenti di previsione più precisi disponibili nel trading moderno. L
Dynamic Forex28 Navigator
Bernhard Schweigert
4.43 (7)
Dynamic Forex28 Navigator - Lo strumento di trading Forex di nuova generazione. ATTUALMENTE SCONTATO DEL 49%. Dynamic Forex28 Navigator è l'evoluzione dei nostri indicatori popolari di lunga data, che combinano la potenza di tre in uno: Advanced Currency Strength28 Indicator (695 recensioni) + Advanced Currency IMPULSE con ALERT (520 recensioni) + CS28 Combo Signals (Bonus). Dettagli sull'indicatore https://www.mql5.com/en/blogs/post/758844 Cosa offre l'indicatore di forza di nuova generazione?
RFI levels PRO
Roman Podpora
5 (1)
L'indicatore mostra accuratamente i punti di inversione e le zone di ritorno dei prezzi in cui il       Principali attori   . Vedi dove si formano le nuove tendenze e prendi decisioni con la massima precisione, mantenendo il controllo su ogni operazione. VERSION MT5     -     Rivela il suo massimo potenziale se combinato con l'indicatore   TREND LINES PRO Cosa mostra l'indicatore: Strutture di inversione e livelli di inversione con attivazione all'inizio di un nuovo trend. Visualizzazione dei l
M1 Sniper
Oleg Rodin
5 (19)
M1 SNIPER è un sistema di indicatori di trading facile da usare. Si tratta di un indicatore a freccia progettato per l'intervallo temporale M1. L'indicatore può essere utilizzato come sistema autonomo per lo scalping sull'intervallo temporale M1 e come parte del tuo sistema di trading esistente. Sebbene questo sistema di trading sia stato progettato specificamente per il trading sull'intervallo temporale M1, può comunque essere utilizzato anche con altri intervalli temporali. Inizialmente ho pro
Currency Strength Wizard è un indicatore molto potente che ti fornisce una soluzione all-in-one per un trading di successo. L'indicatore calcola la potenza di questa o quella coppia forex utilizzando i dati di tutte le valute su più intervalli di tempo. Questi dati sono rappresentati in una forma di indice di valuta facile da usare e linee elettriche di valuta che puoi utilizzare per vedere il potere di questa o quella valuta. Tutto ciò di cui hai bisogno è collegare l'indicatore al grafico che
Currency Strength Exotics
Bernhard Schweigert
4.88 (33)
ATTUALMENTE SCONTATO DEL 20%! La soluzione migliore per qualsiasi principiante o trader esperto! Questo indicatore è specializzato nel mostrare la forza della valuta per qualsiasi simbolo come coppie esotiche, materie prime, indici o futures. È il primo nel suo genere, qualsiasi simbolo può essere aggiunto alla nona riga per mostrare la vera forza della valuta di Oro, Argento, Petrolio, DAX, US30, MXN, TRY, CNH ecc. Si tratta di uno strumento di trading unico, di alta qualità e conveniente pe
Precautions for subscribing to indicator This indicator only supports the computer version of MT4 Does not support MT5, mobile phones, tablets The indicator only shows the day's entry arrow The previous history arrow will not be displayed (Live broadcast is for demonstration) The indicator is a trading aid Is not a EA automatic trading No copy trading function The indicator only indicates the entry position No exit (target profit)  The entry stop loss point is set at 30-50 PIPS Or the front hi
PRO Renko System
Oleg Rodin
5 (30)
PRO Renko System è un sistema di trading altamente accurato appositamente progettato per il trading di grafici RENKO. Questo è un sistema universale che può essere applicato a vari strumenti di trading. Il sistema neutralizza efficacemente il cosiddetto rumore di mercato che consente di accedere a segnali di inversione accurati. L'indicatore è molto facile da usare e ha un solo parametro responsabile della generazione del segnale. Puoi facilmente adattare lo strumento a qualsiasi strumento di
Are you looking for a simple and reliable indicator that can help you spot market swing points easily? Do you want clear buy and sell signals that work on any timeframe and any trading instrument? Buy Sell Signal Pro is designed to do exactly that. It helps traders identify important market turning points and understand the current market structure in a clear and easy way. This indicator detects Higher Highs (HH), Higher Lows (HL), Lower Highs (LH), and Lower Lows (LL) so you can quickly see wh
Attualmente 40% di sconto! La soluzione migliore per ogni principiante o trader esperto! Questo software per cruscotti funziona su 28 coppie di valute. Si basa su 2 dei nostri indicatori principali (Advanced Currency Strength 28 e Advanced Currency Impulse). Offre un'ottima panoramica dell'intero mercato Forex. Mostra i valori di forza delle valute avanzate, la velocità di movimento delle valute e i segnali per 28 coppie Forex in tutti i (9) timeframe. Immaginate come migliorerà il vostro tra
ATTUALMENTE SCONTATO DEL 40% La soluzione migliore per ogni principiante o trader esperto! Questo indicatore è uno strumento di trading unico, di alta qualità e conveniente perché abbiamo incorporato una serie di caratteristiche proprietarie e una nuova formula. Con un solo grafico è possibile leggere la forza delle valute per 28 coppie Forex! Immaginate come migliorerà il vostro trading perché sarete in grado di individuare l'esatto punto di innesco di una nuova tendenza o di un'opportunità
FX Power MT4 NG
Daniel Stein
4.95 (21)
FX Power: Analizza la Forza delle Valute per Decisioni di Trading Più Intelligenti Panoramica FX Power è lo strumento essenziale per comprendere la reale forza delle principali valute e dell'oro in qualsiasi condizione di mercato. Identificando le valute forti da comprare e quelle deboli da vendere, FX Power semplifica le decisioni di trading e rivela opportunità ad alta probabilità. Che tu segua le tendenze o anticipi inversioni utilizzando valori estremi di Delta, questo strumento si adatta
Advanced Supply Demand
Bernhard Schweigert
4.91 (298)
Speciale Trading- SCONTO DEL 40% La soluzione migliore per qualsiasi trader principiante o esperto! Questo indicatore è uno strumento di trading unico, di alta qualità e conveniente, perché abbiamo incorporato una serie di funzionalità proprietarie e una nuova formula. Con questo aggiornamento, potrai visualizzare doppie zone di timeframe. Non solo potrai visualizzare un TF più alto, ma anche entrambi, il TF del grafico e il TF più alto: MOSTRA ZONE ANNIDATE. Tutti i trader che operano con Of
ATTUALMENTE SCONTATO DEL 40%! La soluzione migliore per ogni principiante o trader esperto! Questo indicatore è uno strumento di trading unico, di alta qualità e conveniente perché abbiamo incorporato una serie di caratteristiche proprietarie e una formula segreta. Con un solo grafico fornisce avvisi per tutte le 28 coppie di valute. Immaginate come migliorerà il vostro trading perché sarete in grado di individuare l'esatto punto di innesco di una nuova tendenza o opportunità di scalping! Co
Trend indicator AI
Ramil Minniakhmetov
4.57 (82)
Trend Ai indicator è un ottimo strumento che migliorerà l'analisi di mercato di un trader combinando l'identificazione della tendenza con punti di ingresso utilizzabili e avvisi di inversione. Questo indicatore consente agli utenti di navigare nelle complessità del mercato forex con fiducia e precisione Oltre ai segnali primari, l'indicatore Ai di tendenza identifica i punti di ingresso secondari che si presentano durante i pullback o i ritracciamenti, consentendo ai trader di capitalizzare le
FX Volume
Daniel Stein
4.63 (38)
FX Volume: Scopri il Vero Sentimento di Mercato dalla Prospettiva di un Broker Panoramica Rapida Vuoi portare la tua strategia di trading a un livello superiore? FX Volume ti offre informazioni in tempo reale su come i trader retail e i broker sono posizionati—molto prima che compaiano report in ritardo come il COT. Che tu miri a guadagni costanti o desideri semplicemente un vantaggio più solido sui mercati, FX Volume ti aiuta a individuare grandi squilibri, confermare i breakout e perfezionar
Apollo Secret Trend è un indicatore di tendenza professionale che può essere utilizzato per trovare le tendenze su qualsiasi coppia e intervallo di tempo. L'indicatore può facilmente diventare il tuo indicatore di trading principale che puoi utilizzare per rilevare le tendenze del mercato, indipendentemente dalla coppia o dal periodo di tempo che preferisci negoziare. Utilizzando un parametro speciale nell'indicatore puoi adattare i segnali al tuo stile di trading personale. L'indicatore fornisc
Meravith
Ivan Stefanov
5 (3)
Strumento per market maker. Meravith: Analizzerà tutti i timeframe e mostrerà il trend attualmente in corso. Evidenzierà le zone di liquidità (equilibrio dei volumi) dove i volumi rialzisti e ribassisti sono uguali. Mostrerà tutti i livelli di liquidità dei diversi timeframe direttamente sul grafico. Genererà e presenterà un’analisi di mercato testuale a scopo di riferimento. Calcolerà obiettivi, livelli di supporto e punti di stop-loss in base al trend attuale. Calcolerà il rapporto rischio/ren
Apollo SR Master è un indicatore di Supporto/Resistenza con caratteristiche speciali che rendono il trading con le zone di Supporto/Resistenza più semplice e affidabile. L'indicatore calcola le zone di Supporto/Resistenza in tempo reale senza alcun ritardo, rilevando i massimi e i minimi dei prezzi locali. Quindi, per confermare la nuova area SR formata, l'indicatore mostra un segnale speciale che segnala che la zona SR può essere presa in considerazione e utilizzata come un vero e proprio segna
Presenting one-of-a-kind Gann Indicator for XAUUSD IQ Gold Gann Levels is a non-repainting, precision tool designed exclusively for XAUUSD/Gold intraday trading. It uses W.D. Gann’s square root method to plot real-time support and resistance levels, helping traders spot high-probability entries with confidence and clarity. William Delbert Gann (W.D. Gann) was an exceptional market analyst whose trading technique was based on a complex blend of mathematics, geometry, astrology, and ancient calcul
KT Trend Trading Suite MT4
KEENBASE SOFTWARE SOLUTIONS
KT Trend Trading Suite è un indicatore multifunzione che combina una strategia di trend following con diversi punti di breakout come segnali di ingresso. Una volta che una nuova tendenza è stata identificata, l’indicatore offre numerose opportunità di ingresso per seguire con successo il trend. Una soglia di pullback viene utilizzata per evitare segnali di ingresso poco rilevanti. La versione MT5 è disponibile qui  https://www.mql5.com/en/market/product/46270 Caratteristiche Combina diverse
El indicador "MR BEAST ALERTAS DE LIQUIDEZ" es una herramienta avanzada diseñada para proporcionar señales y alertas sobre la liquidez del mercado basándose en una serie de indicadores técnicos y análisis de tendencias. Ideal para traders que buscan oportunidades de trading en función de la dinámica de precios y los niveles de volatilidad, este indicador ofrece una visualización clara y detallada en la ventana del gráfico de MetaTrader. Características Principales: Canal ATR Adaptativo: Calcula
Volatility Trend System - un sistema di trading che fornisce segnali per le voci. Il sistema di volatilità fornisce segnali lineari e puntuali nella direzione del trend, nonché segnali per uscirne, senza ridisegnare e ritardi. L'indicatore di tendenza monitora la direzione della tendenza a medio termine, mostra la direzione e il suo cambiamento. L'indicatore di segnale si basa sui cambiamenti della volatilità e mostra gli ingressi nel mercato. L'indicatore è dotato di diversi tipi di avvisi. Pu
GM Arrows Pro
Guillaume Pierre Philippe Mesplont
Product Name: GM Arrows Pro – Signals & Alerts Short Description: GM Arrows Pro is a clean, reliable MT4 indicator showing BUY/SELL arrows on the chart with unique alerts at the moment the signal appears. Full Description: GM Arrows Pro is a professional MT4 indicator designed for traders who want clear, actionable signals: BUY and SELL arrows visible on the entire chart history Unique alerts when a new signal appears (no repeated alerts) Option to disable repetitive signals ( disable_repeatin
PZ Divergence Trading
PZ TRADING SLU
5 (2)
Unlock hidden profits: accurate divergence trading for all markets Tricky to find and scarce in frequency, divergences are one of the most reliable trading scenarios. This indicator finds and scans for regular and hidden divergences automatically using your favourite oscillator. [ Installation Guide | Update Guide | Troubleshooting | FAQ | All Products ] Easy to trade Finds regular and hidden divergences Supports many well known oscillators Implements trading signals based on breakouts Display
Altri dall’autore
An ICT fair value gap is a trading concept that identifies market imbalances based on a three-candle sequence. The middle candle has a large body while the adjacent candles have upper and lower wicks that do not overlap with the middle candle. This formation suggests that there is an imbalance where buying and selling powers are not equal. Settings Minimum size of FVG (pips) -> FVGs less than the indicated pips will be not be drawn Show touched FVGs Normal FVG color -> color of FVG that hasn't
FREE
Trend Line Channel
David Muriithi
3.85 (13)
This indicators automatically draws the Trend Channels for you once you've dropped it on a chart.  It reduces the hustle of drawing and redrawing these levels every time you analysis prices on a chart. With it, all you have to do is dropped it on a chart, adjust the settings to your liking and let the indicator do the rest.  Get an alternative version of this indicator here:   https://youtu.be/lt7Wn_bfjPE For more free stuff visit:  https://abctrading.xyz Parameters 1) Which trend do you want t
FREE
ATR Trailing Stoploss
David Muriithi
5 (1)
For Meta Trader 4. We have all experienced a situation where the market wipes out our stoploss before it turning in the direction we had anticipated.  This is experience becomes more frequent when we use a trailing stoploss. If only there was a way to place and trail the stoploss just the perfect amount of pips away. Well, there is...   The Average True Range (ATR) is a one of the most popular technical analysis indicator, introduced by J.Welles Wilder, that measures Market Volatility for a give
Are you tired of drawing trendlines every time you're analyzing charts? Or perhaps you would like more consistency in your technical analysis. Then this is for you. This indicator will draw trend lines automatically when dropped on a chart. How it works Works similar to standard deviation channel found on mt4 and mt5. It has 2 parameters: 1. Starting Bar 2. Number of bars for calculation The   starting bar   is the bar which drawing of the trend lines will begin, while the   number of bars for c
FREE
Auto Breakeven
David Muriithi
Introducing a powerful MetaTrader 5 Expert Advisor designed to enhance your trading strategy – the Auto Breakeven EA! This feature-rich EA is tailored to bring your stop-loss to breakeven, ensuring a risk-free trade once the market moves in your favor up to a specified price. Explore the full potential of the Auto Breakeven EA. Download it for free now, and find the download link at the bottom of our page. Elevate your trading experience and take control of your risk management strategy. Happy
FREE
This indicators automatically draws the   support and resistances   levels (key levels) for you once you've dropped it on a chart. It reduces the hustle of drawing and redrawing these levels every time you analyse prices on a chart. With it, all you have to do is drop it on a chart, adjust the settings to your liking and let the indicator do the rest. But wait, it gets better; the indicator is absolutely free! For more information:  https://youtu.be/rTxbPOBu3nY For more free stuff visit:  https:
FREE
The   currency strength momentum   has a lot of similarities with   currency strength meter   presented in the previous page, but the difference are much more pronounced. You can try putting both in the same chart and see the difference in results.   Currency strength momentum   measures strength of a currency based on (you guess it) it's momentum relative to other currencies, while   currency strength meter   measures the strength of a currency based on pips it has moved in a certain direction.
FREE
Having trouble marking where the various forex sessions start and end? Or perhaps your strategy requires you trade only in a specific session, then this is for you. The session indicator shades the session you require in a certain color so that you can identify it easily. The sessions shown include: London session, New York session, Asian Session, Asian - London overlap and London - New York Overlap. Difference source give varying time ranges for the various session, mostly differing by not m
FREE
This indicator uses a different approach from the previous version to get it's trendlines. This method is derived from Orchard Forex, and the process of making the indicator is demonstrated in there video   https://www.youtube.com/watch?v=mEaiurw56wY&t=1425s . The basic idea behind this indicator is it draws a   tangent line   on the highest levels and lowest levels of the bars used for calculation, while ensuring that the lines don't intersect with the bars in review (alittle confusing? I know
FREE
Trendline indicator
David Muriithi
2 (1)
Are you tired of drawing trendlines every time you're analyzing charts? Or perhaps you would like more consistency in your technical analysis. Then this is for you. This indicator will draw trend lines automatically when dropped on a chart. How it works Works similar to standard deviation channel found on mt4 and mt5. It has 2 parameters: 1. Starting Bar 2. Number of bars for calculation The   starting bar   is the bar which drawing of the trend lines will begin, while the   number of bars for c
FREE
Have you ever wondered which currency is the strongest at any particular time? Or which currency pair is trending the most. Well, the currency strength meter helps with just that.  It compares  USD ,  EUR ,  AUD ,  CHF ,  GBP ,  CAD  and  NZD  depending on the timeline you have chosen in settings, and ranks them on the number of pips each has moved compared to the rest. N/B: All currency charts of the above pairs must have loaded. You can do this by highlighting all major and minor currencies in
FREE
Calculating the number of lots needed so as to make sure you are risking a specific percent of account balance can be tedious. Luckily, there are websites that make this task a lot easier. This indicator takes things to the next level as it ensures you don’t have to leave the metatrader platform to perform these calculations. The lot-size calculator is a simple calculator that works in all forex currency pairs, BTCUSD, US500, HK50 and XTIUSD. For more free stuff:  http://abctrading.xyz
FREE
Partial Close
David Muriithi
Have you ever been in a winning trade and wanted to close say half of position to lock in some profit. Well, this expert advisor does just that for you, and it's absolutely free. What you need to do is set what percentage of your trade you'd like closed and then set the price you like to close at. It that simple. To get a better understanding of how it works, then watch the video below. Note: The EA only works with one timeframe, changing timeframes will result in lose of all data by the EA i
FREE
This indicator uses a different approach from the previous version to get it's trendlines. This method is derived from Orchard Forex, and the process of making the indicator is demonstrated in there video   https://www.youtube.com/watch?v=mEaiurw56wY&t=1425s . The basic idea behind this indicator is it draws a   tangent line   on the highest levels and lowest levels of the bars used for calculation, while ensuring that the lines don't intersect with the bars in review (alittle confusing? I know
FREE
The   currency strength momentum   has a lot of similarities with   currency strength meter   presented in the previous page, but the difference are much more pronounced. You can try putting both in the same chart and see the difference in results.   Currency strength momentum   measures strength of a currency based on (you guess it) it's momentum relative to other currencies, while   currency strength meter   measures the strength of a currency based on pips it has moved in a certain direction.
FREE
This indicator is an automated version of the Fibonacci retracement (Fib) indicator. Deciding the best areas to use when drawing the fib can be tricky and this  indicator was made with that in mind. When you drop it on the chart it will automatically choose the best points to draw the fib with, but in case you aren't satisfied with those regions, you can adjust it as you wish.
FREE
This indicators automatically draws the   support and resistances   levels (key levels) for you once you've dropped it on a chart. It reduces the hustle of drawing and redrawing these levels every time you analyse prices on a chart. With it, all you have to do is drop it on a chart, adjust the settings to your liking and let the indicator do the rest. But wait, it gets better; the indicator is absolutely free! For more information:  https://youtu.be/rTxbPOBu3nY For more free stuff visit:  https:
FREE
Have you ever wondered which currency is the strongest at any particular time? Or which currency pair is trending the most. Well, the currency strength meter helps with just that.  It compares  USD ,  EUR ,  AUD ,  CHF ,  GBP ,  CAD  and  NZD  depending on the timeline you have chosen in settings, and ranks them on the number of pips each has moved compared to the rest. N/B:   All currency charts of the above pairs must have loaded. You can do this by highlighting all major and minor currencies
FREE
The idea behind this indicator is to find all currency pairs that are over-bought or over-sold according to the RSI indicator at one go. The RSI uses the default period of 14 (this can be changed in the settings) and scans all symbols to find the RSI level you will have specified. Once currency pairs that meet the specification are found, the indicator will open those charts for you incase those charts aren't open and proceed to write the full list of currencies on the experts tab.
FREE
RSI GbjJpy Bot
David Muriithi
3 (1)
There are thousands, if not millions, of strategies on the internet, but only less than 10% work and of those even less have stood the test of time. Very few strategies have successfully weathered the 2008-2009 financial crisis, 2020 covid effects on the markets and all other unforeseen events that have affected the market in the last 2 decades. That being said, the strategy I feature in this episode does just that, the epitome of stability as I’ll show in a 20 year back-test. The source of th
FREE
FTMO Trading Panel
David Muriithi
5 (1)
The world of prop firm trading is one filled with tension and excitement in equal measure, and   FTMO   is definitely the most reputable firm out there. On one hand is the prospect of making huge sums of money and on the other, losing all the money you have invested. The easiest way of the latter scenario occurring is   drawdown , and more often than not   daily drawdown . It's what keeps us constantly checking our phones, the pain of every traders existence. What if there was a way of making
FREE
The world of prop firm trading is one filled with tension and excitement in equal measure, and   My Forex Funds   is on the forefront of bring that world to regular traders. On one hand is the prospect of making huge sums of money and on the other, losing all the money you have invested. The easiest way of the latter scenario occurring is   drawdown , and more often than not   daily drawdown . It's what keeps us constantly checking our phones, the pain of every traders existence. What if there w
FREE
Having trouble marking where the various forex sessions start and end? Or perhaps your strategy requires you trade only in a specific session, then this is for you. The session indicator shades the session you require in a certain color so that you can identify it easily. The sessions shown include: London session, New York session, Asian Session, Asian - London overlap and London - New York Overlap. Difference source give varying time ranges for the various session, mostly differing by not mo
FREE
Every trading guru, every YouTube tutorial, every trading book and every experienced trader tells us to risk a certain predetermined percentage of our account on a trade. (This isn't gambling! They said). But what they don't tell us is the number of computations it takes to balance the calculations of lot size, percentage risk and risk reward ratio all while ensuring the stoploss is the right number of pips away.  Enter The Forex Calculator. This Expert adviser is designed to make your trading s
For Meta Trader 5. We have all experienced a situation where the market wipes out our stoploss before it turning in the direction we had anticipated.  This experience is more frequent when you use a trailing stoploss. If only there was a way to place and trail the stoploss just the perfect amount of pips away. Well, there is...   The Average True Range (ATR) is a one of the most popular technical analysis indicator, introduced by J.Welles Wilder, that measures Market Volatility for a given numbe
Filtro:
gnanos123
942
gnanos123 2024.10.13 17:55 
 

Good IND

morteza ghasemi
49
morteza ghasemi 2023.04.26 13:06 
 

nice work

mr gecko
28
mr gecko 2022.12.04 01:41 
 

Very good

aaaahelp
24
aaaahelp 2022.06.27 05:35 
 

对内存系统资源消耗很高。

pedro de oliveira
45
pedro de oliveira 2021.08.29 21:15 
 

Good indicator!

ok196380
54
ok196380 2021.02.01 12:45 
 

It's a great and useful tool for me as a naked chart trader. Quite neat on the chart

Jesus Torres Parraga
1079
Jesus Torres Parraga 2021.01.23 16:31 
 

L'utente non ha lasciato alcun commento sulla valutazione.

Cristlan Ionut Bobi
134
Cristlan Ionut Bobi 2020.11.03 15:12 
 

L'utente non ha lasciato alcun commento sulla valutazione.

Rispondi alla recensione