Pivot classic woodie camarilla fibonacci demark
- Indicatori
- Versione: 1.10
- Aggiornato: 28 gennaio 2023

Pivot Classic, Woodie, Camarilla, Fibonacci and Demark
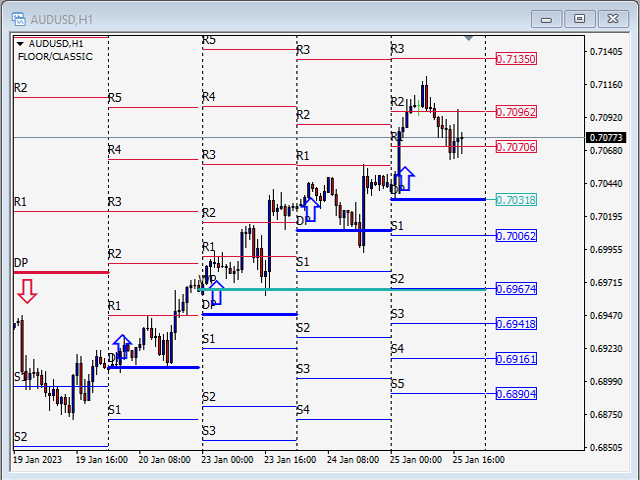
Floor/Classic
I punti pivot, o semplicemente pivot, sono utili per identificare potenziali livelli di supporto/resistenza, range di trading, inversioni di tendenza e sentiment di mercato esaminando i valori massimi, minimi e di chiusura di un asset. I Pivot Point Floor/Classic possono essere calcolati come segue.
Pivot Point (P) = (High + Low + Close)/3
S1 = P * 2 - High
S2 = P - (High - Low)
S3 = Low – 2*(High - P)
R1 = P * 2 - Low
R2 = P + (High - Low)
R3 = High + 2*(P - Low)
Woodie
Differisce dal metodo standard di calcolo del punto di rotazione. Utilizza la differenza tra il massimo e il minimo del giorno precedente, noto anche come intervallo, per calcolare i livelli di supporto e resistenza. Alcuni trader preferiscono utilizzare le formule Woodie poiché danno più peso al prezzo di chiusura del periodo precedente. I Pivot Point Woodie possono essere calcolati come segue.
R2 = P + (H - L)
R1 = (2 * P) - LOW
P = (HIGH + LOW + (CLOSE * 2)) / 4
S1 = (2 * P) - HIGH
S2 = P - (H - L)
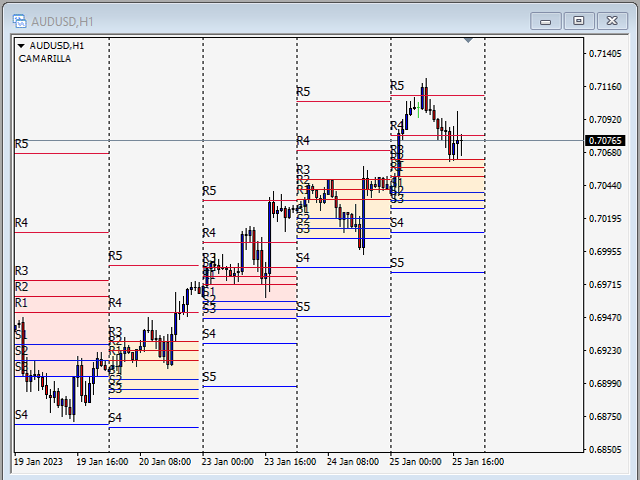
Camarilla
Le formule Camarilla sono simili alla formula Woodie. La sua idea di base è che il prezzo tende a tornare alla sua media. I livelli Camarilla aiutano a mirare a stop loss accurati e a mirare agli ordini di profitto. I livelli più importanti sono S3, S4 e R3, R4. I Pivot Point Camarilla possono essere calcolati come segue.
R4 = ((High - Low) * 1.1) / 2 + Close
R3 = ((High - Low) * 1.1) / 4 + Close
R2 = ((High - Low) * 1.1) / 6 + Close
R1 = ((High - Low) * 1.1) / 12 + Close
S1 = Close - ((High - Low) * 1.1) / 12
S2 = Close - ((High - Low) * 1.1) / 6
S3 = Close - ((High - Low) * 1.1) / 4
S4 = Close - ((High - Low) * 1.1) / 2
Fibonacci
I livelli del punto di rotazione Fibonacci vengono determinati calcolando prima il punto di rotazione, come nel metodo standard. Quindi moltiplica l'intervallo del giorno precedente per il corrispondente livello xx 04. La maggior parte dei trader usa correzioni del 38,2%, 61,8% e 100% nei loro calcoli. La logica alla base di ciò è che molti trader utilizzano quote Fibonacci. I Pivot Point Fibonacci possono essere calcolati come segue.
Pivot Point (P) = (High + Low + Close)/3
Support 1 (S1) = P - (0.382 * (High - Low))
Support 2 (S2) = P - (0.6182 * (High - Low))
Support 3 (S3) = P - (1 * (High - Low))
Resistance 1 (R1) = P + (0.382 * (High - Low))
Resistance 2 (R2) = P + (0.6182 * (High - Low))
Resistance 3 (R3) = P + (1 * (High - Low))
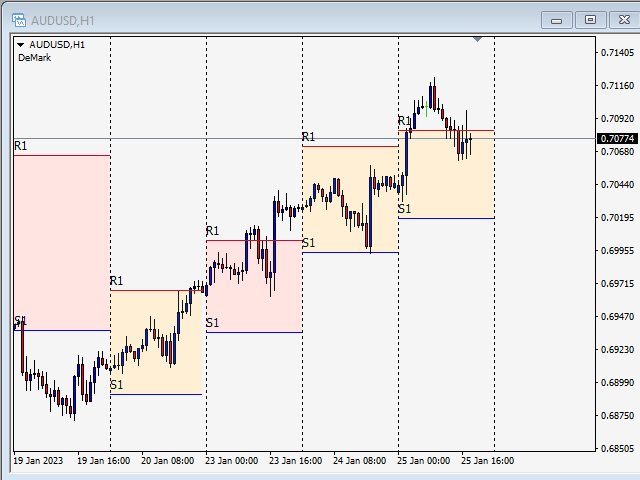
Demark
Questi punti pivot hanno una natura condizionale che pone maggiore enfasi sui recenti movimenti di prezzo basati sulla relazione tra il prezzo di apertura e il prezzo di chiusura. I Pivot Point Demark possono essere calcolati come segue.
If Close < Open, then X = High + (2 * Low) + Close
If Close > Open, then X = (2 * High) + Low + Close
If Close = Open, then X = High + Low + (2 * Close)
Support 1 (S1) = X/2 - High
Resistance 1 (R1) = X/2 - Low
L'utente non ha lasciato alcun commento sulla valutazione.