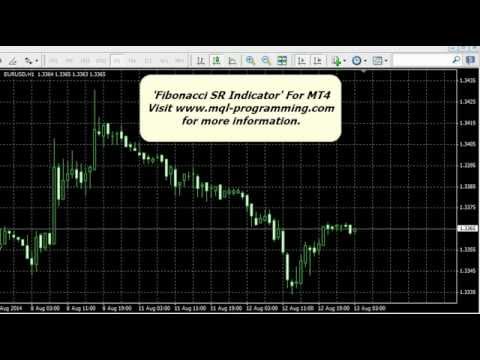
Fibonacci SR Indicator
- Indicatori
- Versione: 1.31
- Aggiornato: 3 aprile 2020

Fibonacci SR Indicator
This indicator creates support and resistance lines. This indicator is based on Fibonacci Retracement and Extension levels. It will consider many combinations of the Fibonacci levels and draw support/resistance lines based on these. This indicator uses tops and bottoms drawn by the ZigZag indicator in its calculations. The ZigZag can also be drawn on the chart, if necessary.
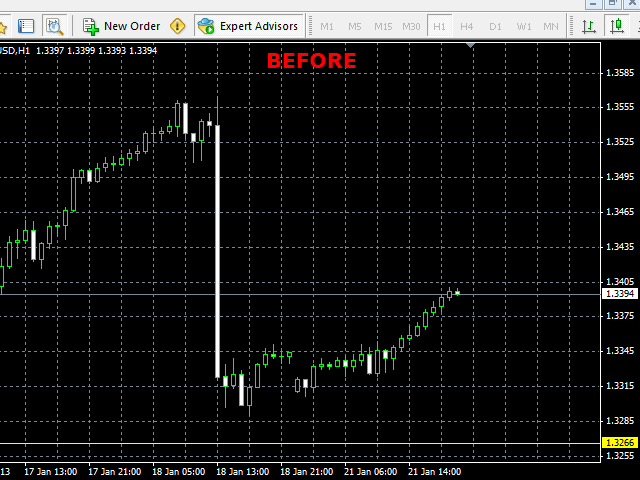
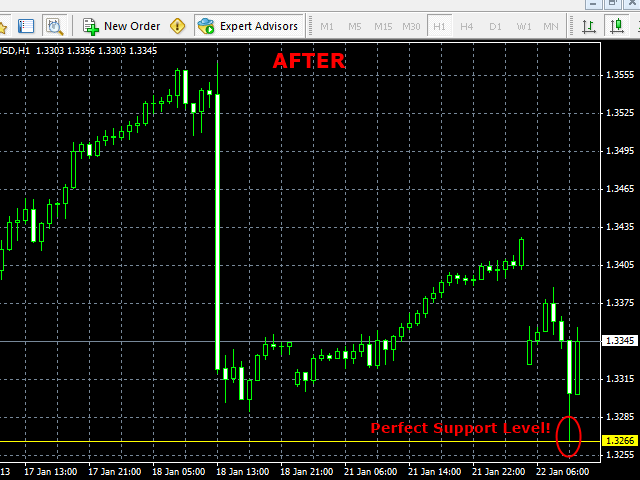
The indicator considers many combinations of past reversal points and Fibonacci ratio levels, and when it sees confluence of multiple lines at the same price, then this becomes a support/resistance line drawn by the indicator. A future market reversal will often occur exactly at these lines. This is an automatic indicator. So, old lines will be deleted and new lines will be drawn as the market advances.
Settings
- Bars_Back - A certain number of bars back will be used for all calculations. The lower the number then the fewer reversal points will be used and therefore the less support and resistance lines will be drawn. The more the number of bars back then more reversal points will be used and therefore the more support and resistance lines will be drawn.
- Buffer_Space - This represents the maximum number of points between each calculated Fibonacci level required for confluence. The higher the number then the less exact the confluence must be. The lower the number then the more precise the confluence must be and therefore the higher the reliability. For example, let's say it is set to 10 points and the indicator is running on a non-fractional 4-digit broker (so the same as 10 pips). The indicator sees 3 Fib. retracement levels at 1.4995, 1.5000, and 1.5005. There is 10 pips difference here. So, these levels can be used. Let's say the buffer is set to only 5. Then these 3 levels cannot be used since there is a max. difference of 10 which is more than 5. The indicator can look for other combinations of lines though in this case.
- Count_of_Lines - This controls the number of lines required to be in confluence in order to create a final support/resistance line. The higher the number, then the more reliable the drawn lines will be and vice versa.
- The rest of the settings should be self-explanatory.
Notes
- IMPORTANT: Check out our site using the link in my profile to find other FREE indicators and EAs!


Отличный продукт!