Quantitative Market
- Indicatori
-
Syamsurizal Dimjati
 Hello traders, I design and develop high-quality indicators and Expert Advisors (EAs) for MT5 (since 2023), built to help you achieve more consistent and reliable trading results.
 - Versione: 1.2
- Aggiornato: 18 maggio 2026
Advanced Quantitative Market Dashboard
The Advanced Quantitative Market Dashboard is a professional-grade, multi-dimensional analytical tool designed for MetaTrader 5. Unlike traditional indicators that rely on lagging visual signals, this dashboard utilizes a Conditional Probability Engine to bridge the gap between historical market behavior and live price action.
By scanning deep historical data and matching it with real-time market regimes, the indicator filters out market noise and provides traders with an institutional-level perspective on trend continuation, statistical edges, and volatility exhaustion.
Key Features & Analytical Core
-
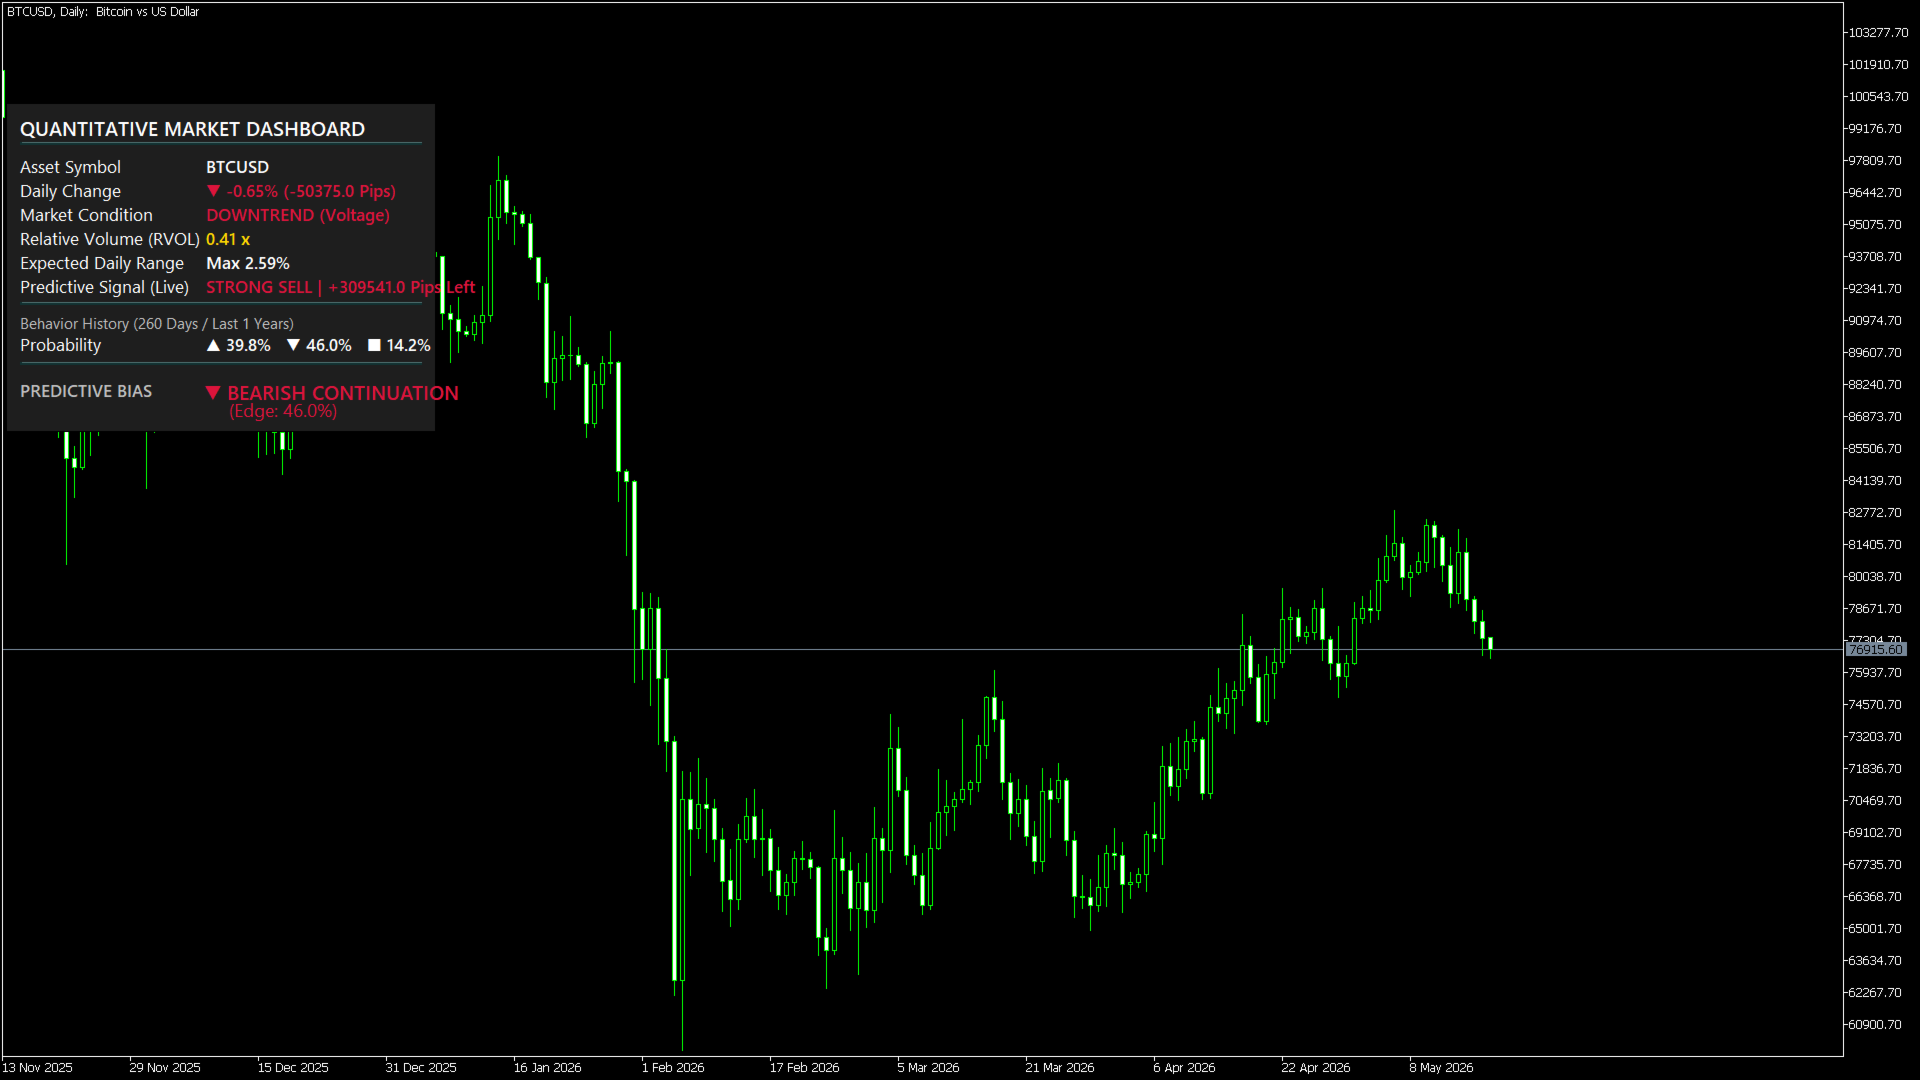
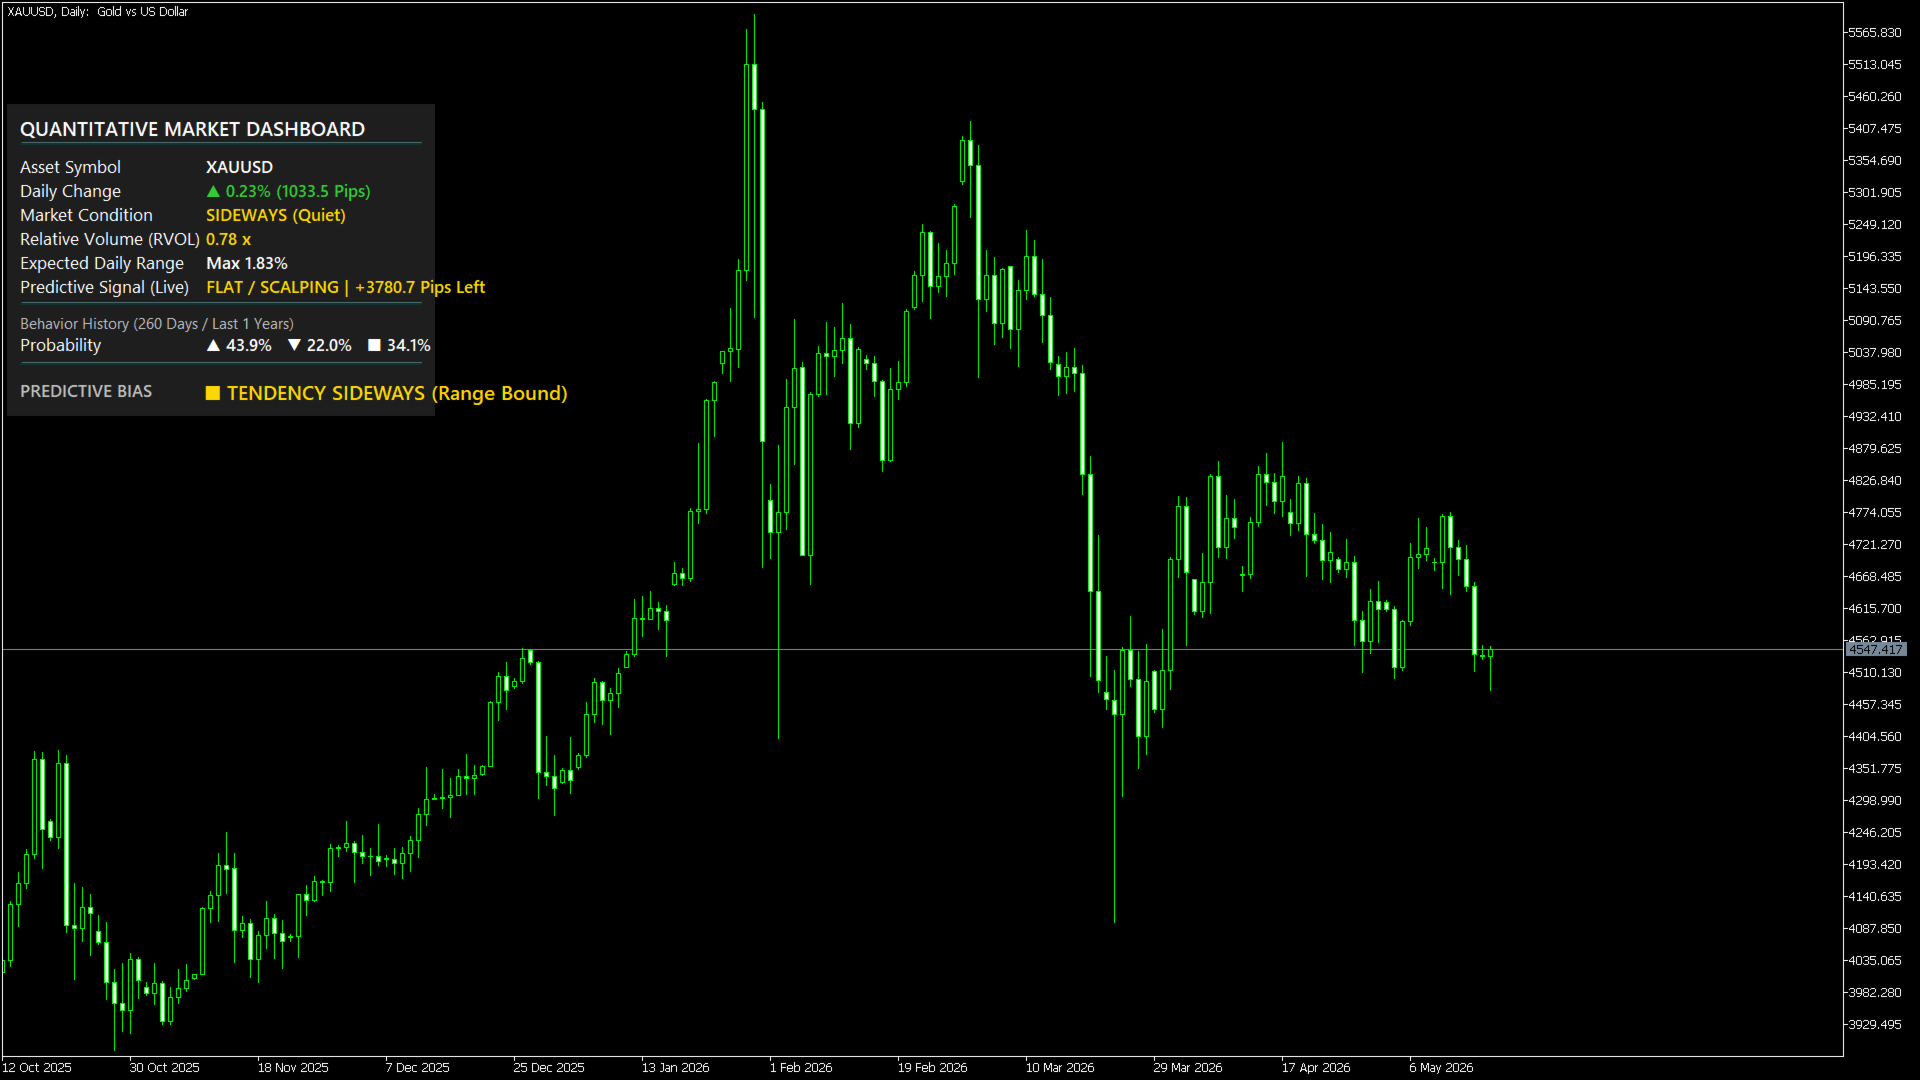
Live Market Metrics & Regime Detection
Tracks real-time percentage changes and standardized pip movements. It automatically categorizes the market into clear regimes (e.g., Sideways/Range-Bound vs. Trend/High Volatility) based on customizable threshold parameters.
-
Synchronized Conditional Probability Engine
Instead of calculating a flat, generic win-rate over past history, the dashboard dynamically scans the last 1–2 years of data to find historical days that perfectly match today's current market conditions. It then calculates the exact mathematical probability of tomorrow's direction (▲ Bullish, ▼ Bearish, ■ Sideways).
-
Predictive Live Signals & Edge Quantification
Provides data-driven execution suggestions (e.g., STRONG BUY, BUY ON RETRACE, STRONG SELL, FLAT / SCALPING) backed by a quantified Predictive Edge (%) derived directly from the historical match rate.
-
Volatility Room (Expected Daily Range)
Integrates a live Average True Range (ATR) percentage tracker. The dashboard calculates the "Pips Left" for the day, acting as a crucial safety filter to prevent you from chasing a trend when the market has already exhausted its daily expected range.
-
Smart Multi-Channel Notifications
Stay connected to the markets without staring at your screen. Features a built-in notification system that sends perfectly formatted, synchronized summaries via MT5 Pop-up Alerts, Push Notifications to your Mobile Device, and Emails whenever a major predictive signal or market regime shifts.
How to Read the Dashboard Interface
| Metric | Description | Trading Utility |
| Daily Change | Live % and Pip movement from the day's open. | Identifies immediate momentum. |
| Relative Volume (RVOL) | Current volume compared to the $N$-day average. | RVOL > 1.0 indicates institutional participation. |
| Expected Daily Range | Maximum percentage room left for the day. | Prevents buying at the exact top or selling at the bottom. |
| Predictive Signal (Live) | Dynamic strategy bias + remaining Pips to target. | Gives clear structural targets for intraday trades. |
| Next Day Prob | Conditional probabilities (▲ / ▼ / ■). | Shows whether historical repetitions favor continuation or reversal. |
Input Parameters
-
Dashboard Settings: Customize background colors, fonts, text sizing, and X/Y anchor positions to fit any chart template seamlessly.
-
Analysis Settings: Adjust the historical data sample size (in years), set custom sideways percentage thresholds, and modify the RVOL period to match your specific asset class (Forex, Crypto, Gold, or Indices).
-
Notification Settings: Fully toggle or combine Alerts, Push Notifications, and Emails with customized cool-down intervals to avoid alert spamming.
Why Choose This Indicator?
-
Zero Lag, Pure Math: No moving average crossovers or delayed oscillators. It works with raw price distribution and statistical probability.
-
No Logic Gaps: The dashboard visualizes the exact same metrics that fuel your automated phone alerts, ensuring complete consistency across your desktop and mobile trading platforms.
-
Clean & Lightweight UI: Optimized code structure guarantees smooth chart performance without slowing down your MT5 terminal, featuring a dynamic auto-adjusting background layer that never obscures your canvas text.