Time Volume Profile
- Indicatori
-
Giuseppe Pajusco
 Chi sono
 - Versione: 2.0
- Attivazioni: 20
Profile
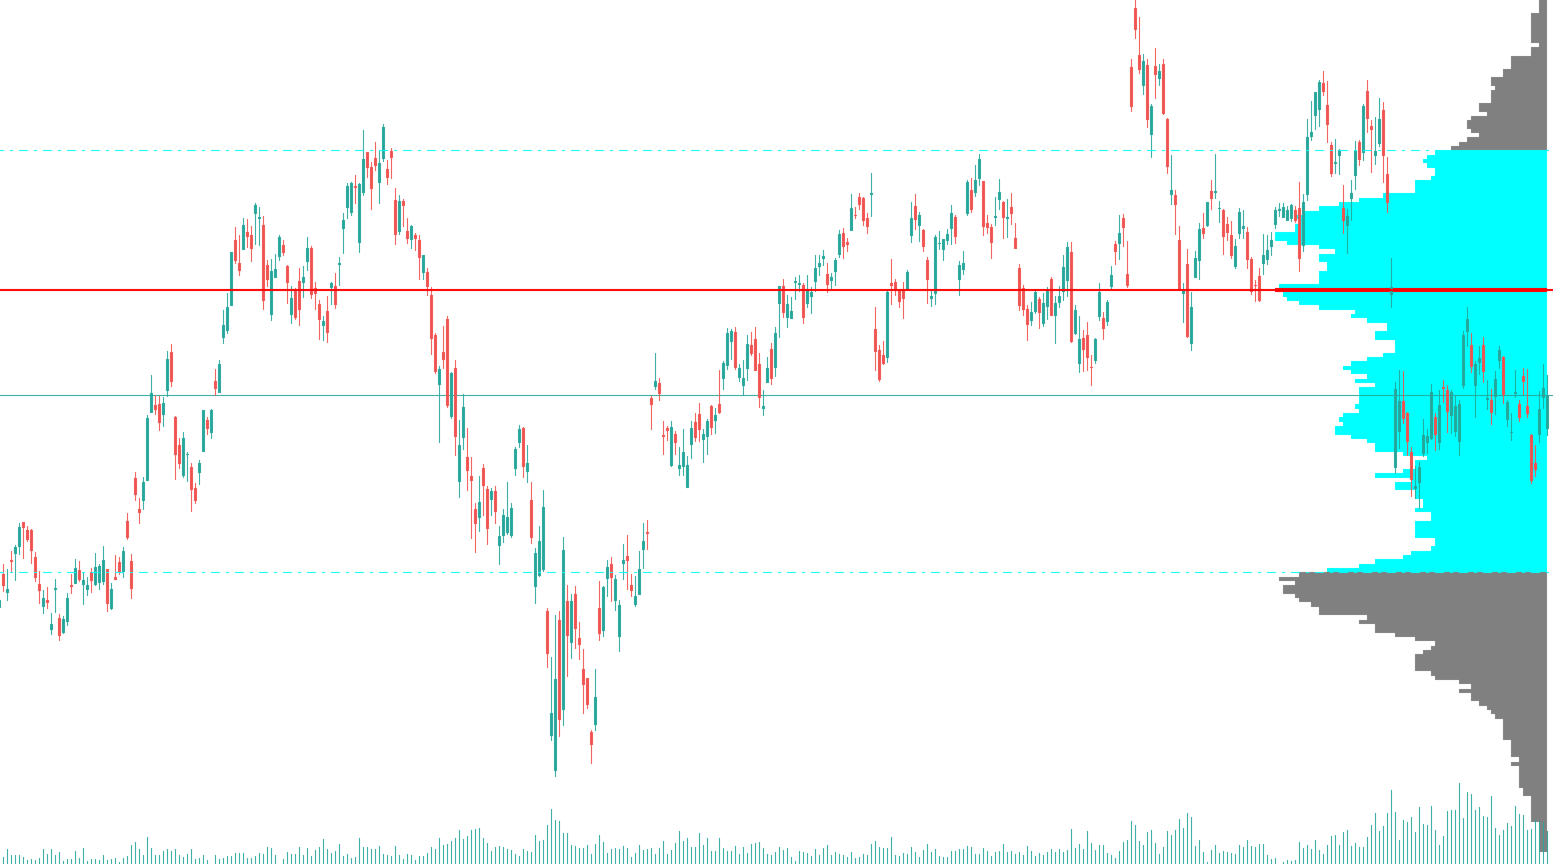
Market profile analytics — POC, Value Area High and Value Area Low — computed from pure price action. No tick volume required.
Overview
TimeVolumeProfile brings institutional-grade market profile analysis to any instrument and timeframe — without depending on a broker's tick-volume feed. It identifies the price levels where the market has spent the most time over a configurable lookback window, exposing them as tradable reference points.
Traditional volume profile indicators are limited by the quality of the volume data provided by the broker, which varies widely across instruments and asset classes. TimeVolumeProfile bypasses this limitation entirely by measuring price-frequency: how many candles have passed through each price level. The result is a distribution that closely mirrors a true volume profile, applicable to Forex, indices, commodities and crypto alike.
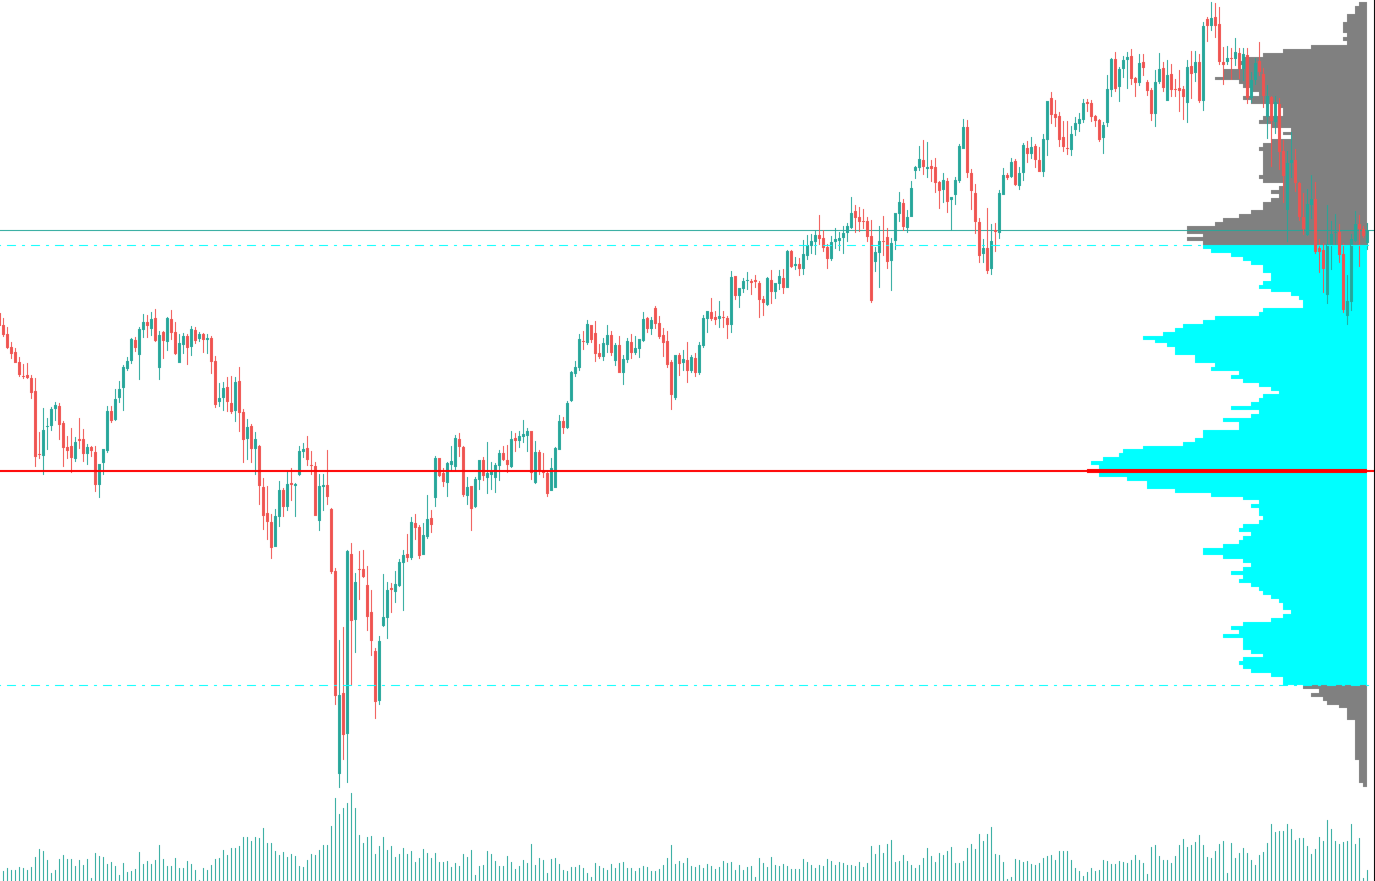
The three key levels — POC, VAH and VAL — are drawn directly on the chart as a horizontal histogram and are simultaneously exposed as indicator buffers, so Expert Advisors can read them programmatically via iCustom() with no additional configuration.
How It Works
The algorithm follows the standard Market Profile methodology, adapted to work from OHLC data alone. Each step runs in O(N · B) time — linear in both the lookback window and the number of bins — ensuring no perceptible performance impact on any timeframe.
- Range detection
The highest high and lowest low across the entire lookback window are found. This range is divided into N equally-spaced price bins.
- Frequency counting
For each candle, every bin that falls between its low and its high receives a frequency increment of 1. A candle spanning multiple bins increments all of them.
- POC identification
The bin with the highest cumulative frequency is the Point of Control. Its centre price becomes the POC level drawn on the chart.
- Value Area expansion
Starting from the POC bin, the algorithm expands outward one bin at a time — always choosing the side with the higher next-bin frequency — until the cumulative count reaches the configured Value Area percentage (default 70 %).
- Chart rendering & buffer export
The histogram, POC line, VAH and VAL are drawn as chart objects anchored to the right edge of the lookback window. All three levels are simultaneously written into indicator buffers for EA consumption.
Features
Parameters
| Parameter | Description | Default |
|---|---|---|
| Profile Settings | ||
| Lookback | Number of candles included in the profile calculation. A larger value produces a broader, longer-term profile. Minimum: 2. | 100 |
| NumBins | Number of equally-spaced price bins dividing the lookback range. Higher values increase resolution but may produce noisy profiles on small ranges. Range: 2–500. | 20 |
| ValueAreaPercent | Percentage of total frequency that defines the Value Area. The standard Market Profile convention is 70 %. Range: 1–100 %. | 70.0 |
| Visual Settings | ||
| ProfileColor | Color of histogram bars outside the Value Area. | DodgerBlue |
| POCColor | Color of the POC horizontal line and the POC bin in the histogram. | Red |
| VAColor | Color of the VAH and VAL lines and all Value Area bins in the histogram. | LimeGreen |
| ProfileWidth | Maximum width of the histogram in bars, measured rightward from the most recent candle of the lookback window. | 50 |
Expert Advisor Integration
The indicator exposes three DRAW_NONE buffers that carry the current POC, VAH and VAL values across every bar of the lookback window. Access them from an Expert Advisor as shown below.
All three values are constant across every bar of the lookback window, so any bar shift from 1 to Lookback - 1 returns the same result. Use shift 1 (the latest closed bar) as a convention to avoid repainting on the live candle.
Compatibility