Volume Profile For MT5
- Indicatori
- Versione: 2.1
- Aggiornato: 1 maggio 2026
- Attivazioni: 15

Volume Profile VPVR per MT5
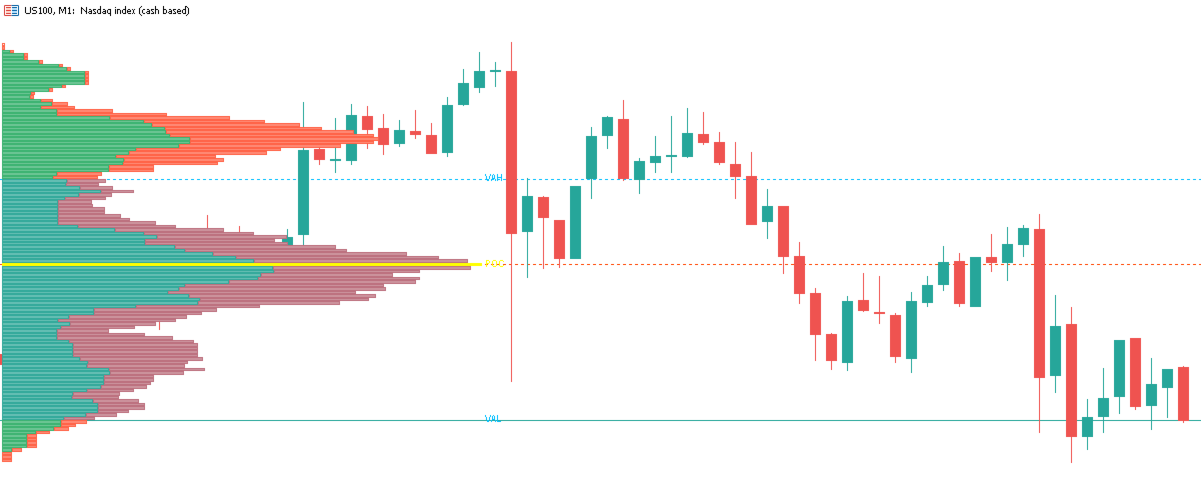
Volume Profile VPVR è un indicatore potente e performante per MetaTrader 5, progettato per replicare l'avanzato Volume Profile (Visible Range) direttamente sul grafico. Fornisce una visione approfondita della struttura del mercato, visualizzando le aree in cui si concentra l'attività di trading e aiutando i trader a identificare con precisione i livelli di prezzo chiave.
Questo indicatore analizza dinamicamente la distribuzione dei volumi sui diversi livelli di prezzo e genera un istogramma dettagliato direttamente sul grafico, consentendo di comprendere a colpo d'occhio le zone di accettazione e rifiuto del mercato e i cluster di liquidità.
🔍 Caratteristiche principali
• Modalità Visible Range e Fixed Range
Passa facilmente dalla modalità VPVR (che si adatta automaticamente alle candele visibili) alla definizione di un intervallo personalizzato per un'analisi precisa.
• Point of Control (POC)
Rileva ed evidenzia automaticamente il livello di prezzo con il volume di scambio più elevato, ovvero il livello di maggiore interesse del mercato.
• Area di Valore (VAH / VAL)
Visualizza i valori massimi e minimi dell'Area di Valore in base a una percentuale configurabile (predefinita 70%), aiutando a identificare le zone di valore equo.
• Suddivisione del volume rialzista e ribassista
Ogni barra del volume è suddivisa in pressione di acquisto (rialzista) e di vendita (ribassista), offrendo una visione più approfondita del flusso degli ordini.
• Aggiornamenti in tempo reale (basati sui tick)
Il profilo si aggiorna continuamente con i tick in arrivo per un monitoraggio del mercato in tempo reale senza ritardi.
• Estensione dei livelli chiave
Le linee POC, VAH e VAL possono essere estese sul grafico, fungendo da zone di supporto/resistenza dinamiche.
• Posizionamento del profilo regolabile
Visualizza il profilo sul lato sinistro o destro del grafico a seconda del tuo stile di trading.
• Scalatura del volume (visibilità migliorata)
Estendi o comprimi l'istogramma utilizzando un moltiplicatore di scala del volume per una maggiore chiarezza visiva.
• Etichette del volume integrate
Visualizza facoltativamente i valori del volume di acquisto/vendita direttamente all'interno delle barre dell'istogramma con una formattazione intelligente (unità K/M). • Sviluppo del POC (Opzionale)
Monitora l'evoluzione del POC in tempo reale per comprendere i cambiamenti del sentiment di mercato.
• Design completamente personalizzabile
Controlla colori, trasparenza, caratteri, stili di linea e layout per adattarli alla tua configurazione di trading.
⚙️ Come funziona
L'indicatore divide l'intervallo di prezzo selezionato in più righe (bin) e distribuisce il volume in base alla sovrapposizione dei prezzi per candela. Successivamente:
Aggrega il volume totale per livello di prezzo
Identifica il nodo di volume più alto (POC)
Si espande verso l'esterno per calcolare l'Area di Valore (VAH/VAL)
Visualizza un istogramma che mostra la concentrazione del volume a ciascun prezzo
📊 Perché utilizzare questo indicatore?
Identifica le zone ad alta liquidità dove le istituzioni sono attive
Individua livelli di supporto e resistenza significativi
Comprende l'equilibrio e lo squilibrio del mercato
Migliora i punti di ingresso, di uscita e il posizionamento degli stop loss
Combinalo con Smart Money Concepts o strategie di price action
🚀 Ideale per:
Day trader
Scalper
Swing trader
Trader Smart Money / Order Flow
Questo indicatore porta l'analisi dei volumi di livello istituzionale su MetaTrader 5 con un'implementazione fluida, ottimizzata e visivamente pulita, rendendolo uno strumento essenziale per i trader più esperti.

L'utente non ha lasciato alcun commento sulla valutazione.