Renko Chart Builder
- Utilità
- Nopphawin Inthaphong
- Versione: 2.60
- Aggiornato: 17 aprile 2026
https://youtu.be/BW1dBr4Ir4E Important Note: You cannot execute orders directly on the simulated (offline) chart. However, you can open it side-by-side with your main chart and place your trades on the main chart.Renko Chart Builder User Manual (UI Edition)
How to use: Simply drag and drop the tool onto your chart, just like any standard indicator.
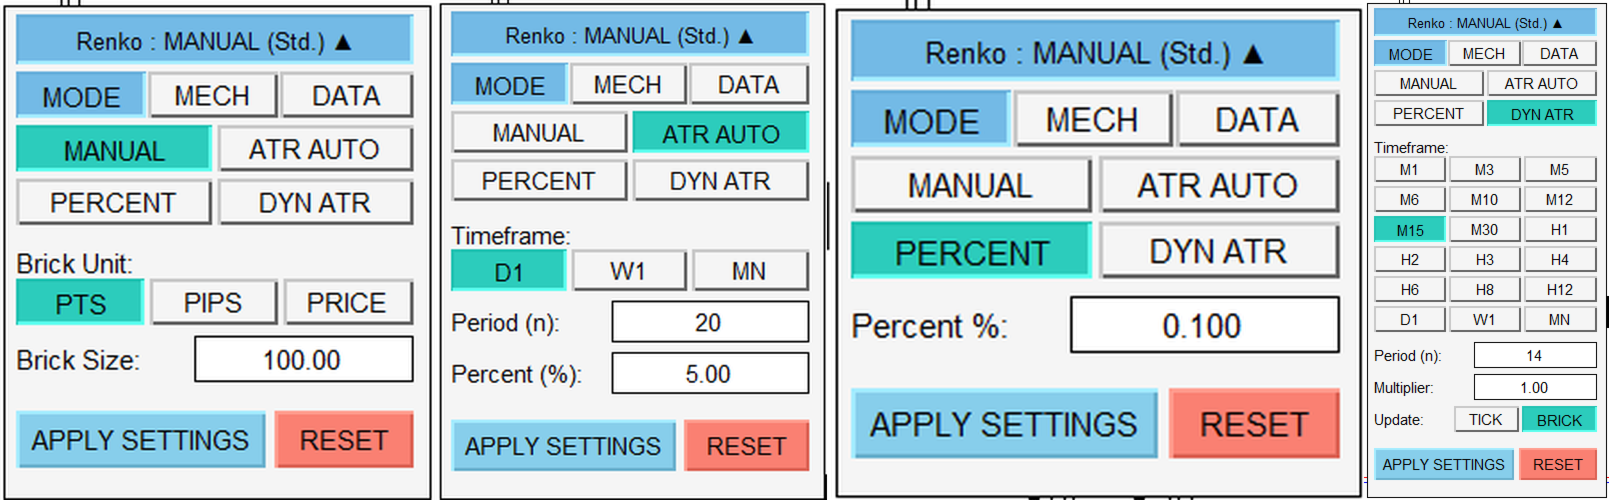
MODE (Brick Size Settings)
This menu allows you to choose how the program calculates the size of the Renko bricks:
-
MANUAL: You set the exact size yourself (selectable units: Points, Pips, or Price).
-
ATR AUTO: The program automatically calculates the brick size based on Average True Range (ATR) volatility according to your chosen Timeframe (e.g., D1, W1).
ATR AUTO Example (Gold - XAUUSD): Let's say you configure the UI as follows:
ATR Timeframe: PERIOD D1 (Daily volatility)
ATR Period: 20 (Average of the last 20 days)
ATR Percent (%): 5.0 (Take only 5% of the average daily movement)
How it calculates:
Find ATR: The program checks the last 20 days and finds that Gold moves an average of 2,000 points (20.00 USD) per day.
Calculate %: The program multiplies 2,000 x 5% (0.05).
Result: Your brick size will be set to 100 points (1.00 USD) per brick.
-
PERCENT: Calculates the brick size as a percentage of the current price.
-
DYN ATR: The brick size continuously adjusts in real-time based on current market volatility.
-
4.1 TICK (Real-time adjustment):
-
Concept: Recalculates the ATR with every single price tick.
-
What happens: If the current brick hasn't closed and volatility suddenly spikes, the ATR skyrockets and the current brick's required size expands immediately, running away from the price.
-
The Feeling: It’s like chasing a finish line that has a motor attached to it. When you run faster, the finish line speeds away; when you slow down, it slows down.
-
-
4.2 BRICK (Locked from the previous bar):
-
Concept: Uses the ATR value from the most recently closed brick.
-
What happens: When a new brick starts, the program locks in the size (e.g., "This brick needs to be 100 points"). It remains completely fixed until the brick closes, regardless of whether the market explodes or flatlines.
-
The Feeling: It’s like a referee telling you to run a 100-meter dash. Only after you cross the finish line will the referee check the weather again and say, "Okay, next round is 120 meters."
-
-
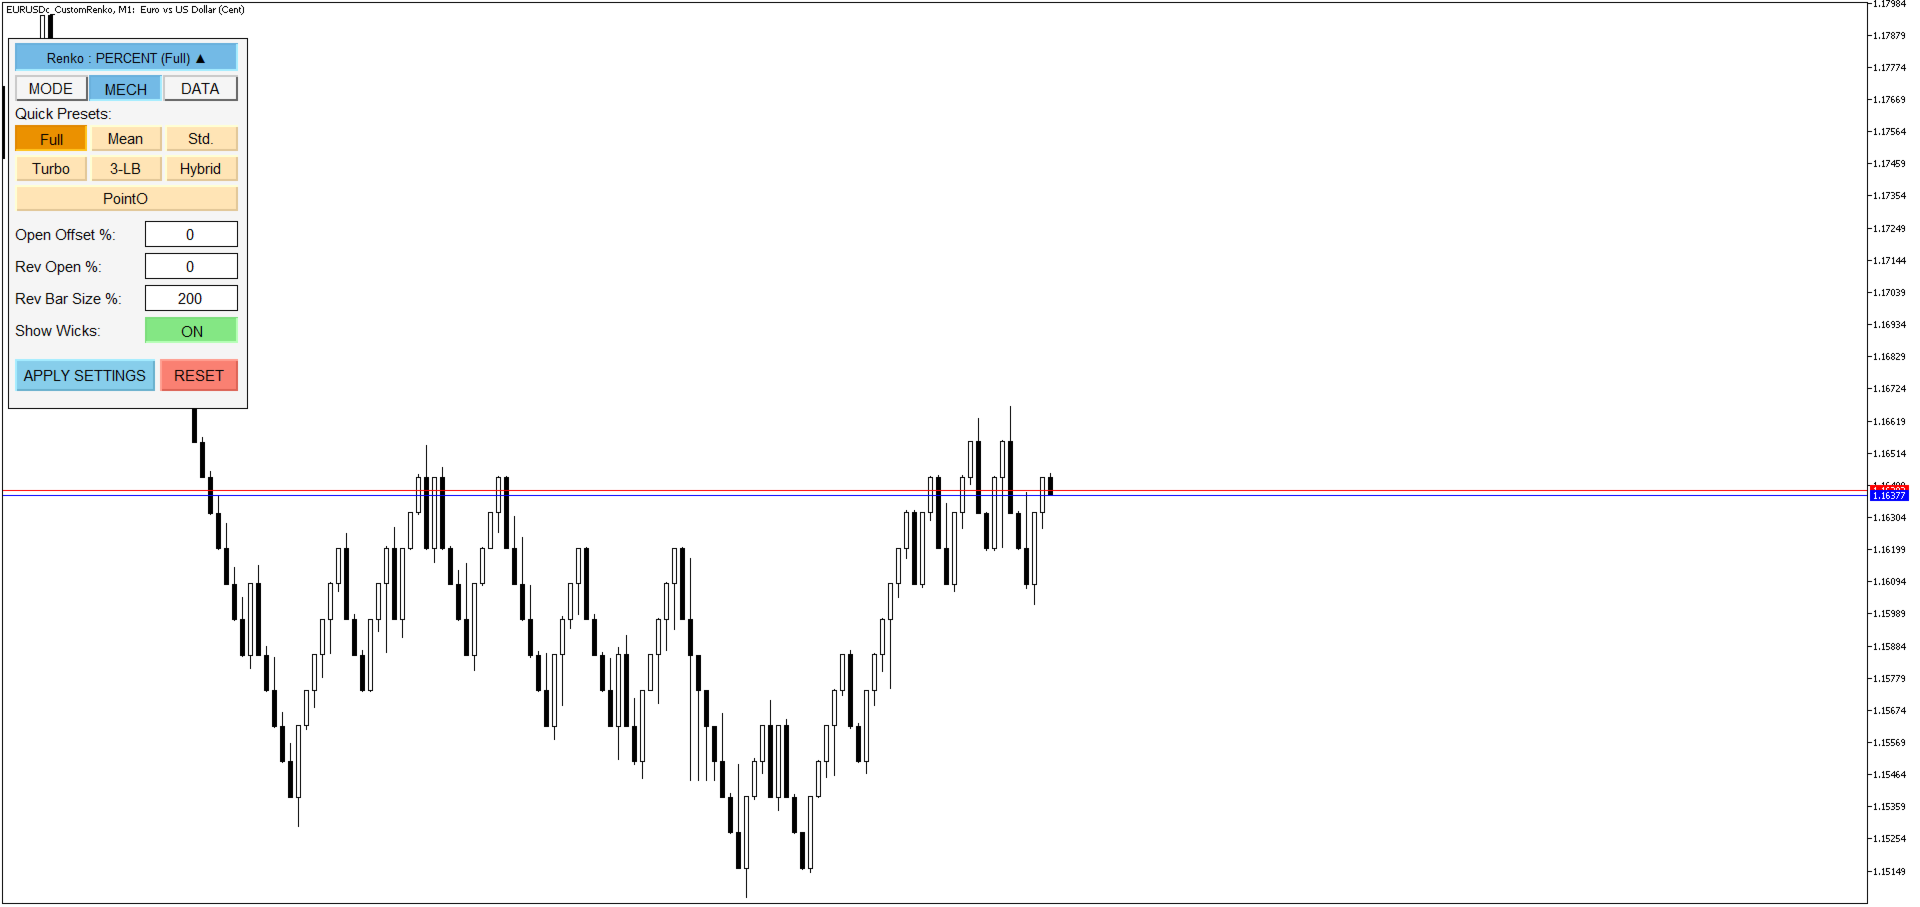
MECH (Mechanism Settings)
This section defines the "look" and "behavior" of how the Renko bricks are drawn.
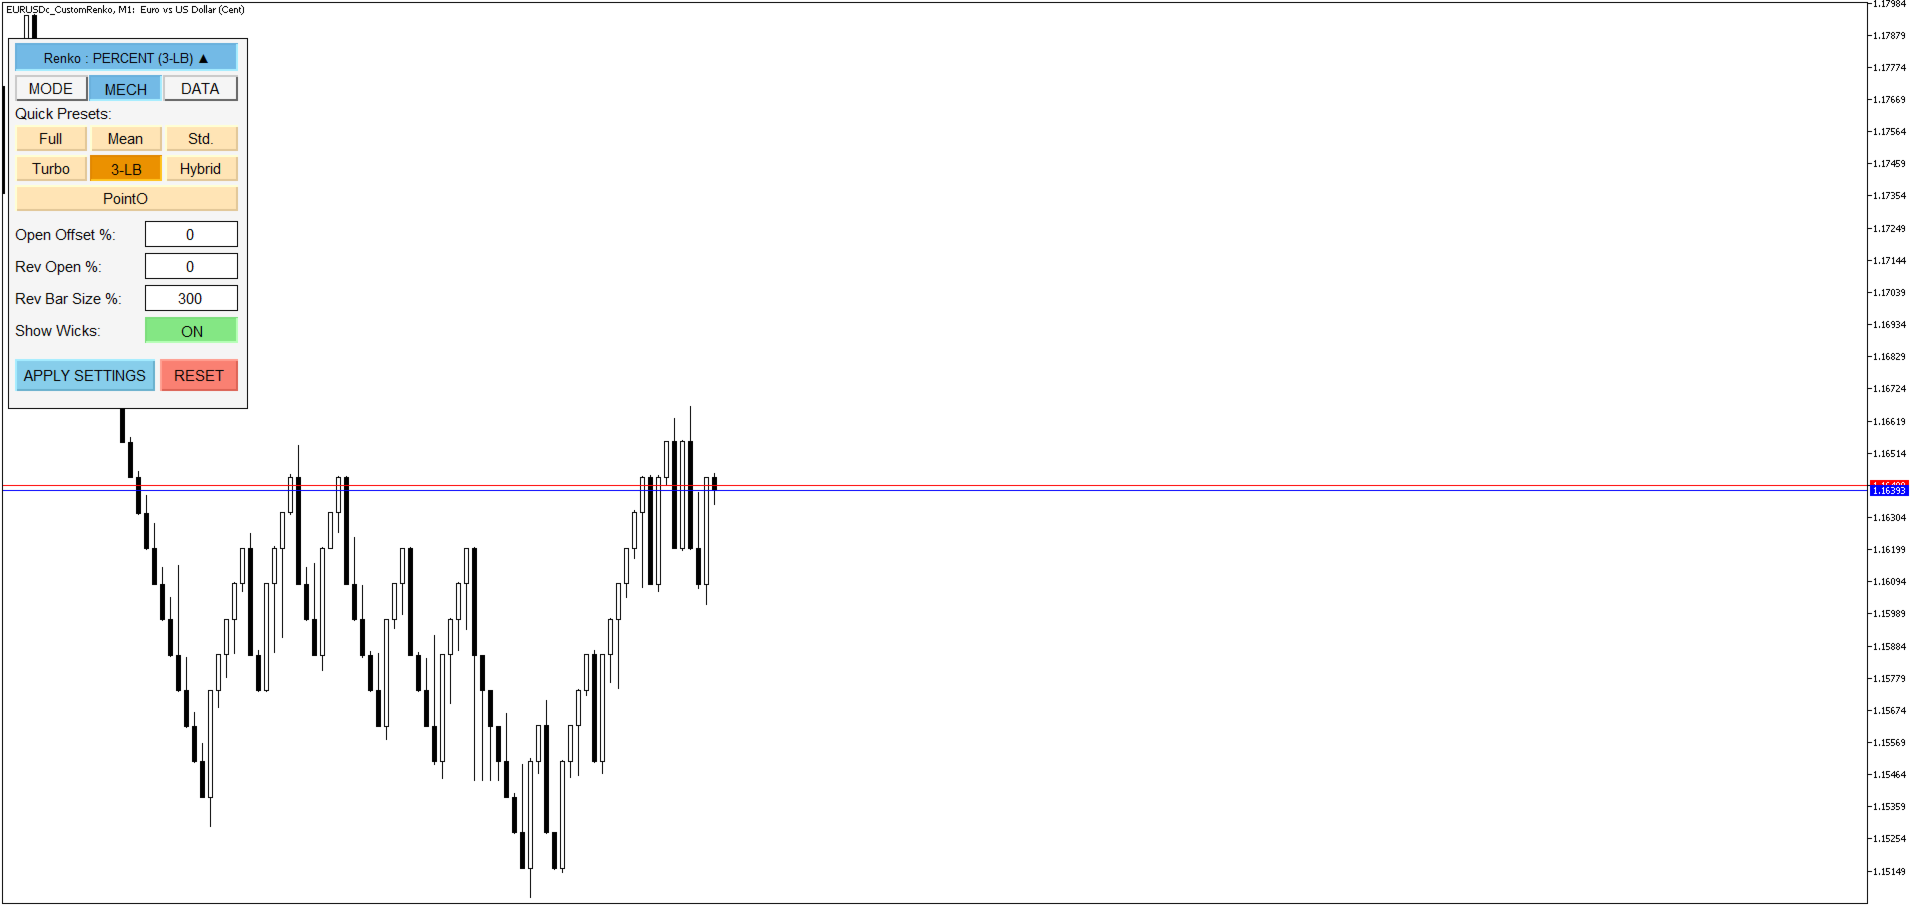
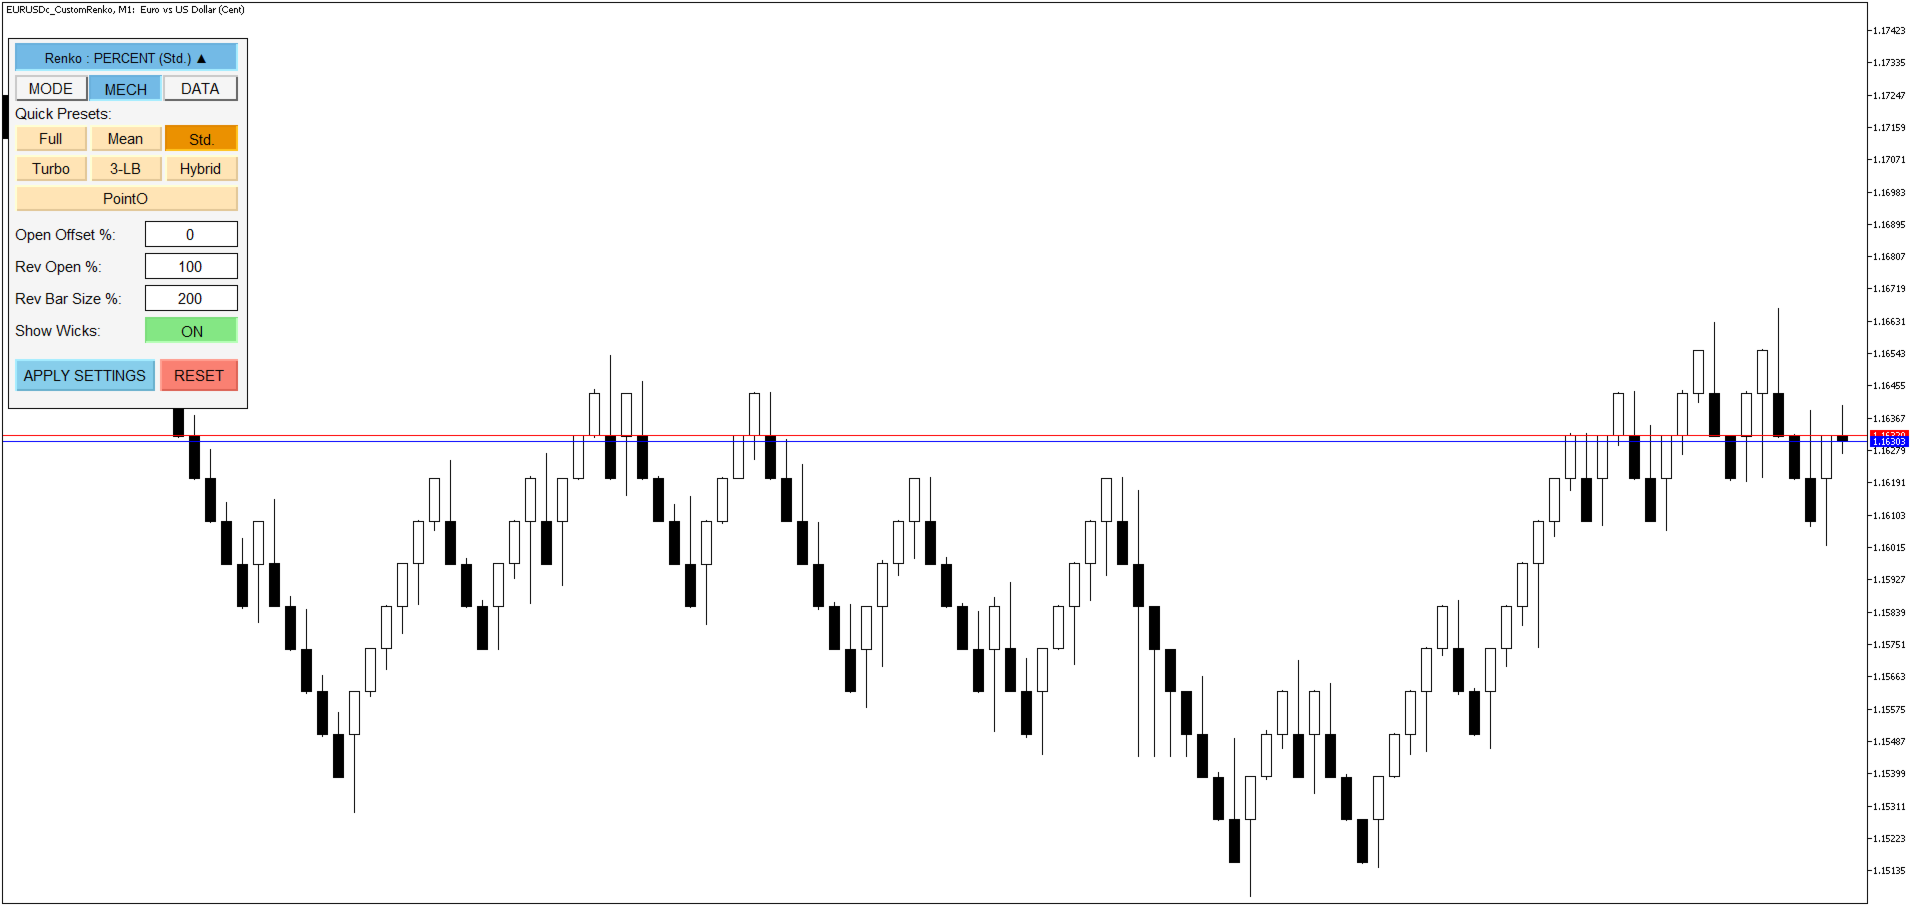
1. Quick Presets
For users who want a quick setup, the program offers 7 highly popular presets. Just click a button, and the chart will instantly adjust:
| Preset Name | Open Offset | Rev Open | Rev Bar Size | Characteristics |
| Full Reversal Renko | 0% | 0% | 200% | Opens at previous close; requires 2x distance to reverse. |
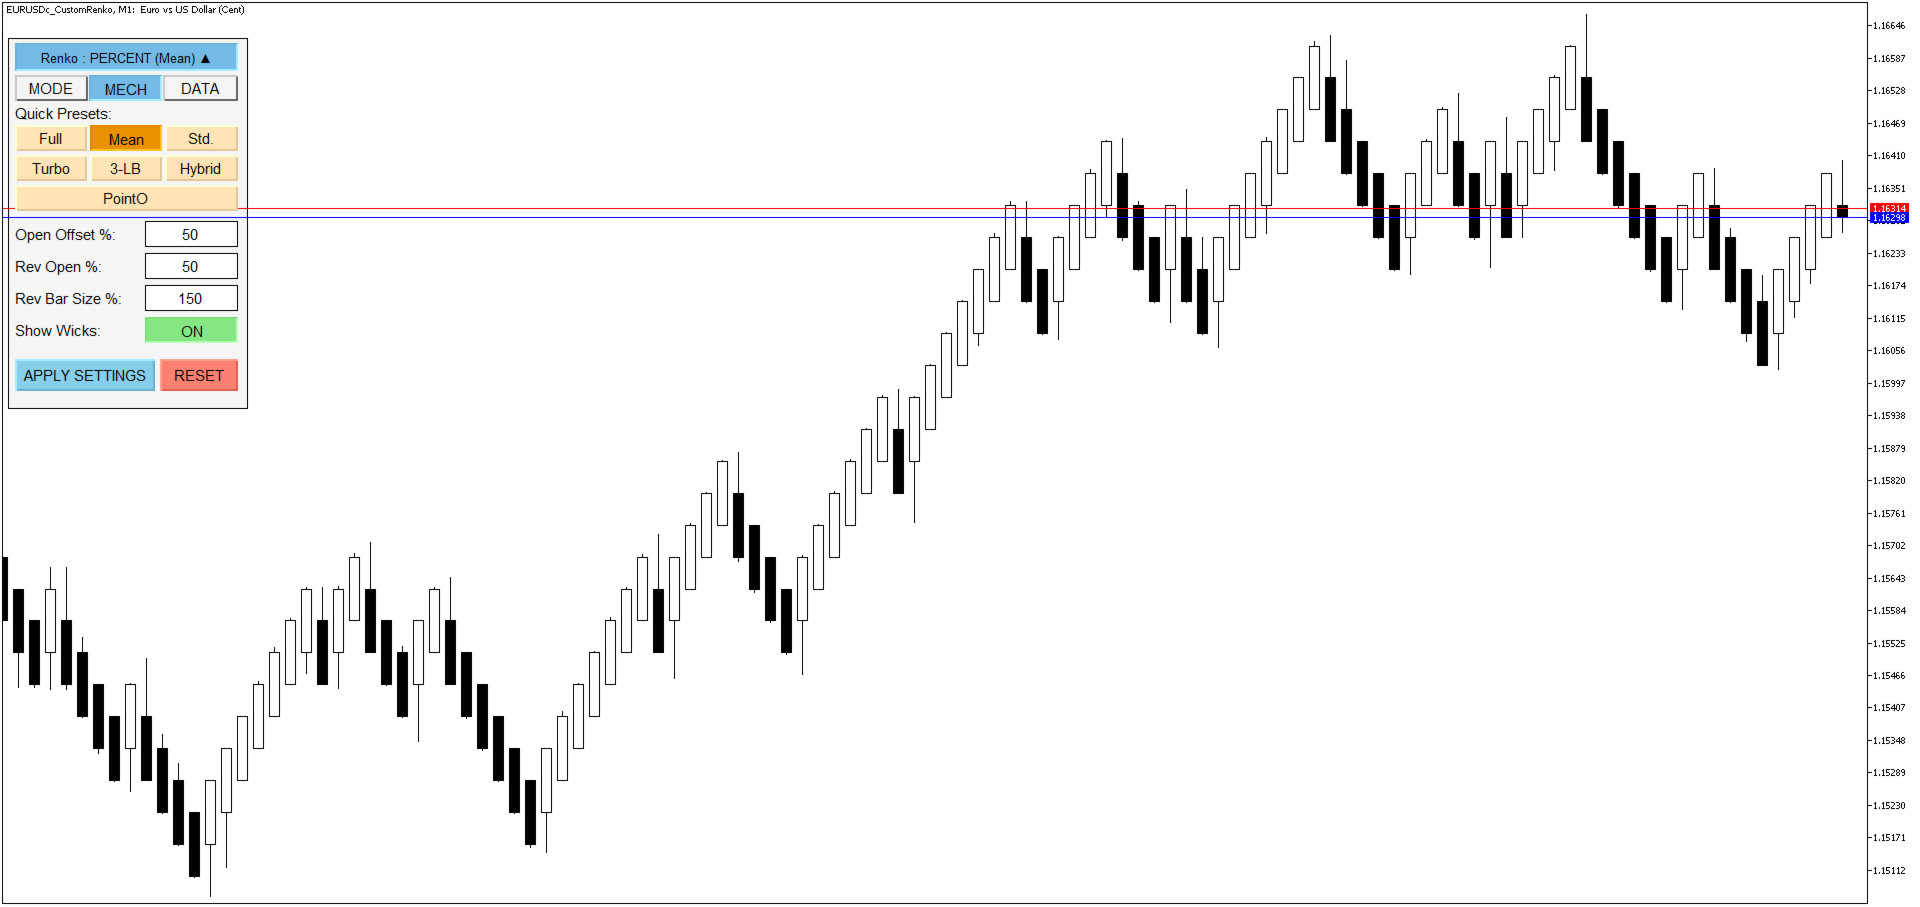
| Mean Renko | 50% | 50% | 150% | Opens at brick midpoint; requires 1.5x distance to reverse. |
| Standard Renko | 0% | 100% | 200% | Opens at previous close; 100% reversal base; requires 2x distance. |
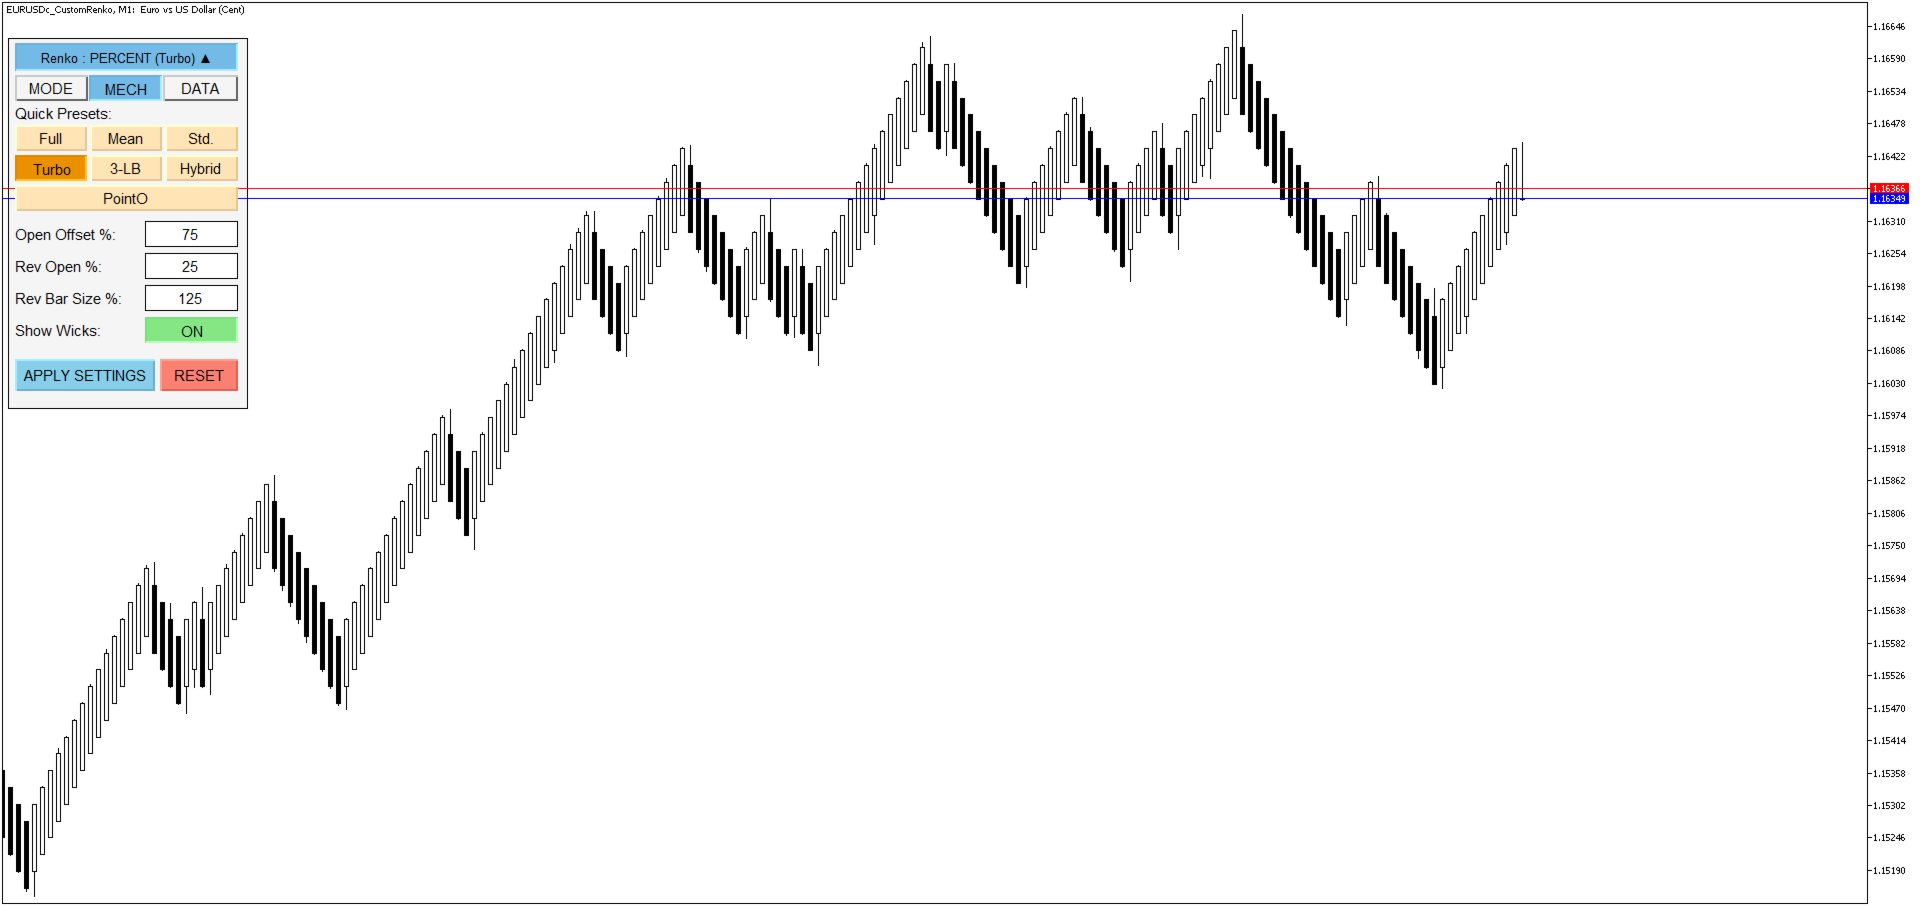
| Turbo Renko | 75% | 25% | 125% | Very fast reversal; requires only 1.25x distance to reverse. |
| 3 Line Break Renko | 0% | 0% | 300% | Hard to reverse; requires a massive 3x distance to reverse. |
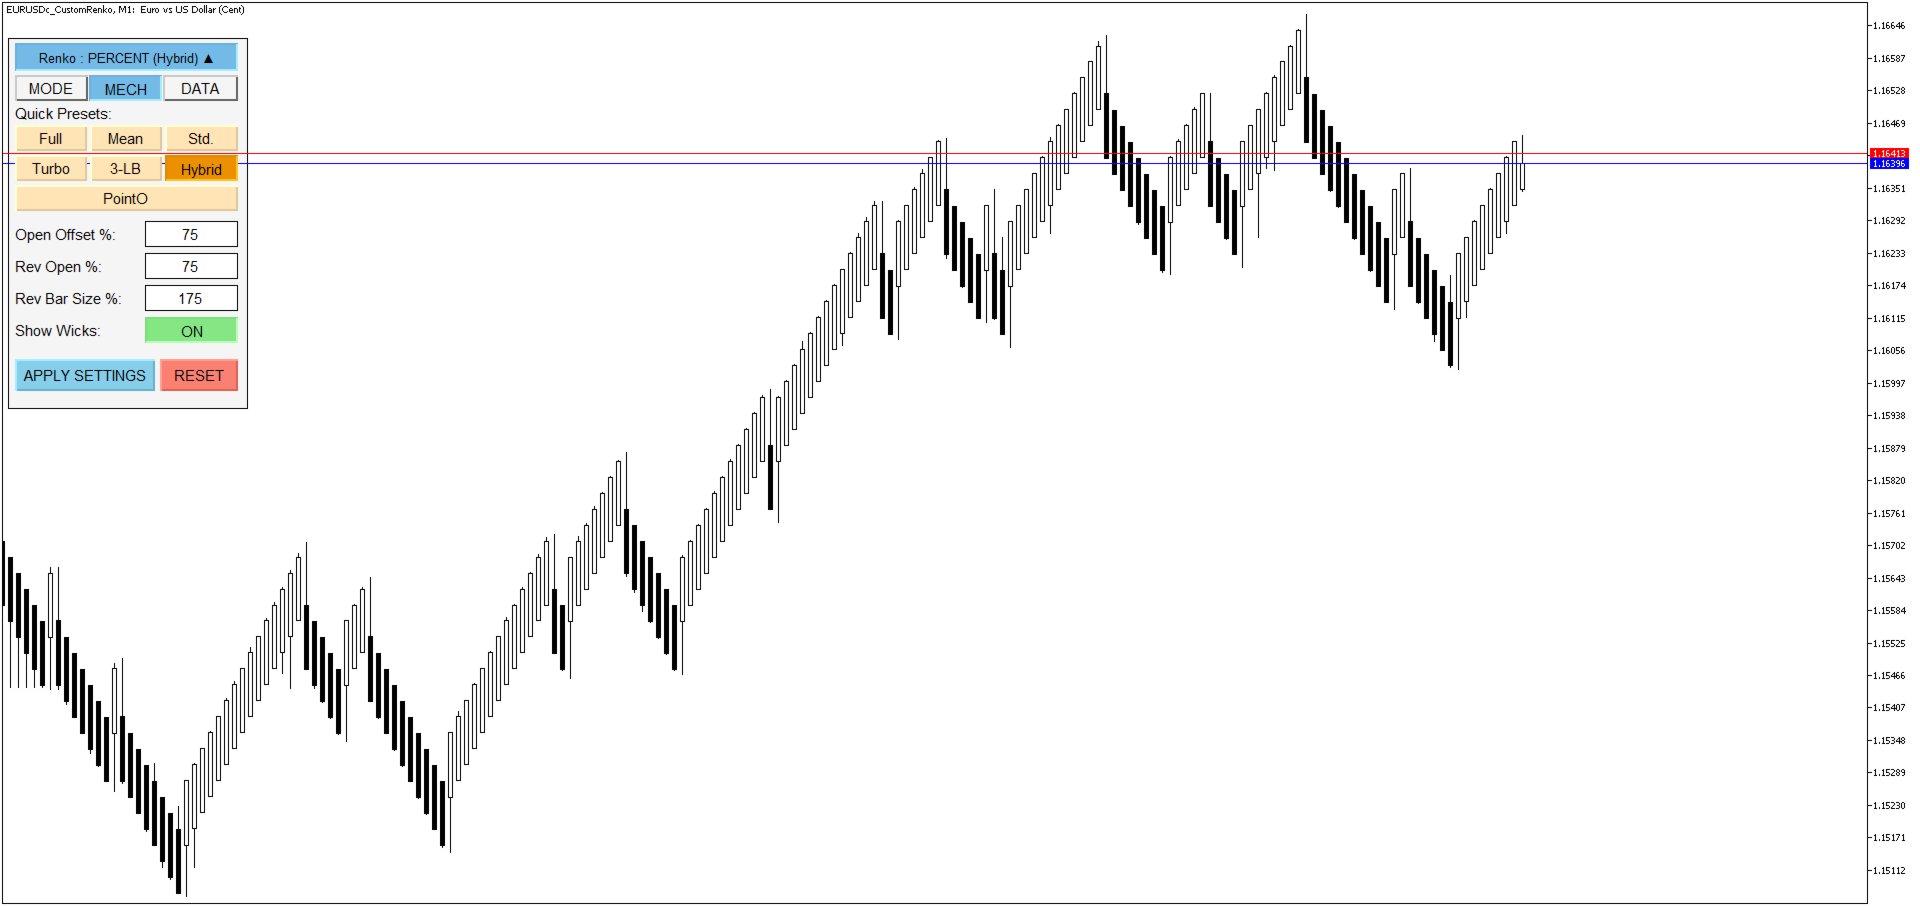
| Hybrid Renko | 75% | 75% | 175% | 75% offset; requires 1.75x distance to reverse. |
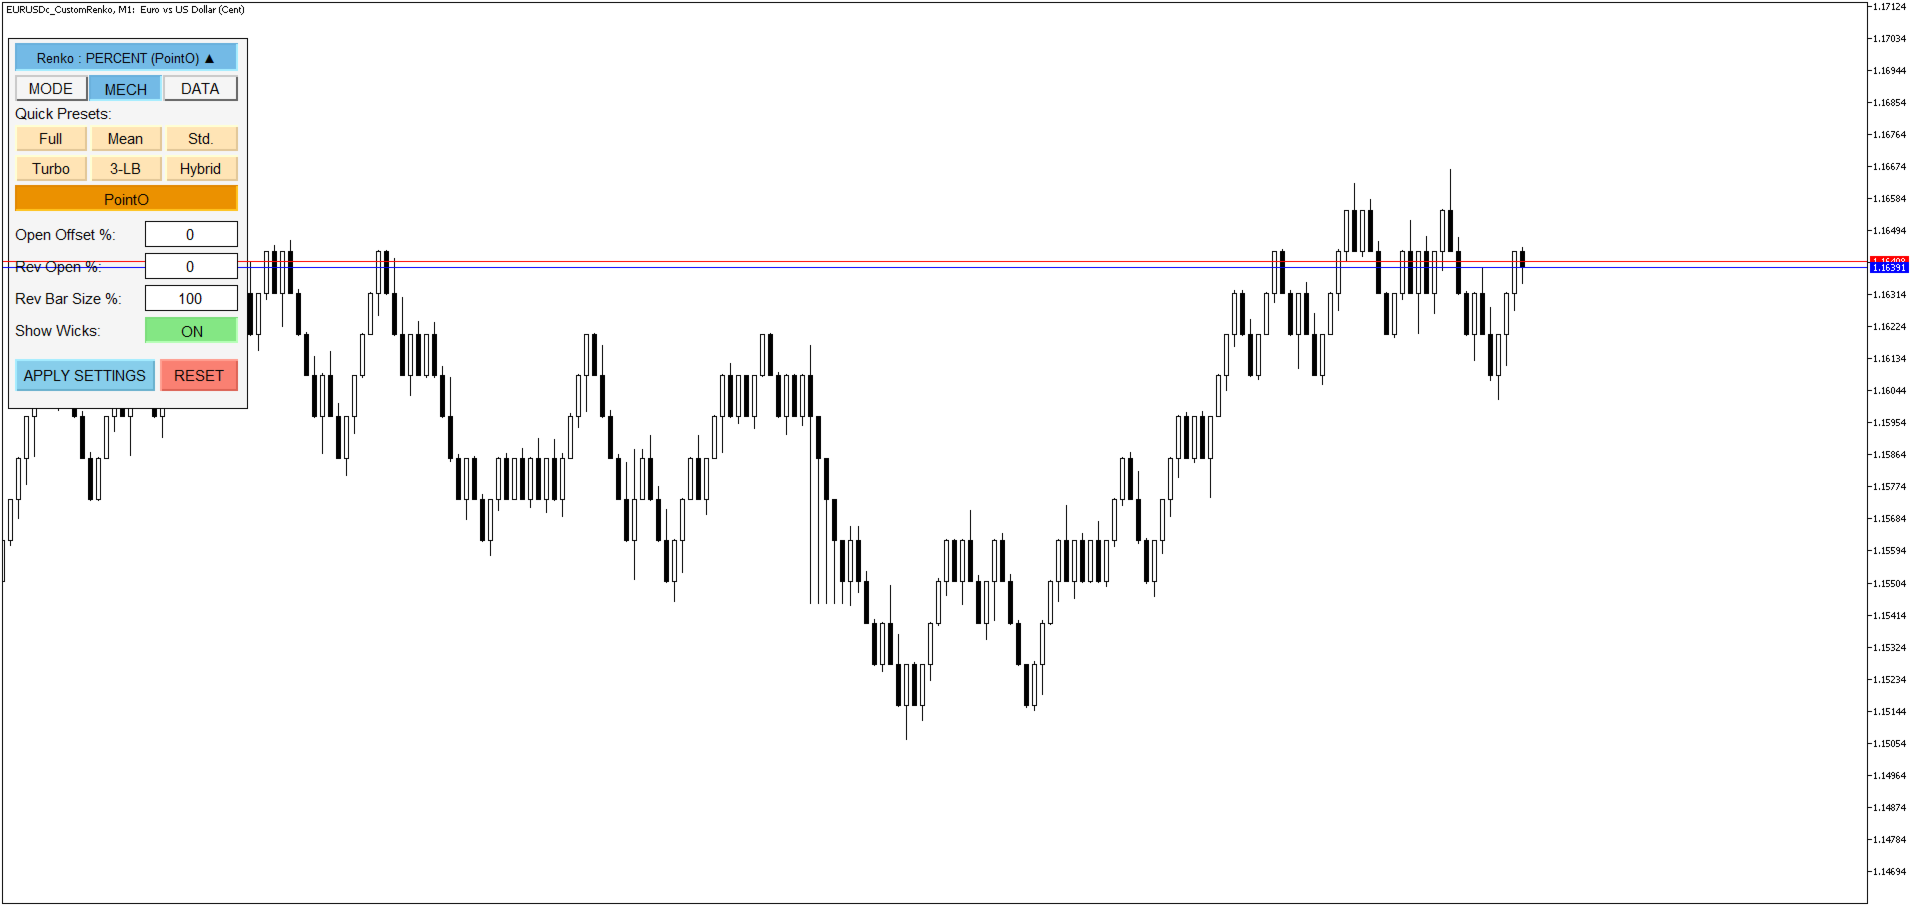
| Point Original | 0% | 0% | 100% | All bricks are identical; always 1x distance to continue or reverse. |
2. Custom Settings
If the presets don't quite fit your strategy, you can manually input values:
-
Open Offset % (Trend Continuation): During an ongoing trend, this dictates if the new brick starts exactly at the end of the previous brick (0%) or overlaps into the previous brick (e.g., 50%).
-
Rev Open % (Reversal Origin): When the market changes direction (changes color), this determines where on the previous brick the new reversal brick begins.
-
Rev Bar Size % (Reversal Resistance): This is a key feature! It defines how aggressively the price must move against the trend to draw a reversal brick.
-
Example: Setting this to 200% means the price must reverse the distance of two full bricks combined before the chart changes color. This is excellent for filtering out market noise and "head fakes."
-
-
Show Wicks: * ON: Displays wicks, showing you exactly how far the price spiked up or down while the brick was still forming.
-
OFF: Hides wicks for a clean, block-only chart.
-
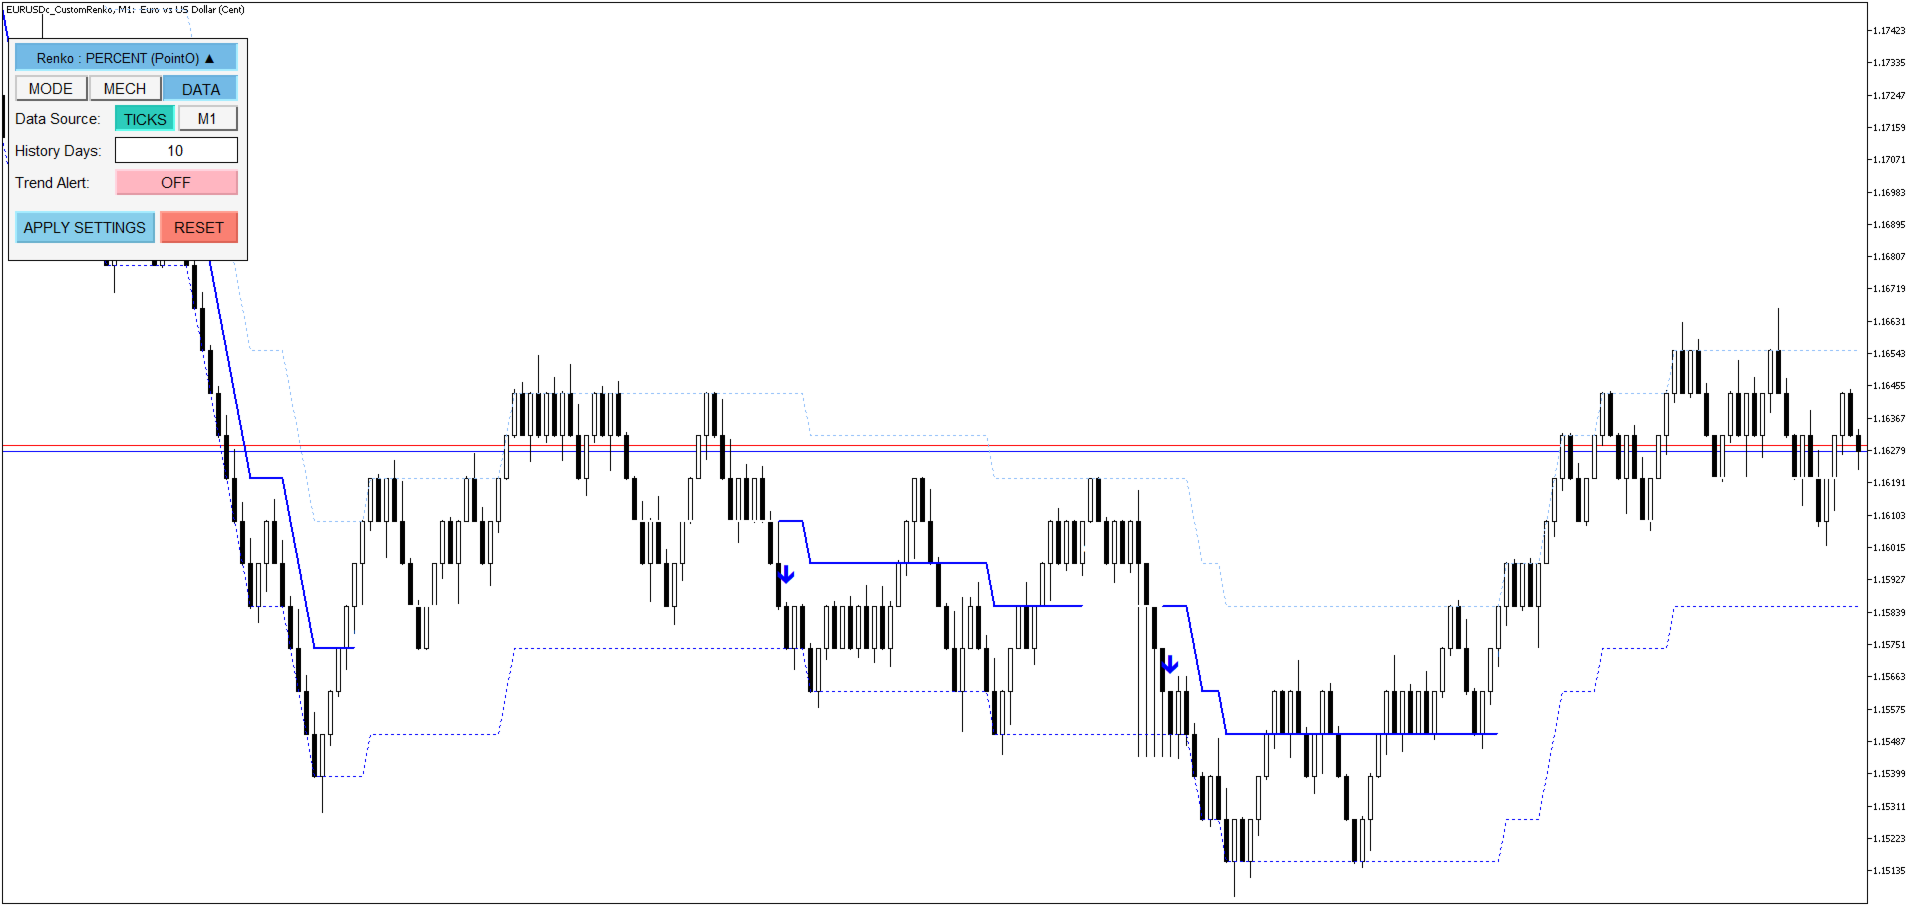
DATA (Data Management & Alerts)
Data Source
Choose the historical data precision for your chart:
-
TICKS: 100% accurate, as it uses every real market movement (loads slightly slower).
-
M1 (1-Minute OHLC): Focuses on speed by using 1-minute candle data to simulate the chart. Ideal for older computers or viewing deep historical data.
-
How M1 OHLC works: Instead of reading every tick, it uses the 4 key data points of a 1-minute candle (Open, High, Low, Close).
-
Simulation Path: Since it can't see the exact movement inside that minute, it assumes a standard path:
-
Green Candle: Open → Low → High → Close
-
Red Candle: Open → High → Low → Close
-
-
Advantage: M1 data is significantly smaller than Tick data, allowing you to load months or years of history without lagging your PC.
-
Additional Settings
-
History Days: Sets how many days into the past the program should draw the chart (e.g., 5 days, 10 days) to help you analyze historical support and resistance.
-
Trend Alert: * ON: Triggers a sound and pop-up alert the exact moment the Renko brick changes color (trend shifts).
-
OFF: Disables alerts.
-
-
Reset Button: Restores all settings to their original factory defaults, just like when you first attached the indicator.


good