Market Structure Break and Order Block

Market Structure Break & Order Block (MSB-OB)

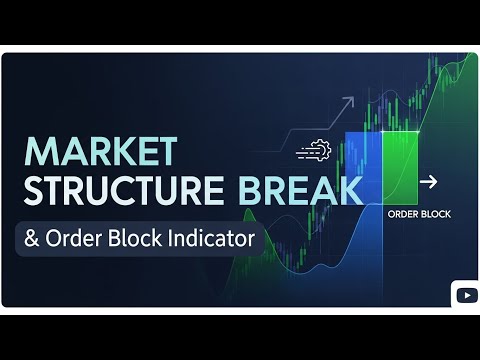
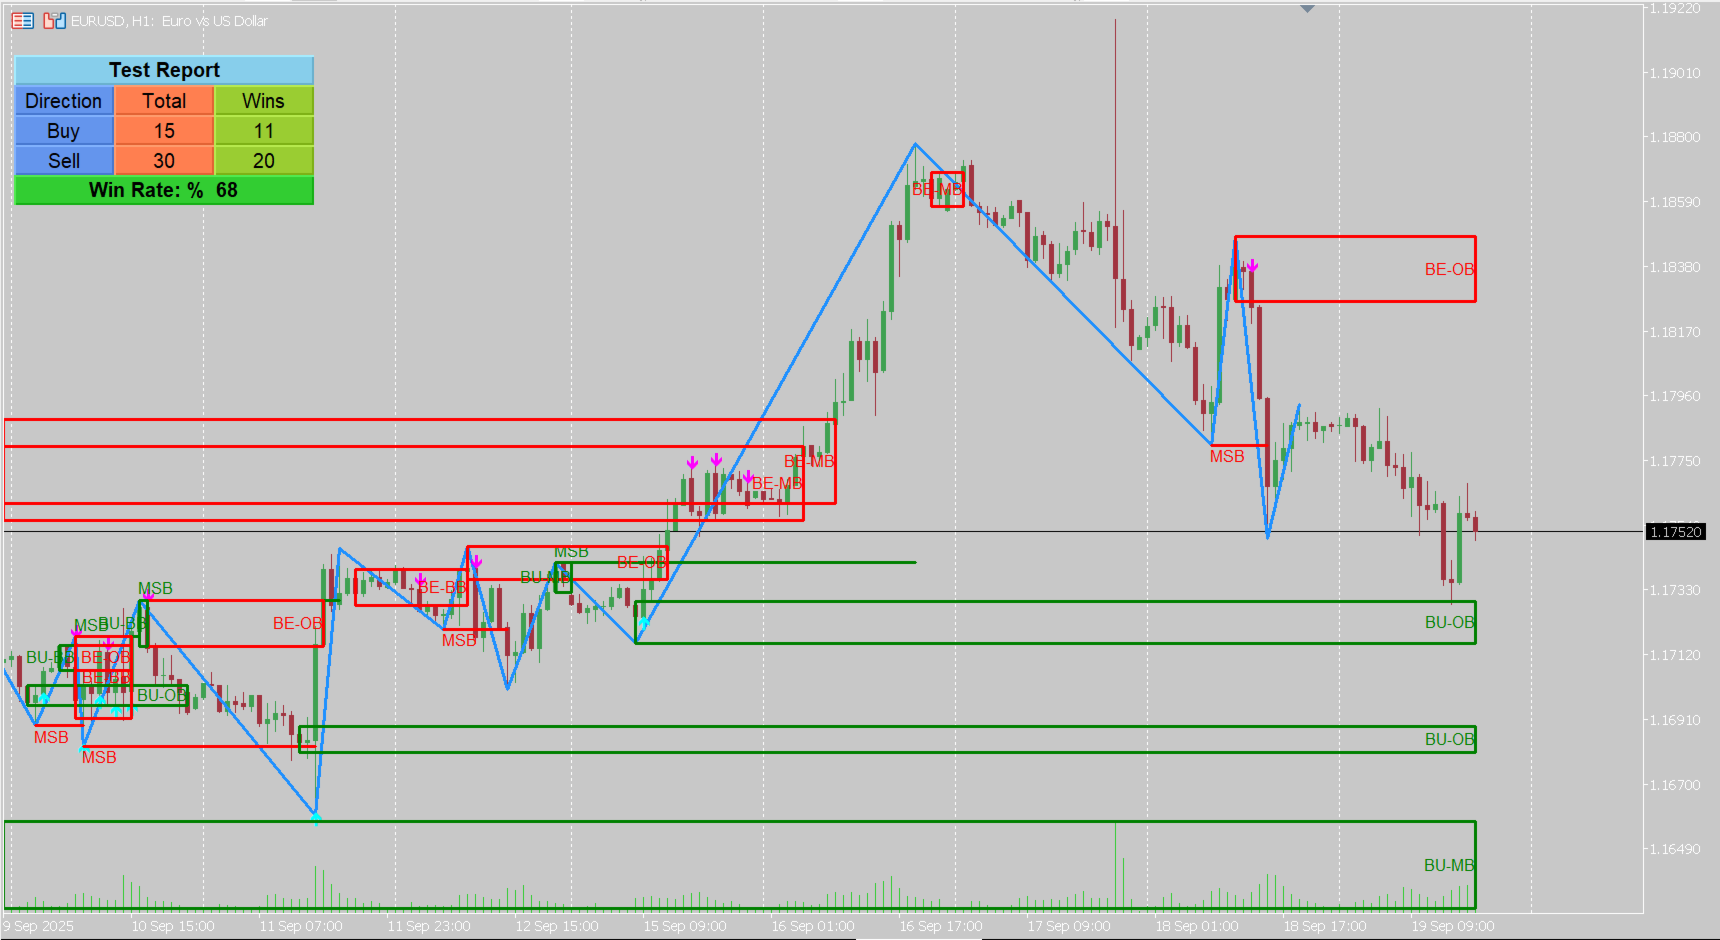
The Market Structure Break & Order Block (MSB-OB) indicator is built to analyze price structure, highlight market structure breaks, and mark order block zones. It also provides buffers for Buy/Sell signals and MSB detection, making it suitable for both manual analysis and automated strategies. A tester panel is included to evaluate performance under different conditions in the Strategy Tester.

Main Concept

  • Market Structure Break (MSB):
    Occurs after price breaks an old high and then forms a lower low, or after price breaks an old low and then forms a higher high.

  • Order Blocks (OB):
    Appear after MSB. If the MSB is bearish, the OB is the last bullish candle before the high. If the MSB is bullish, the OB is the last bearish candle before the low.

  • Breaker and Mitigation Blocks:
    These are blocks formed in the low area before the last high (bearish case) or in the high area before the last low (bullish case). The last bearish candle for bearish, and the last bullish candle for bullish, act as mitigation or breaker blocks.

Features

  • Buy/Sell signal buffers for easy EA integration.

  • MSB buffers for automated detection of structure breaks.

  • Order block, breaker, and mitigation zones displayed directly on the chart.

  • ZigZag-based structure with adjustable parameters.

  • Tester panel to experiment with settings in the Strategy Tester.

  • Fully customizable colors, widths, and label sizes.
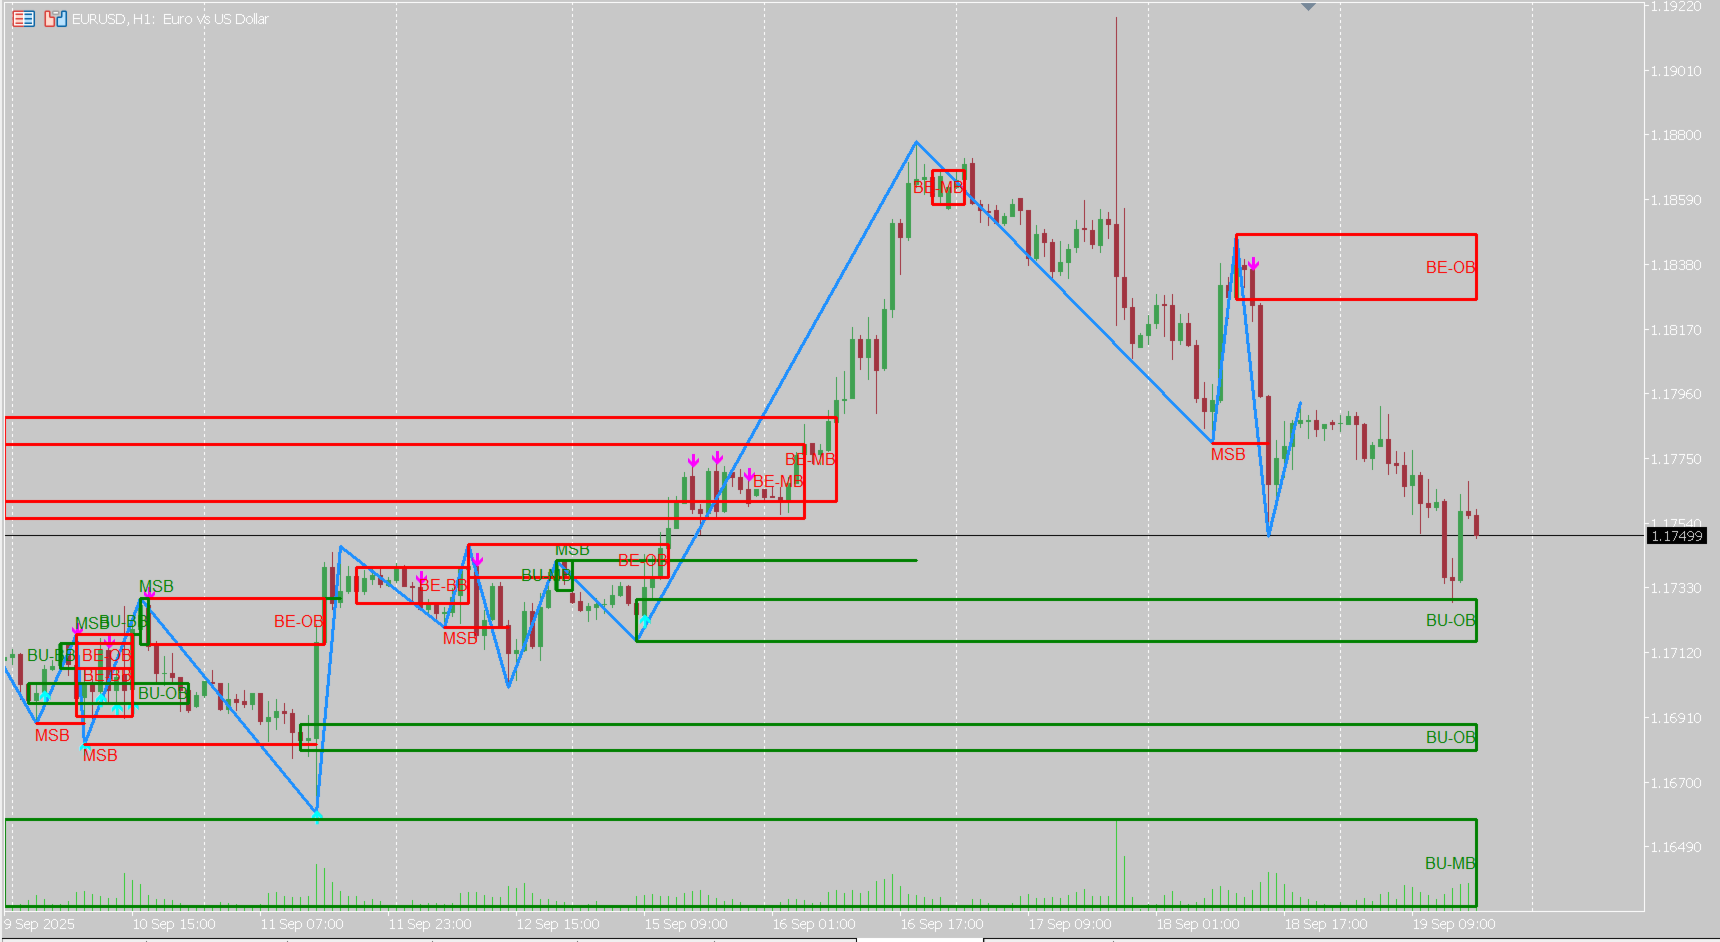
Inputs

  • ZigZag Length – swing point sensitivity.

  • Show ZigZag – option to show or hide ZigZag lines.

  • Fib Factor – fib-level confirmation for breakouts. Example: if a new high is larger than the old high-to-low × (1 + Fib Factor) during a downtrend, then it is considered a breakout.

  • Colors and Styles – order block, breaker block, and MSB visualization.

  • Font Size / Line Width – for labels and lines.

Notes

  • Signal and MSB buffers are available for automation.

  • Tester panel allows performance evaluation under different market conditions.

  • All input parameters, output messages, and descriptions are provided in English.

  • The indicator is intended for analytical use and does not guarantee or promise trading results.


Prodotti consigliati
Ultimate World Clock
Mehdi Ghorbani Saeidian
Every Trader trades in a market zone. If you are not living in the time zone you are trading, you need a clock to show you what time it is in your favorite time zone, and it should be small at the same time to not interrupt your trading process.  In this small indicator, you have access to 3 major clocks around the world, and you can easily look at them. We have some other products that I am sure will help you with your trading career. Please have a look at the link: LINK our all-in-one trading
Slope MA with Tester
Mohammad Taher Halimi Tabrizi
Rule-compliant Description Category: Trend Indicator Platform: MetaTrader 5 Type: Level Indicator Timeframes: All Trader Styles: Scalping, Day Trading, Swing Trading Markets: All Description The Slope MA With Tester is a technical indicator that evaluates the slope of a moving average relative to volatility (ATR). It highlights directional bias through a color-coded slope line and plots entry arrows when slope conditions change. Main features: Slope-based Calculation – The slope of an EMA is nor
KT DMA is a modified and advanced version of the classic Displaced Moving Averages with buy/sell crossover alerts and a Multi-Timeframe scanner that shows DMA's direction across each real-time time frame. A Displaced Moving Average is a simple moving average that moves ahead or backward in a time frame (either short-term or long-term). It also allows you to predict price movement more accurately. Features Depicts the trend direction using the alignment of three moving averages. Buy/Sell signals
Two Pole Oscilator
Mohammad Taher Halimi Tabrizi
Category: Oscillator Indicator Platform: MetaTrader 5 Type: Entry Indicator Timeframes: All Trader Styles: Scalping, Day Trading, Swing Trading, Binary Options Markets: All Description The Two-Pole Oscillator is an analytical tool based on deviation calculations and a two-pole smoothing filter. It is designed to highlight momentum conditions and potential trading signals while filtering out short-term noise. Main features: Two-Pole Filtering – Reduces chart noise for smoother oscillator curves.
The indicator determines a special pattern of Joe Dinapoli. It gives very high probability buy and sell signals. Indicator does not repaint. Indicator Usage Buy Signal ''B'' Entry : Market buy order at signal bar close Stop : Low of signal bar Take Profit : First swing high Sell Signal ''S'' Entry : Market sell order at signal bar close Stop : High of signal bar Take Profit : First swing low Indicator Parameters Fast EMA : External Parameter (should be kept as default) Slow EMA: External Param
M1 Scalper Pro MT5
Elif Kaya
4.64 (11)
- Real price is 80$ - 45% Discount (It is 45$ now) Contact me for extra bonus   indicator, instruction or any questions! - Lifetime update free - Non-repaint - Related product: Gann Gold EA - I just sell my products in Elif Kaya Profile, any other websites are stolen old versions, So no any new updates or support. Advantages of  M1 Scalper Pro  Profitability: M1 Scalper Pro is highly profitable with a strict exit strategy. Frequent Opportunities: M1 Scalper Pro  takes advantage of numerous smal
Questo indicatore è un indicatore per l'analisi automatica delle onde perfetto per il trading pratico! Caso... Nota:   non sono abituato a usare nomi occidentali per la classificazione delle onde a causa dell'influenza della convenzione di denominazione di Tang Lun (Tang Zhong Shuo Zen), ho chiamato l'onda base come   penna   e la banda dell'onda secondaria come   segmento   At allo stesso tempo, il segmento ha la direzione del trend. La denominazione   è principalmente segmento di trend   (que
The Price Tracker Indicator is designed to outline a dynamic price channel, showcasing areas where price movement is typically contained. The indicator highlights potential areas of interest where price may react when approaching the channel limits. Versatile for Scalping and Swing Trading The indicator adapts to all timeframes and can complement various trading strategies. It integrates seamlessly with tools such as supply and demand levels, reversal patterns, and other confluences. Key Feat
Market Structure Break Out MT5
Ashkan Hazegh Nikrou
3 (2)
Presentiamo Market Structure Break Out per MT5 – Il tuo indicatore professionale di MSB e Zona Infrangibile. La versione per MT4 è disponibile anche, controllala qui: https ://www .mql5 .com /en /market /product /109958 Questo indicatore viene continuamente aggiornato. Cerchiamo di fornire punti di ingresso e uscita estremamente precisi basati sulla struttura del mercato. Siamo ora alla versione 1.1, e qui di seguito sono riportate le ultime modifiche se ti unisci a noi ora: Obiettivi di Acquis
- Real price is 80$ - 40% Discount (It is 49$ now) Contact me for instruction, any questions! - Non-repaint - I just sell my products in Elif Kaya Profile, any other websites are stolen old versions, So no any new updates or support. - Lifetime update free Related product: Bitcoin Expert Introduction The Breakout and Retest strategy is traded support and resistance levels. it involves price breaking through a previous level.  The break and retest strategy is designed to help traders do two main
SuperTrendCCI
Volkan Mustafaoglu
The best quality application of the famous Super Trend indicator that requires no introduction. It is completely faithful to the original algorithm and powered by the CCI indicator. - easy to trade - It implements all kinds of warnings. - It implements a multi-timezone dashboard. - It cannot be repainted or backpainted. Input parameters - ATR Period – This is the average true range period. - ATR Multiplier - The ATR multiplier that defines the trend. - CCI - Makes trend following powerful. - M
Check all of our products: LINK Check our best product:   LINK Setting of this Indicator: ** You can choose the indicator width and color from the colors tab 1. Show Moving Average: You can hide any of the moving averages if you want 2. Period Moving Average: The period for the moving average 3. Mode Moving Average: The mode, which can be a simple moving average, exponential, or smoothed Moving Average Trend Indicator for MQL5 is a professional technical analysis tool designed to identify trend
Introduction to Fractal Pattern Scanner Fractal Indicator refers to the technical indicator that makes use of the fractal geometry found in the financial market. Fractal Pattern Scanner is the advanced Fractal Indicator that brings the latest trading technology after the extensive research and development work in the fractal geometry in the financial market. The most important feature in Fractal Pattern Scanner is the ability to measure the turning point probability as well as the trend probabil
Link to our best products: LINK Link to our Trading Dashboard: LINK !!!!!!! Attention, you can find premium discounts by clicking on arrows!!!!!! Setting of this indicator candles mode: Show zones from the beginning Swing number for highs and lows Show background color Color of Premium Color of Discount show level 0% line show level 25% line show level 50% line show level 75% line show level 100% line The Premium and Discount concept is a core principle of Smart Money Concepts (SMC) used to i
Heikin Ashi Heikin Ashi is a charting technique that can be used to predict future price movements. It is similar to traditional candlestick charts. However, unlike a regular candlestick chart, the Heikin Ashi chart attempts to filter out some of the market noise by smoothing out strong price swings to better identify trend movements in the market. To create Heiken Ashi, a formula is used in which price data is entered, while ordinary candles are built only on bare numbers, without using any c
Liquidity Map
Alex Amuyunzu Raymond
Liquidity Map  Overview The Liquidity Map indicator is an advanced visualization tool based on ICT Smart Money Concepts . It automatically identifies daily Buy Zones , Sell Zones , and Liquidity Levels , showing where price is likely to reverse or continue based on institutional order flow. It calculates key levels from the daily session — such as the previous day’s high, low, and midpoint — then derives a premium (sell bias) and discount (buy bias) structure. When price trades into these mapped
Utilities
Douglas Lucio De Araujo
Indicator with 3 features - Clock : Clock independent of the chart, counting continues even when the market is closed. - Template : After setting up a configuration in any graphic, be it color patterns, indicators, zoom ... The configuration will be copied to all active graphics. - TimeFrame : Set the TimeFrame on a chart, and with just one click all the active charts will be changed to the same TimeFrame.
The indicator scans for TD Sequential signals in multiple timeframes for the all markets filtered and shows the results on Dashboard. Key Features Dashboard can be used for all markets It can scan for signals on MN1, W1, D1, H4, H1, M30, M15 ,M5, M1 timeframes Parameters UseMarketWatch: Set true to copy all symbols available in market watch MarketWatchCount : Set the number of symbols that you want to copy from the market watch list. CustomSymbols: Enter the custom symbols that you want to be a
If you are unsure how to use this indicator, please feel free to reach out to me. I will explain it to you and provide reading materials to help you make the most of it. TD Sequential Scanner: An Overview The TD Sequential scanner is a powerful technical analysis tool designed to identify potential price exhaustion points and trend reversals in financial markets. Developed by Tom DeMark, this method is widely used by traders to gauge market cycles and potential turning points with precision. Ho
Smart ZigZag AI
Gianny Alexander Lugo Sanchez
Smart ZigZag AI: Adaptive Market Structure Indicator The traditional ZigZag indicator uses fixed parameters (Depth, Deviation, Backstep) that may not adapt when market volatility changes. Smart ZigZag AI offers an alternative mode that automatically adjusts its internal parameters based on current market conditions. Main differences with traditional ZigZag The adaptive algorithm included in this indicator analyzes volatility in real time and applies dynamic filters to identify structural turning
RoboTick Signal
Mahir Okan Ortakoy
Hello, In this indicator, I started with a simple moving average crossover algorithm. However, in order ot get more succesfull results, I created different scenarios by basin the intersections and aptimized values of the moving averages on opening, closing, high and low values. I am presenting you with the most stable version of the moving averages that you have probably seen in any environment. We added a bit of volume into it. In my opinion, adding the Bollinger Band indicator from the ready-
Contact me for instruction, any questions! - Lifetime update free - Non-repaint - I just sell my products in Elif Kaya Profile, any other websites are stolen old versions, So no any new updates or support. Introduction Breakout Trend Scanner indicator works based on the Elliott Wave in technical analysis describes price movements in the financial market that are related to changes in trader sentiment and psychology and finds end of movement and breakout trend. The Elliott Wave pattern that is f
MACDmaxmin
Carlos Andrés Moya Erazo
3 (2)
The indicator shows when there are overpricing and divergences over a normalized MACD Plus, it displays signals with configurable alerts, self-regulating dynamic overprice levels, and a simple setup and interface. The indicator that automatically calculates overprices ranges! MACDmaxmin is an indicator based on the MACD oscillator that effectively identifies trend changes in price, as it is a momentum indicator that captures the trend and shows the relationship between two moving averages of th
SupportResistence
Eduardo Borges Mariani
SupportResistance is a dynamic support and resistance indicator based on the high and low of the previous candles. The calculation parameters are configurable. You can use the maximum and minimum values of the previous candle as a reference, or you can use the maximum and minimum of a group of previous candles. The indicator uses a red line to indicate resistance and a green line to indicate support. When a support or resistance is broken, its line is dotted, being restored only when it beco
ICT Kill zones
Israr Hussain Shah
ICT Kill zones Professional Automate your ICT & Smart Money analysis with precise, dynamic session tracking and liquidity pivots. Product Description Stop wasting time drawing boxes and lines every single day.   ICT Killzones Professional   is the ultimate session management tool designed specifically for traders utilizing Inner Circle Trader (ICT) concepts, Smart Money Concepts (SMC), and Liquidity-based strategies. This indicator automatically highlights the key trading sessions— Asia, London,
The indicator scans for TD Combo signals in multiple timeframes for the all markets filtered and shows the results on Dashboard. Key Features Dashboard can be used for all markets It can scan for signals on MN1, W1, D1, H4, H1, M30, M15 ,M5, M1 timeframes Parameters UseMarketWatch: Set true to copy all symbols available in market watch MarketWatchCount : Set the number of symbols that you want to copy from the market watch list. CustomSymbols: Enter the custom symbols that you want to be availa
Moving pivot Average Fibonacci The  indicator compares the selected period with its counterpart from the previous period. The indicator determines the moving Fibonacci levels for the day or any time interval to assess the price movement range from the time average. The indicator helps predict the expected high or low for the day based on historical time data. The pivot line can be considered an average trend line and use it in a variety of trading strategies. If you have any question about the
Questo indicatore del dashboard di divergenza multi time frame e multi simbolo invia un avviso quando una o due divergenze diverse sono state identificate su più time frame e non su singole divergenze. Può essere utilizzato con tutte le fasce orarie da M1 a MN. È possibile visualizzare contemporaneamente nella dashboard un massimo di 9 intervalli di tempo. È possibile abilitare il filtro di tendenza della media mobile, dell'RSI o delle bande di Bollinger per filtrare solo le configurazioni più f
Descriptions A point point is a technical analysis indicator, or calculations, used to determine the overall trend of market over different time frames. This indicator calculate the highest or lowest pivots among left x and right y bars and show the high/low level during that period.   From that, you could clearly see the top resistance & bottom support level and how market goes break out. Instructions pivotLeft - pivot left bar count pivotRight - pivot right bar count pivotHighColor - color
Link to our products: LINK The ICT Asian Killzone Indicator delivers a professional, institutional-grade framework by precisely defining the Asian trading session from 00:00 to 04:00 GMT with absolute accuracy. It streamlines market structure analysis by isolating liquidity accumulation, range formation, and volatility compression during the Asian session. Built for serious ICT and Smart Money traders, it enhances strategic decision-making, execution confidence, and Tokyo session directional bi
Gli utenti di questo prodotto hanno anche acquistato
Se acquisti questo indicatore, riceverai il mio Trade Manager Professionale + EA  GRATUITAMENTE. Innanzitutto è importante sottolineare che questo sistema di trading è un indicatore Non-Repainting, Non-Redrawing e Non-Lagging, il che lo rende ideale sia per il trading manuale che per quello automatico. Corso online, manuale e download di preset. Il "Sistema di Trading Smart Trend MT5" è una soluzione completa pensata sia per i trader principianti che per quelli esperti. Combina oltre 10 indicat
Power Candles MT5
Daniel Stein
5 (5)
Power Candles – Segnali di ingresso basati sulla forza per tutti i mercati Power Candles porta l’analisi di forza collaudata di Stein Investments direttamente sul grafico dei prezzi. Invece di reagire solo al prezzo, ogni candela viene colorata in base alla reale forza di mercato, consentendo di identificare immediatamente accumuli di momentum, accelerazioni della forza e transizioni di trend pulite. Un’unica logica per tutti i mercati Power Candles funziona automaticamente su tutti i simboli di
Divergence Bomber
Ihor Otkydach
4.9 (81)
Ogni acquirente dell’indicatore riceverà inoltre gratuitamente: L’utilità esclusiva “Bomber Utility”, che gestisce automaticamente ogni operazione, imposta i livelli di Stop Loss e Take Profit e chiude le posizioni secondo le regole della strategia I file di configurazione (set file) per adattare l’indicatore a diversi asset I set file per configurare il Bomber Utility in tre modalità: “Rischio Minimo”, “Rischio Bilanciato” e “Strategia di Attesa” Una guida video passo-passo per installare, conf
Entry In The Zone and SMC Multi Timeframe è uno strumento di analisi di mercato in tempo reale sviluppato sulla base degli Smart Money Concepts (SMC). È progettato per aiutare i trader ad analizzare la struttura del mercato in modo sistematico e ottenere una visione più chiara della direzione generale del mercato. Il sistema analizza automaticamente i Punti di Inversione, le Zone Chiave e la Market Structure su più timeframe, mostrando Point of Interest (POI), segnali No Repaint e Auto Fibonacci
SuperScalp Pro
Van Minh Nguyen
5 (1)
SuperScalp Pro – Sistema avanzato di indicatore per scalping con filtri multipli SuperScalp Pro è un sistema avanzato di indicatore per scalping che combina il classico Supertrend con molteplici filtri di conferma intelligenti. L’indicatore funziona in modo efficiente su tutti i timeframe da M1 a H4 ed è particolarmente adatto per XAUUSD, BTCUSD e le principali coppie Forex. Può essere utilizzato come sistema stand-alone o integrato in modo flessibile nelle strategie di trading esistenti. L’indi
Azimuth Pro
Ottaviano De Cicco
5 (1)
LAUNCH PROMO Azimuth Pro price is initially set at 299$ for the first 100 buyers. Final price will be 499$ . THE DIFFERENCE BETWEEN RETAIL AND INSTITUTIONAL ENTRIES ISN'T THE INDICATOR — IT'S THE LOCATION. Most traders enter at arbitrary price levels, chasing momentum or reacting to lagging signals. Institutions wait for price to reach structured levels where supply and demand actually shift. Azimuth Pro maps these levels automatically: swing-anchored VWAP, multi-timeframe structure lines, an
Ottieni l’indicatore AUX GRATUITO e il supporto EA Download diretto — Clicca qui [ D.I.C.E ] The DICE Indicator  Divergence in Chaos Environment è uno strumento MT5 specializzato per trader che applicano la Teoria delle Onde di Elliott nel contesto delle tecniche di Trading Chaos. Identifica divergenze nascoste e regolari nell’azione dei prezzi, sincronizzate con l’ambiente di mercato caotico descritto da Bill Williams. Caratteristiche principali Divergenza allineata alle Onde di Elliott: rilev
Atomic Analyst MT5
Issam Kassas
4.07 (28)
Innanzitutto, vale la pena sottolineare che questo indicatore di trading non è repaint, non è ridisegno e non presenta ritardi, il che lo rende ideale sia per il trading manuale che per quello automatico. Manuale utente: impostazioni, input e strategia. L'Analista Atomico è un indicatore di azione del prezzo PA che utilizza la forza e il momentum del prezzo per trovare un miglior vantaggio sul mercato. Dotato di filtri avanzati che aiutano a rimuovere rumori e segnali falsi, e aumentare il pote
Smart Stop Indicator – Precisione intelligente dello stop-loss direttamente sul grafico Panoramica Smart Stop Indicator è la soluzione ideale per i trader che desiderano posizionare il loro stop-loss in modo chiaro e metodico, senza dover indovinare o affidarsi all’intuizione. Questo strumento combina la logica classica del price action (massimi e minimi strutturali) con un moderno riconoscimento dei breakout per identificare il prossimo livello di stop realmente logico. In trend, in range o i
FX Power MT5 NG
Daniel Stein
5 (30)
FX Power: Analizza la Forza delle Valute per Decisioni di Trading Più Intelligenti Panoramica FX Power è lo strumento essenziale per comprendere la reale forza delle principali valute e dell'oro in qualsiasi condizione di mercato. Identificando le valute forti da comprare e quelle deboli da vendere, FX Power semplifica le decisioni di trading e rivela opportunità ad alta probabilità. Che tu segua le tendenze o anticipi inversioni utilizzando valori estremi di Delta, questo strumento si adatta
Trend Screener Pro MT5
STE S.S.COMPANY
4.84 (100)
Indicatore di tendenza, soluzione unica rivoluzionaria per il trading di tendenze e il filtraggio con tutte le importanti funzionalità di tendenza integrate in un unico strumento! È un indicatore multi-timeframe e multi-valuta al 100% non ridipingibile che può essere utilizzato su tutti i simboli/strumenti: forex, materie prime, criptovalute, indici e azioni. Trend Screener è un indicatore di tendenza che segue un indicatore efficiente che fornisce segnali di tendenza a freccia con punti nel gra
Top indicator for MT5   providing accurate signals to enter a trade without repainting! It can be applied to any financial assets:   forex, cryptocurrencies, metals, stocks, indices .  Watch  the video  (6:22) with an example of processing only one signal that paid off the indicator! MT4 version is here It will provide pretty accurate trading signals and tell you when it's best to open a trade and close it. Most traders improve their trading results during the first trading week with the help of
Super Signal – Skyblade Edition Sistema professionale di segnali di tendenza senza repaint / senza ritardo con tasso di vincita eccezionale | Per MT4 / MT5 Funziona meglio su timeframe più bassi, come 1 minuto, 5 minuti e 15 minuti. Caratteristiche principali: Super Signal – Skyblade Edition è un sistema intelligente di segnali progettato specificamente per il trading di tendenza. Utilizza una logica di filtraggio multilivello per identificare esclusivamente i movimenti direzionali forti, supp
L’indicatore evidenzia le zone in cui viene dichiarato interesse sul mercato , per poi mostrare la zona di accumulo degli ordini . Funziona come un book degli ordini su larga scala . Questo è l’indicatore per i grandi capitali . Le sue prestazioni sono eccezionali. Qualsiasi interesse ci sia nel mercato, lo vedrai chiaramente . (Questa è una versione completamente riscritta e automatizzata – non è più necessaria un’analisi manuale.) La velocità di transazione è un indicatore concettualmente nuo
FX Levels MT5
Daniel Stein
5 (12)
FX Levels: Supporti e Resistenze di Precisione Eccezionale per Tutti i Mercati Panoramica Rapida Cercate un modo affidabile per individuare livelli di supporto e resistenza in ogni mercato—coppie di valute, indici, azioni o materie prime? FX Levels fonde il metodo tradizionale “Lighthouse” con un approccio dinamico all’avanguardia, offrendo una precisione quasi universale. Basato sulla nostra esperienza reale con i broker e su aggiornamenti automatici giornalieri più quelli in tempo reale, FX
Innanzitutto, vale la pena sottolineare che questo Strumento di Trading è un Indicatore Non-Ridipingente, Non-Ridisegnante e Non-Laggante, il che lo rende ideale per il trading professionale. Corso online, manuale utente e demo. L'Indicatore Smart Price Action Concepts è uno strumento molto potente sia per i nuovi che per i trader esperti. Racchiude più di 20 utili indicatori in uno solo, combinando idee di trading avanzate come l'Analisi del Trader del Circolo Interno e le Strategie di Tradin
Grabber System MT5
Ihor Otkydach
4.82 (22)
Ti presento un eccellente indicatore tecnico: Grabber, che funziona come una strategia di trading "tutto incluso", pronta all’uso. In un solo codice sono integrati strumenti potenti per l’analisi tecnica del mercato, segnali di trading (frecce), funzioni di allerta e notifiche push. Ogni acquirente di questo indicatore riceve anche gratuitamente: L’utility Grabber: per la gestione automatica degli ordini aperti Video tutorial passo dopo passo: per imparare a installare, configurare e utilizzare
Shock Pullback
Suleiman Alhawamdah
5 (1)
Semplicemente, puoi iniziare a fare trading quando il movimento dei numeri bianchi — noti come "pips" — inizia ad apparire accanto alla candela corrente. I "pips" bianchi indicano che un'operazione di acquisto o vendita è attualmente attiva e si sta muovendo nella direzione corretta, come indicato dal colore bianco. Quando il movimento dei pips bianchi si interrompe e diventa di colore verde statico, questo segnala la fine della spinta attuale. Il colore verde dei numeri rappresenta il profitto
Market Structure Patterns
Samuel Manoel De Souza
4.47 (19)
Disponibile per   MT4   e   MT5 . Unisciti al canale Market Structure Patterns per scaricare materiale di studio e/o informazioni aggiuntive. Pubblicazioni correlate: Market Structure Patterns - Introduzione Acquistalo ora con 50% di sconto | Prezzo precedente $90 | Offerta valida fino al 31 dicembre | Un importante aggiornamento è in arrivo e il prezzo originale verrà adeguato. Market Structure Patterns   è un indicatore basato sui   Smart Money Concepts   che mostra gli   elementi SMC/ICT  
Quantum TrendPulse
Bogdan Ion Puscasu
5 (20)
Ecco   Quantum TrendPulse   , lo strumento di trading definitivo che combina la potenza di   SuperTrend   ,   RSI   e   Stocastico   in un unico indicatore completo per massimizzare il tuo potenziale di trading. Progettato per i trader che cercano precisione ed efficienza, questo indicatore ti aiuta a identificare con sicurezza le tendenze di mercato, i cambiamenti di momentum e i punti di entrata e uscita ottimali. Caratteristiche principali: Integrazione SuperTrend:   segui facilmente l'andame
IX Power MT5
Daniel Stein
4.92 (12)
IX Power: Scopri approfondimenti di mercato per indici, materie prime, criptovalute e forex Panoramica IX Power è uno strumento versatile progettato per analizzare la forza di indici, materie prime, criptovalute e simboli forex. Mentre FX Power offre la massima precisione per le coppie di valute utilizzando i dati di tutte le coppie disponibili, IX Power si concentra esclusivamente sui dati di mercato del simbolo sottostante. Questo rende IX Power una scelta eccellente per mercati non correlat
ARIScalping
Temirlan Kdyrkhan
ARIScalp is a powerful trading companion designed to generate high-probability entry signals with dynamic TP/SL/DP levels based on volatility. Built-in performance tracking shows win/loss stats, PP1/PP2 hits, and success rates all updated live. Key Features: Buy/Sell signals with adaptive volatility bands Real-time TP/SL/DP levels based on ATR Built-in MA Filter with optional ATR/StdDev volatility Performance stats panel (Success, Profit/Loss, PP1/PP2) Alerts via popup, sound, push, or email Cus
ARICoins
Temirlan Kdyrkhan
ARICoin is a powerful trading companion designed to generate high-probability entry signals with dynamic TP/SL/DP levels based on volatility. Built-in performance tracking shows win/loss stats, PP1/PP2 hits, and success rates all updated live. Key Features: Buy/Sell signals with adaptive volatility bands Real-time TP/SL/DP levels based on ATR Built-in MA Filter with optional ATR/StdDev volatility Performance stats panel (Success, Profit/Loss, PP1/PP2) Alerts via popup, sound, push, or email Cust
Gold Sniper Scalper Pro
Ich Khiem Nguyen
3.5 (8)
Gold Sniper Scalper Pro è un indicatore professionale per MetaTrader 5, progettato per supportare i trader nell'identificare punti di ingresso e gestire il rischio in modo efficace. L'indicatore fornisce un set completo di strumenti analitici che include un sistema di rilevamento dei segnali, gestione automatica di Entry/SL/TP, analisi del volume e statistiche delle performance in tempo reale. Guida utente per comprendere il sistema   |   Guida utente per altre lingue CARATTERISTICHE PRINCIPALI
FX Dynamic MT5
Daniel Stein
5 (5)
FX Dynamic: Monitora volatilità e trend con un’analisi ATR personalizzabile Panoramica FX Dynamic è uno strumento potente che sfrutta i calcoli di Average True Range (ATR) per fornire ai trader informazioni impareggiabili sulla volatilità, sia giornaliera che intraday. Impostando soglie di volatilità chiare—ad esempio 80%, 100%, 130%—puoi individuare rapidamente opportunità di profitto o ricevere avvisi quando il mercato supera i range abituali. FX Dynamic si adatta al fuso orario del tuo brok
PZ Swing Trading MT5
PZ TRADING SLU
5 (5)
Protect against whipsaws: revolutionize your swing trading approach Swing Trading is the first indicator designed to detect swings in the direction of the trend and possible reversal swings. It uses the baseline swing trading approach, widely described in trading literature. The indicator studies several price and time vectors to track the aggregate trend direction and detects situations in which the market is oversold or overbought and ready to correct. [ Installation Guide | Update Guide | Tro
Introduction to X3 Chart Pattern Scanner X3 Cherart Pattern Scanner is the non-repainting and non-lagging indicator detecting X3 chart patterns including Harmonic pattern, Elliott Wave pattern, X3 patterns, and Japanese Candlestick patterns. Historical patterns match with signal patterns. Hence, you can readily develop the solid trading strategy in your chart. More importantly, this superb pattern scanner can detect the optimal pattern of its kind. In addition, you can switch on and off individu
Trend Forecaster
Alexey Minkov
5 (7)
The Trend Forecaster indicator utilizes a unique proprietary algorithm to determine entry points for a breakout trading strategy. The indicator identifies price clusters, analyzes price movement near levels, and provides a signal when the price breaks through a level. The Trend Forecaster indicator is suitable for all financial assets, including currencies (Forex), metals, stocks, indices, and cryptocurrencies. You can also adjust the indicator to work on any time frames, although it is recommen
Trend indicator AI mt5
Ramil Minniakhmetov
5 (13)
Trend Ai indicator è un ottimo strumento che migliorerà l'analisi di mercato di un trader combinando l'identificazione della tendenza con punti di ingresso utilizzabili e avvisi di inversione. Questo indicatore consente agli utenti di navigare nelle complessità del mercato forex con fiducia e precisione Oltre ai segnali primari, l'indicatore Ai di tendenza identifica i punti di ingresso secondari che si presentano durante i pullback o i ritracciamenti, consentendo ai trader di capitalizzare le
Support And Resistance Screener è in un indicatore di livello per MetaTrader che fornisce più strumenti all'interno di un indicatore. Gli strumenti disponibili sono: 1. Screener della struttura del mercato. 2. Zona di ritiro rialzista. 3. Zona di ritiro ribassista. 4. Punti pivot giornalieri 5. Punti pivot settimanali 6. Punti pivot mensili 7. Forte supporto e resistenza basati sul modello e sul volume armonici. 8. Zone a livello di banca. OFFERTA A TEMPO LIMITATO: il supporto HV e l'indicatore
Altri dall’autore
UT Bot Alerts MT5
Mohammad Taher Halimi Tabrizi
5 (2)
This indicator is converted from UT Bot alerts indicator by @QuantNomad of Trading View to MT5. its considering ATR and creating new candles on chart and also is giving good entry points based on its candles. all buffers of new candles and also entry signals are included as buffer so can be used easily on any EA. there are also some different strategies on the internet that can be used or contact me to create it for you.
Heiken Ashi Smoothed MT5
Mohammad Taher Halimi Tabrizi
Heiken Ashi Smoothed – The Ultimate Trend Filtering Indicator for MT5   Enhance Your Trading with Smoother Trends!   The Heiken Ashi Smoothed indicator is a powerful tool designed for traders who want clearer trend signals while eliminating market noise. Unlike traditional Heiken Ashi candles, this smoothed version provides fluid, lag-free price action , making it perfect for swing trading, trend following, and long-term analysis. Key Features: Crystal-Clear Trends – Filters out market noise for
Best Renko Chart Generator
Mohammad Taher Halimi Tabrizi
5 (1)
This is the Best Renko chart generator ever in the market you can set the box sizes based on ATR or Fixed Size: 1. Fixed Box Size 2. Current ATR Size 3. ATR size of the Chart Start Time. also you can set the Renko chart cut of date and time to start as reference of creating renko charts. you need to attach to a symbol chart that want the renko chart of it, then immediately a new chart will be opened which is based on renko, you can use this generated chart and attach your EA to trade on or you e
Binance Chart
Mohammad Taher Halimi Tabrizi
Product Description: Effortlessly bridge the gap between Binance and MetaTrader 5 with this sleek integration tool. Designed for traders who demand precision and real-time data, this product fetches live Binance chart information directly into MT5, enabling seamless technical analysis and strategy execution. Whether you're tracking candlestick patterns or refining your forex indicators, this tool ensures your MT5 environment stays synced with the crypto market pulse. Getting Started: Place the
FREE
Two Pole Oscilator
Mohammad Taher Halimi Tabrizi
Category: Oscillator Indicator Platform: MetaTrader 5 Type: Entry Indicator Timeframes: All Trader Styles: Scalping, Day Trading, Swing Trading, Binary Options Markets: All Description The Two-Pole Oscillator is an analytical tool based on deviation calculations and a two-pole smoothing filter. It is designed to highlight momentum conditions and potential trading signals while filtering out short-term noise. Main features: Two-Pole Filtering – Reduces chart noise for smoother oscillator curves.
Madrid Ribbon
Mohammad Taher Halimi Tabrizi
Category: Trend Indicator Platform: MetaTrader 5 Type: Level Indicator Timeframes: All Trader Styles: Scalping, Day Trading, Swing Trading Markets: All Description The Madrid Ribbon is a moving average–based trend visualization tool. It combines multiple exponential or simple moving averages into a ribbon structure that adapts to market changes. The indicator highlights trend direction, possible reentry zones, and areas where reversals may occur. Main features: Dynamic Trend Display – Multiple m
Optimized Trend Tracker OTT
Mohammad Taher Halimi Tabrizi
Optimized Trend Tracker (OTT) Indicator The Optimized Trend Tracker (OTT) is a custom indicator designed to visualize trend direction and potential changes based on a configurable moving average and dynamic support/resistance levels. It provides multiple visualization and signal options, making it suitable for discretionary analysis or integration into automated systems. Key Features Configurable Moving Average Types Supports SMA, EMA, WMA, TMA, VAR, WWMA, ZLEMA, and TSF for flexible calculatio
CandleStick Patterns Indicator for MT5 — Professional Pattern Scanner Bring proven candlestick analysis into your workflow. This indicator automatically scans your chart and highlights high-quality reversal and continuation patterns, so you can react faster and with more confidence. Check the “More from author” section on the Market page to see our full suite of indicators. What it does Scans historical and live candles from a user-defined lookback range. Detects and labels major single- and m
Magic Moving Indicator
Mohammad Taher Halimi Tabrizi
This is a very powerful indicator which is very useful in trend detection the way is used is similar to moving average but giving very reliable results. principle is very easy, that depicts a mobile support and resistance line when the price is below the orange line the trend is bearish and the line act as resistance and as soon as the resistance is broken and price is above the line then the trend becomes bullish and the line changes into the support line. this can be used in any time frames. i
ATR Stops
Mohammad Taher Halimi Tabrizi
ATR Stops is an indicator which shows Dynamic support and resistance lines by considering ATR value and also a multiplier. its highly effective to find out the trend direction and also is useful for using as stop loss levels. it could be used in different ways one usual way is to buy when line becomes green and sell when it becomes red. when its combined with money management rules and risk reward considerations there is good results.
PP Super Trend MT4
Mohammad Taher Halimi Tabrizi
Pivot Point Super Trend is another type of famous super trend indicator which is equipped with pivot points in different way. this indicator used to be available in the Trading view and this is converted from there to the MT4 language. MT5 version of the indicator is also available and you can find in my products. there are also buy/sell signals shown on the screen.
SuperTrend Kivanc Ozbilgic
Mohammad Taher Halimi Tabrizi
Here is another version of famous Super Trend indicators which is modified by Kivanc Ozbilgic. I have get the code from Trading View and converted it to MT4 language. this is great opportunity for Trading View users who want to migrate to MT4 so can test this indicator and also make their custom EAs based on it. there are much more inputs than standard super trend also there are up/down arrows with alarms as well.
QQE MOD of Trading View 4
Mohammad Taher Halimi Tabrizi
The QQE indicator is a momentum-based indicator used to identify trends and sideways. The Qualitative Quantitative Estimate (QQE) indicator works like a smoothed version of the popular Relative Strength Index (RSI) indicator. QQE extends the RSI by adding two volatility-based trailing stops. This indicator is converted from Trading View QQE MOD by Mihkel00 to be used in MT4 Version.
Super Trend Trading View 4
Mohammad Taher Halimi Tabrizi
The SuperTrend indicator is a popular technical analysis tool used by traders and investors to identify trends in the price of a financial instrument, such as a stock, currency pair, or commodity. It is primarily used in chart analysis to help traders make decisions about entering or exiting positions in the market. this version of super trend indicator is exactly converted from trading view to be used in MT4
Angel Algo MT4
Mohammad Taher Halimi Tabrizi
The "Angel Algo" indicator, designed for the TradingView platform, is a powerful technical analysis tool that assists traders in identifying dynamic support and resistance levels in real-time. It provides valuable insights into potential breakout points and market regimes. At its core, the "Angel Algo" indicator utilizes a rolling window of price data to calculate maximum and minimum price levels. It then dynamically identifies support and resistance levels by examining specific conditions rela
ATR Stops MT5
Mohammad Taher Halimi Tabrizi
ATR Stops is an indicator which shows Dynamic support and resistance lines by considering ATR value and also a multiplier. its highly effective to find out the trend direction and also is useful for using as stop loss levels. it could be used in different ways one usual way is to buy when line becomes green and sell when it becomes red. when its combined with money management rules and risk reward considerations there is good results.
PP Super Trend MT5
Mohammad Taher Halimi Tabrizi
Pivot Point Super Trend is another type of famous super trend indicator which is equipped with pivot points in different way. this indicator used to be available in the Trading view and this is converted from there to the MT5 language. MT4 version of the indicator is also available and you can find in my products. there are also buy/sell signals shown on the screen.
Schaff Trend Cycle STC
Mohammad Taher Halimi Tabrizi
The Schaff Trend Cycle indicator is the product of combining Slow Stochastics and the moving average convergence/divergence (MACD). The MACD has a reputation as a trend indicator, but it's also notorious for lagging due to its slow responsive signal line. The improved signal line gives the STC its relevance as an early warning sign to detect currency trends. this indicator is converted from Trading View code of STC Indicator - A Better MACD [SHK]
HIGH and LOW OTT
Mohammad Taher Halimi Tabrizi
This product is converted form Trading View of Kivanc Ozbilgic to be used on MT5 and below are descriptions of developer on Trading View: Anıl Özekşi's latest development on his precious OTT - Optimized Trend Tracker: In this version, there are two lines of OTT which are derived from HIGHEST price values (HOTT) and LOVEST price values (LOTT) which were originally sourced to CLOSE values on default OTT. Another significant difference is there is no Support Line (Moving Average) in this version
Stock Trend Navigator
Mohammad Taher Halimi Tabrizi
In the fast-paced and ever-evolving world of stock trading, having a reliable compass is essential for navigating the complexities of the financial markets. Meet the Stock Trade Navigator, your trusted partner in the quest for investments. Unlock the Power of Data: Our Stock Trade Navigator is not just a tool; it's your data-driven co-pilot. Harnessing cutting-edge algorithms and real-time market data, it empowers you with a comprehensive view of the financial landscape, enabling you to make inf
QQE MOD of Trading View 5
Mohammad Taher Halimi Tabrizi
The QQE indicator is a momentum-based indicator used to identify trends and sideways. The Qualitative Quantitative Estimate (QQE) indicator works like a smoothed version of the popular Relative Strength Index (RSI) indicator. QQE extends the RSI by adding two volatility-based trailing stops. This indicator is converted Qfrom Trading View QQE MOD by Mihkel00 to be used in MT5 Version.
Super Trend Trading View 5
Mohammad Taher Halimi Tabrizi
The SuperTrend indicator is a popular technical analysis tool used by traders and investors to identify trends in the price of a financial instrument, such as a stock, currency pair, or commodity. It is primarily used in chart analysis to help traders make decisions about entering or exiting positions in the market. this version of super trend indicator is exactly converted from trading view to be used in MT5
MT5 Trades To Telegram
Mohammad Taher Halimi Tabrizi
The Trades To Telegram is a powerful and customizable trading assistant designed to bridge the gap between the MetaTrader 5 platform and the popular messaging app, Telegram. This bot serves as a crucial tool for traders, providing them with timely and accurate trading signals, alerts, and updates directly to their Telegram accounts. Key Features: Real-Time Signals: The bot monitors the MetaTrader 5 platform continuously, detecting trading signals, such as Opening/Closing of  buy/sell orders , a
Angel Algo MT5
Mohammad Taher Halimi Tabrizi
The "Angel Algo" indicator, designed for the TradingView platform, is a powerful technical analysis tool that assists traders in identifying dynamic support and resistance levels in real-time. It provides valuable insights into potential breakout points and market regimes. At its core, the "Angel Algo" indicator utilizes a rolling window of price data to calculate maximum and minimum price levels. It then dynamically identifies support and resistance levels by examining specific conditions rela
Linear Regression Line
Mohammad Taher Halimi Tabrizi
What is Linear Regression? Linear regression is a statistical method used to model the relationship between price and time. In forex trading, it helps traders identify trends, potential reversals, and areas of support and resistance. Uses of Linear Regression in Forex Trading Trend Identification The regression line acts as a dynamic trendline, showing whether the market is trending upward or downward. Traders can use the slope of the regression line to measure trend strength. Support and Resist
Range Detector by LuxAlgo
Mohammad Taher Halimi Tabrizi
This indicator is converted from Pinescript to MQL5 and consisting of buffers for the range lines as well, its not only object. The Range Detector indicator aims to detect and highlight intervals where prices are ranging. The extremities of the ranges are highlighted in real-time, with breakouts being indicated by the color changes of the extremities.   USAGE Ranging prices are defined by a period of stationarity, that is where prices move within a specific range. Detecting ranging marke
Smart FVG Levels Indicator for MT5
Mohammad Taher Halimi Tabrizi
Smart FVG Levels Indicator for MT5   Category   Platform Level   Type     Time frames   trader style market   ICT SMC Indicator Meta Trader 5 Level Indicator Level Indicator All Time frames Scalpers  Day Traders  Swing Traders  Position Traders All Type of Markets Introduction The Smart FVG Levels Indicator for MT5 is a powerful trading tool designed to help you identify Fair Value Gaps (FVGs) automatically on your charts. Whether you are a beginner or an experienced trader, this ind
Better RSI With Tester
Mohammad Taher Halimi Tabrizi
Category: Trend Indicator Platform: MetaTrader 5 Type: Entry Indicator Timeframes: All Trader Styles: Scalping, Day Trading, Swing Trading, Binary Options Markets: All Description This indicator is an enhanced version of the Relative Strength Index (RSI) with additional features for visual clarity and cycle detection. It is designed to provide traders with a clearer view of momentum conditions and potential turning points. Main features: Improved RSI Visualization – The indicator displays RSI va
Slope MA with Tester
Mohammad Taher Halimi Tabrizi
Rule-compliant Description Category: Trend Indicator Platform: MetaTrader 5 Type: Level Indicator Timeframes: All Trader Styles: Scalping, Day Trading, Swing Trading Markets: All Description The Slope MA With Tester is a technical indicator that evaluates the slope of a moving average relative to volatility (ATR). It highlights directional bias through a color-coded slope line and plots entry arrows when slope conditions change. Main features: Slope-based Calculation – The slope of an EMA is nor
Squeeze momentum Indicator for MT5
Mohammad Taher Halimi Tabrizi
The Smart Squeeze Momentum Indicator MT5 is a powerful trading tool that helps traders identify periods of market contraction, expansion, and potential trend reversals . Built on the proven concepts of Bollinger Bands and Keltner Channels , this indicator detects “squeeze” conditions and provides a clear momentum histogram along with buy and sell trading signals . Key Features Momentum Histogram – Visualizes the strength and direction of market momentum. Squeeze Detection – Identifies low-vol
Filtro:
Nessuna recensione
Rispondi alla recensione