Pivot Point Supertrend MT5
- Indicatori
- Quang Huy Quach
- Versione: 1.20
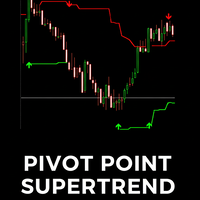
The Pivot Point Supertrend indicator is a technical analysis tool designed for the MetaTrader 5 (MT5) platform. It combines two popular analytical methods:
- Pivot Points: Uses significant historical price highs and lows to identify potential support and resistance zones. These points are objective and stable.
- Supertrend: A well-known trend-following indicator that helps identify the current market trend and provides dynamic stop-loss levels.
Indicator's Goal: By using the stability of Pivot Points as a foundation for the Supertrend calculation, this indicator filters out market noise, identifies trends more smoothly, and provides clear trading signals.
Installation Guide
- Get the indicator file: You will have a file named PivotPointSupertrend.ex5 .
- Open the MT5 Data Folder: In the MT5 platform, go to File -> Open Data Folder .
- Copy the file: Open the MQL5 folder, then open the Indicators folder. Copy the PivotPointSupertrend.ex5 file here.
- Refresh MT5: Return to the MT5 platform. In the "Navigator" window (usually on the left), right-click on "Indicators" and select "Refresh".
- Usage: The PivotPointSupertrend indicator will now appear in the list. Simply drag and drop it onto the chart you wish to analyze.
Explanation of Input Parameters (Inputs Tab)
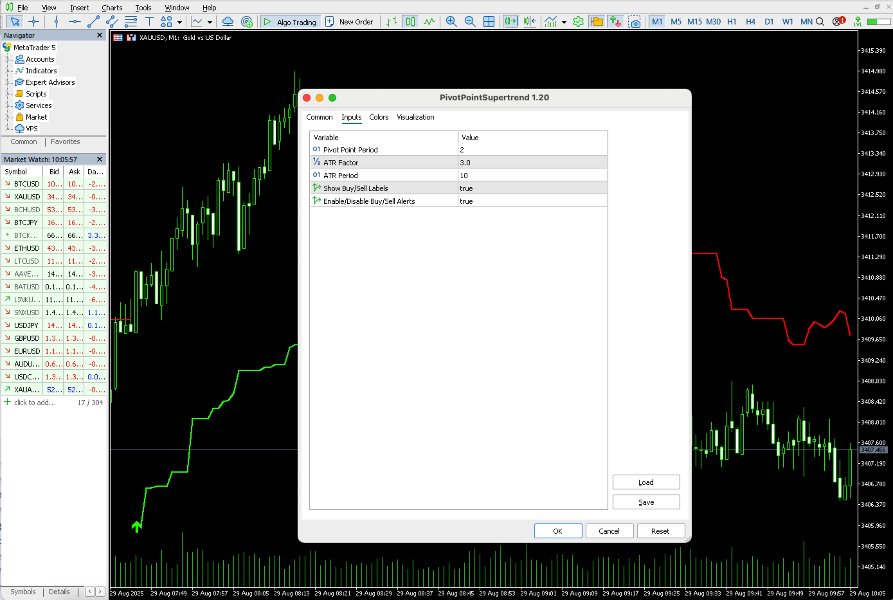
When you drag the indicator onto a chart, a window will appear. In the "Inputs" tab, you can customize the following parameters:
-
Pivot Point Period (prd) :
- Meaning: The sensitivity for identifying a peak/trough as a Pivot Point.
- Usage: A higher value will cause the indicator to find more significant and obvious peaks/troughs, making the trendline smoother and less reactive. A lower value will make the indicator more sensitive to minor price fluctuations.
- Default: 2
-
ATR Factor (Factor) :
- Meaning: The multiplier for the ATR (Average True Range) value. This determines the width of the Supertrend band relative to the center line.
- Usage: A larger Factor will place the Supertrend line further from the price, helping you ride through minor corrections in a major trend, but it will signal reversals later. A smaller Factor provides more sensitive signals but is more prone to noise.
- Default: 3.0
-
ATR Period (Pd) :
- Meaning: The number of periods used to calculate the Average True Range (ATR) volatility measure.
- Default: 10
-
Show Buy/Sell Labels (showlabel) :
- Meaning: Toggles the visibility of the Buy and Sell signal arrows on the chart.
- Default: true (On)
-
Enable Alerts (showAlerts) :
- Meaning: Toggles the pop-up/sound alerts when a new Buy/Sell signal appears.
- Default: true (On)
HOW TO READ THE INDICATOR
On-Chart Components
-
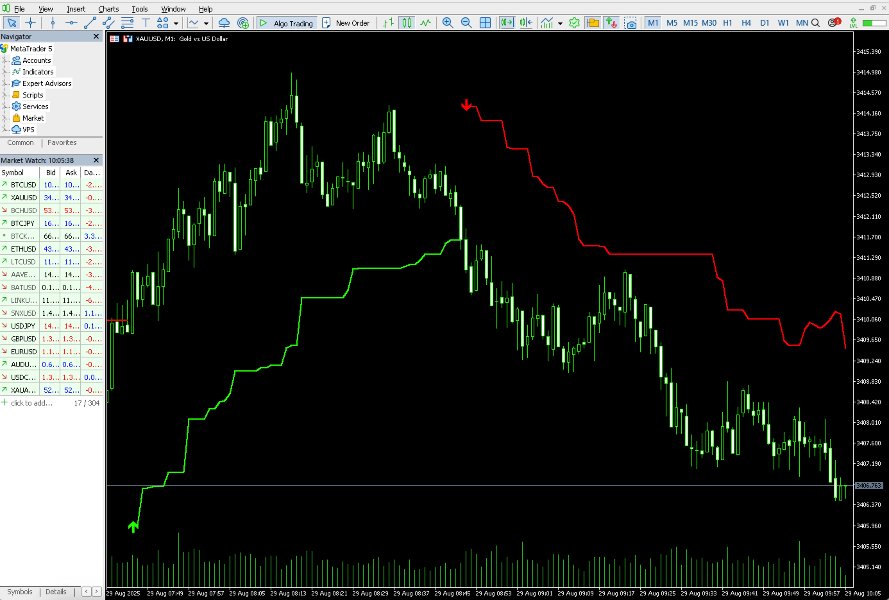
Lime Green Trendline:
- Indicates the market is in an UPTREND.
- During this time, the line acts as a dynamic support level. The price tends to stay above this line.
-
Red Trendline:
- Indicates the market is in a DOWNTREND.
- During this time, the line acts as a dynamic resistance level. The price tends to stay below this line.
-
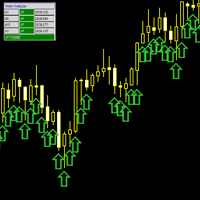
"Buy" Arrow (Green, pointing up):
- Appears when the trendline flips from Red to Green.
- This is a potential buy signal, suggesting the downtrend has ended and an uptrend is beginning.
-
"Sell" Arrow (Red, pointing down):
- Appears when the trendline flips from Green to Red.
- This is a potential sell signal, suggesting the uptrend has ended and a downtrend is beginning.
APPLIED TRADING STRATEGIES
Disclaimer: No indicator is perfect. The following strategies are for reference only and should be combined with proper risk management and other analytical methods.
Trend Following Strategy
This is the most basic and direct way to use the indicator.
-
Entry Signals:
- Long Entry: Enter a BUY order when a green "Buy" arrow appears.
- Short Entry: Enter a SELL order when a red "Sell" arrow appears.
-
Stop-Loss Placement:
- For a Long position: Place the stop-loss just below the green Supertrend line.
- For a Short position: Place the stop-loss just above the red Supertrend line.
- Trailing Stop: A major advantage of the Supertrend is that you can use the line itself as a dynamic trailing stop. As an uptrend continues, the green line will move up. You can move your stop-loss up accordingly to protect profits.
-
Take-Profit Placement:
- Method 1 (Opposite Signal): Hold the trade until an opposite signal appears (e.g., you are in a BUY trade, exit when a "Sell" arrow appears).
- Method 2 (Risk/Reward Ratio): Define a fixed Risk/Reward ratio, such as 1:1.5 or 1:2.
- Method 3 (Support/Resistance Levels): Identify key resistance levels (for a BUY trade) or support levels (for a SELL trade) on the chart to set your take-profit target.
Suggestions for Confluence
To increase the probability of success, consider signals from the Pivot Point Supertrend in conjunction with:
- Volume Analysis: A Buy/Sell signal accompanied by a spike in trading volume is more reliable.
- Price Action: Look for confirming candlestick patterns at the signal point. For example, a "Buy" signal is stronger if it's accompanied by a Bullish Engulfing candle.
- Multi-Timeframe Analysis: Always check the trend on a higher timeframe. For instance, if you are trading on the H1 chart, check the trend on the H4 or D1 chart. You should only take BUY trades on H1 if the main trend on H4 is also up.
