GEN Ichimoku Signal
- Indicatori
- Gede Egi Narditya
- Versione: 1.0
GEN Ichimoku Signal
Developer: gedeegi
Overview
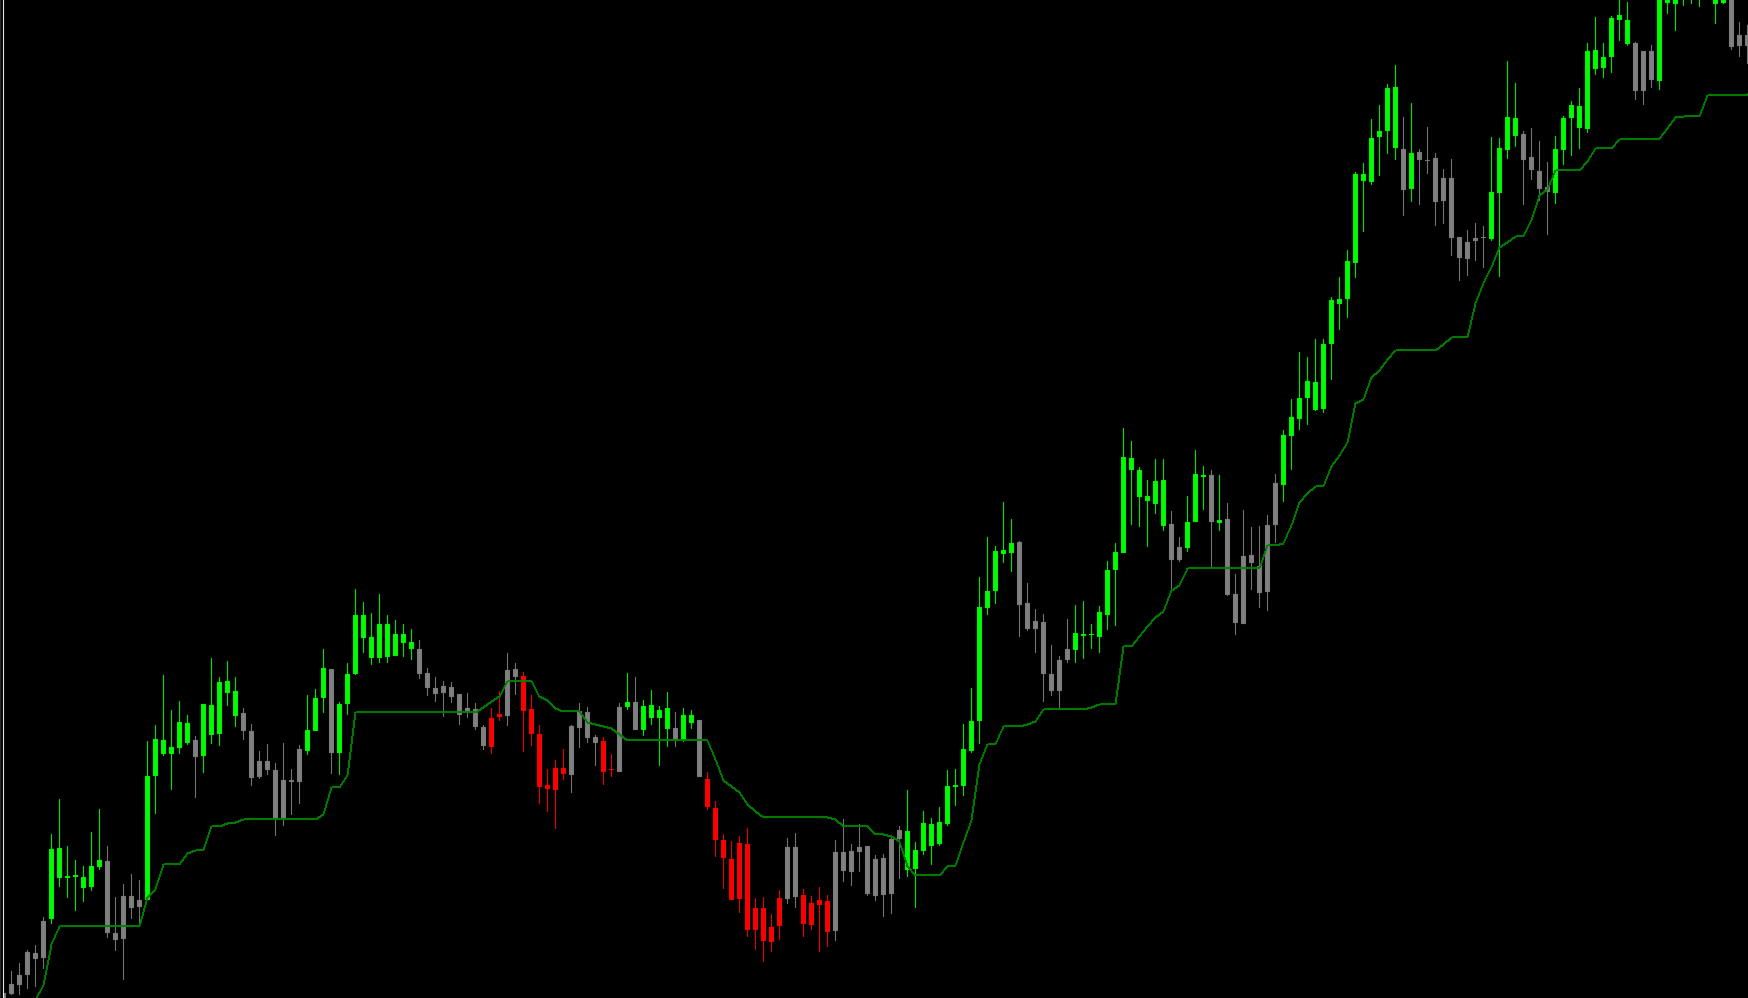
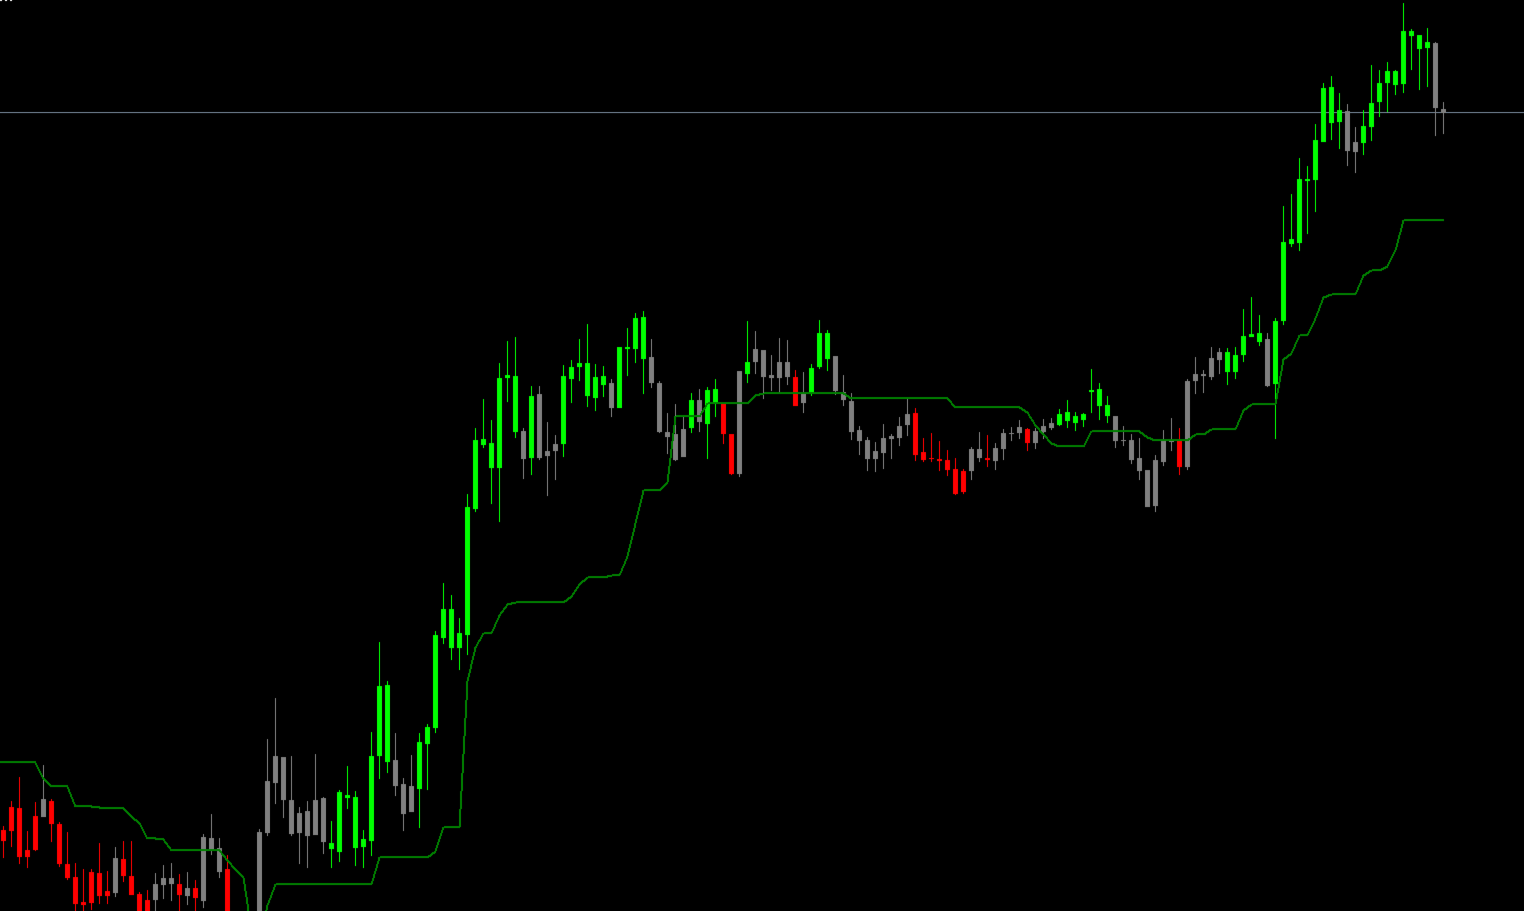
GEN Ichimoku Signal is a technical indicator for the MetaTrader 5 platform. It combines two different trend analysis systems, Ichimoku Kinko Hyo and HalfTrend, into a single visual tool. The primary function of the indicator is to color the chart's candlesticks based on whether the conditions of these two systems are in alignment.
The indicator provides a visual representation of market conditions by displaying one of three colors: one for aligned bullish conditions, one for aligned bearish conditions, and another for when the systems are not aligned. This is intended to serve as an analytical aid for traders.
Features
- Combined Signal Logic: Uses signals from both the Ichimoku system (Tenkan-sen / Kijun-sen crossover) and the HalfTrend indicator to determine the final output.
- Conditional Candlestick Coloring: The main feature is the coloring of chart candles to reflect the alignment status of the two systems. A specific color is shown only when both systems agree on the market direction.
- On-Chart Lines: Plots the Ichimoku Kijun-sen (Base Line) and the HalfTrend line directly on the price chart. These lines serve as visual reference points.
- Neutral Condition Filter: A neutral color is used for candles when the Ichimoku and HalfTrend signals are conflicting. This visual cue highlights periods of market indecision or consolidation.
Calculation Logic
The color of each candlestick is determined by the following set of rules:
- Bullish Condition (Green Candle): A candle is colored green only if both of the following conditions are met simultaneously:
- The close price is above the HalfTrend line.
- The Ichimoku Tenkan-sen value is above the Kijun-sen value.
- Bearish Condition (Red Candle): A candle is colored red only if both of the following conditions are met simultaneously:
- The close price is below the HalfTrend line.
- The Ichimoku Tenkan-sen value is below the Kijun-sen value.
- Neutral Condition (Gray Candle): If the bullish or bearish conditions are not fully met (i.e., the two systems are not in agreement), the candle is colored gray.
Ichimoku Settings
- Conversion Periods: The calculation period for the Tenkan-sen (Conversion Line).
- Base Periods: The calculation period for the Kijun-sen (Base Line).
HalfTrend Settings
- Amplitude: The main calculation period used by the HalfTrend algorithm.
- Channel Deviation: A parameter for the channel calculation within the HalfTrend logic.
Interpreting the Indicator's Visuals
- Green Candles: A green candle indicates that, based on the indicator's settings, the conditions for an upward trend from both the Ichimoku and HalfTrend systems are met and aligned.
- Red Candles: A red candle indicates that the conditions for a downward trend from both systems are met and aligned.
- Gray Candles: A gray candle indicates a lack of alignment between the two systems. This may represent consolidation, conflicting signals, or neutral market conditions.
- Plotted Lines: The Kijun-sen and HalfTrend lines on the chart can be used as dynamic reference levels for price analysis.
Note: This indicator is a tool for technical analysis. Users should apply their own trading strategy and risk management. Past performance is not indicative of future results.