Volume and Pips Change HeatMap
- Utilità
- Versione: 1.8

HeatMap – Volume & Pips Change Analyzer for MT5
The HeatMap indicator for MetaTrader 5 is a powerful and interactive tool designed to help traders identify the most active and volatile trading hours across the last 14 days.
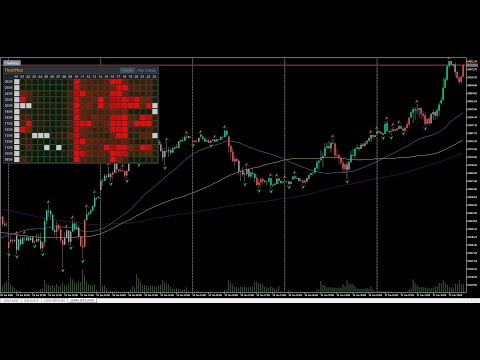
By default, the indicator starts as a simple floating button labeled "HeatMap" in the top corner of your chart.
With just one click, it opens a compact, easy-to-read panel showing historical market behavior in a 24-hour x 14-day grid layout.
What it shows:
-
Hourly Data: Each column represents 1 hour of the day (00-23).
-
Daily View: Each row represents 1 day (going back 14 days, starting from yesterday – excluding the current day).
-
Color-coded Heat Zones: Visually highlights periods of high/low volume or big/small price changes.
Built-in Display Modes:
The panel lets you toggle between two views at any time:
-
📊 Volume HeatMap
Shows market activity intensity for each hour. -
📈 Pips Change HeatMap
Displays hourly price movement strength.
This allows you to quickly spot which hours historically delivered the most action, helping you optimize your trading sessions.
Features:
-
No input parameters – just plug-and-play.
-
Floating Button Access: Keeps your chart clean until you need the data.
-
One-Click View Switch: Instantly toggle between Volume and Pips Change.
-
Historical Focus: Uses data from yesterday back 14 days, so you can compare previous sessions without current-day noise.
Perfect for intraday traders, scalpers, and anyone looking to time the most active trading windows!