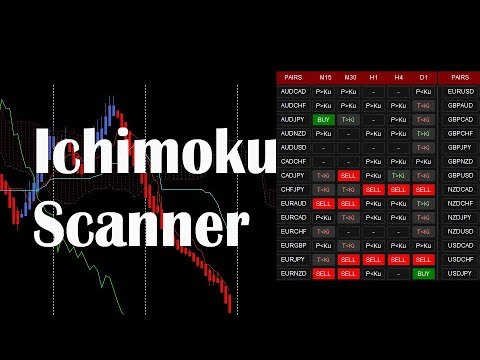
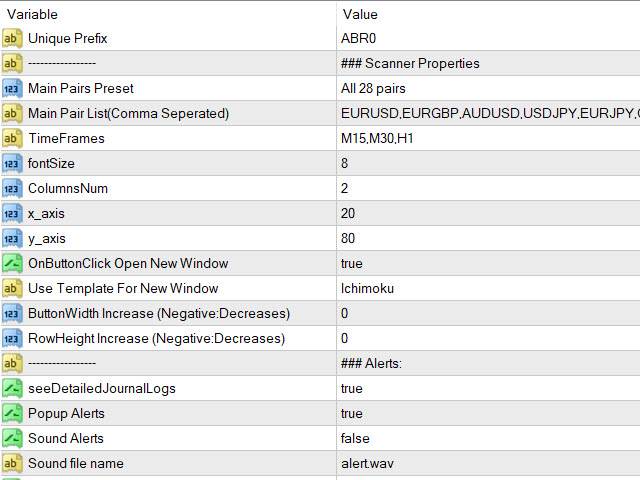
Ichimoku Scanner Dashboard
- Indicatori
-
Abir Pathak
 I create MT4 and MT5 indicators. They are mainly arrows and scanner indicators and also some essential utilities.
I'm hoping they will make your trading easier and make you profitable.
You can join my Telegram channel to keep track of all products I post. - Versione: 2.19
- Aggiornato: 16 febbraio 2021
- Attivazioni: 20
Dashboard uses Ichimoku Strategy to find best trades.
Get extra Indicators/Template:
And read more about detailed Product Description and usage here:
https://www.mql5.com/en/blogs/post/747457
Read more about Scanner Common features in detail here:
https://www.mql5.com/en/blogs/post/747456
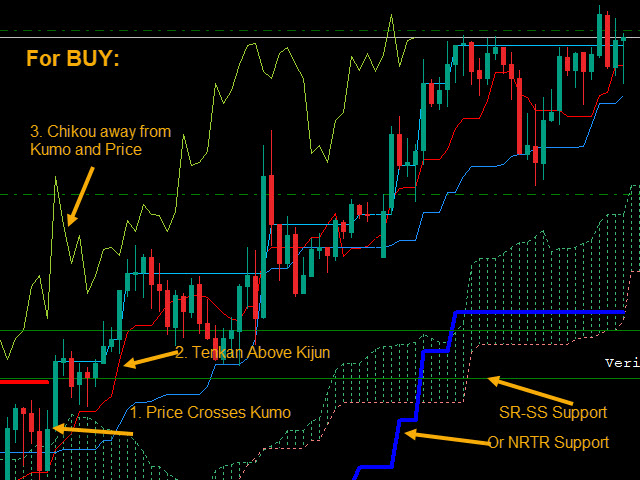
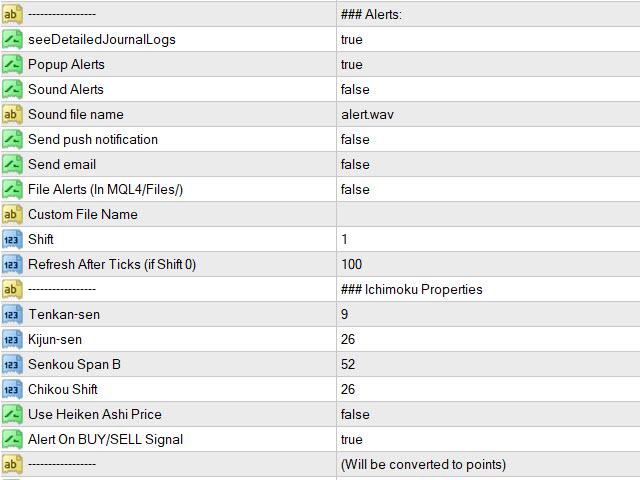
Features:
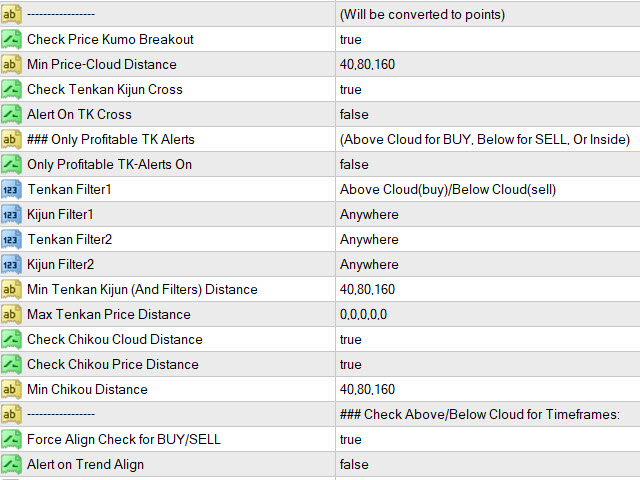
- Price Kumo Breakout
- Tenkan-Kijun Cross
- Chikou/CLoud and Chikou/Price
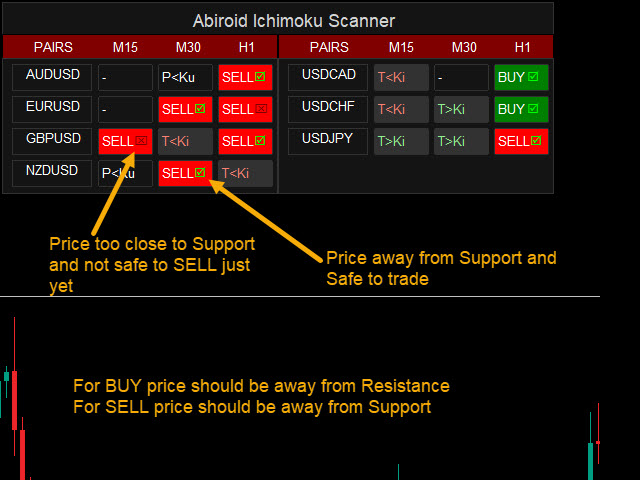
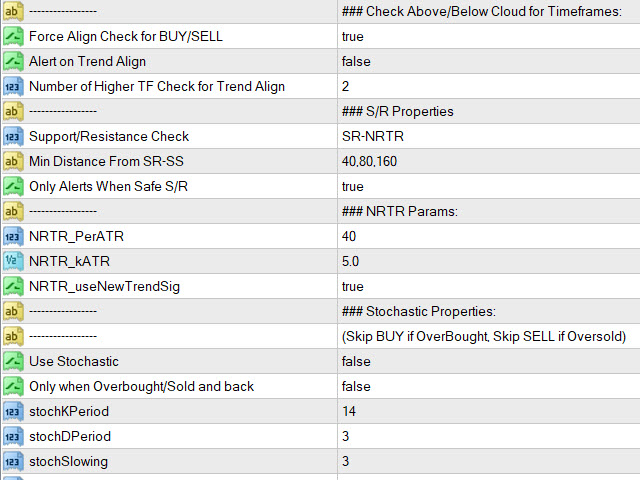
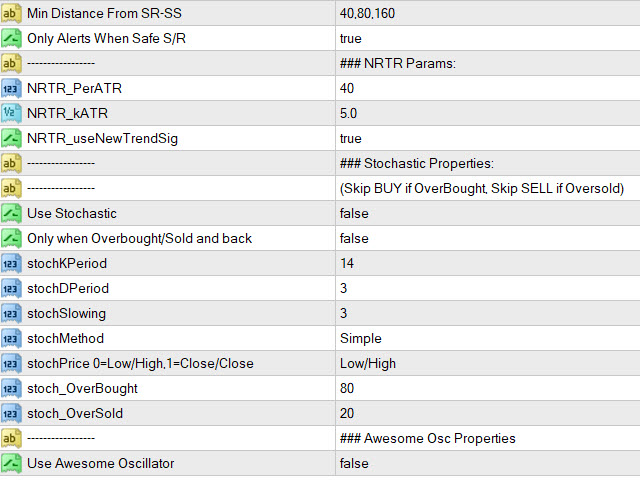
- Support/Resistance (SR-SS or SR-NRTR)
- Stochastic OB/OS and back
- Awesome Oscillator
- Higher Timeframe Ichimoku Trend Align


Very powerful tool!!!!!! The dashboard gives you a complete outlook at a glance, I have been trading with Ichimoku for quite a while and this is exactly what I am looking for.. And the support from the Author(Abir Pathak) is incredible.