Desk analytical table
- Utilità
- Versione: 1.8
- Aggiornato: 7 luglio 2017
- Attivazioni: 5

Desk Analytical Table Portfolio Monitoring for Active Traders
Overview:
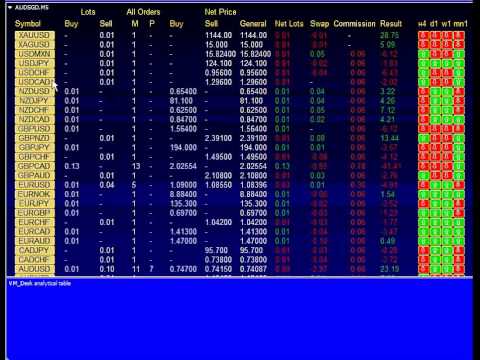
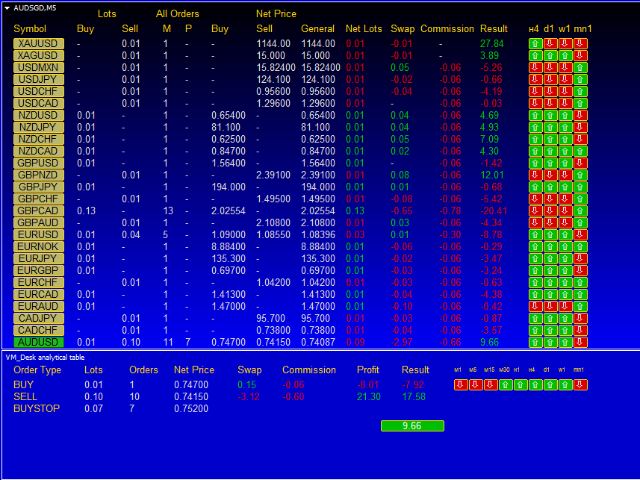
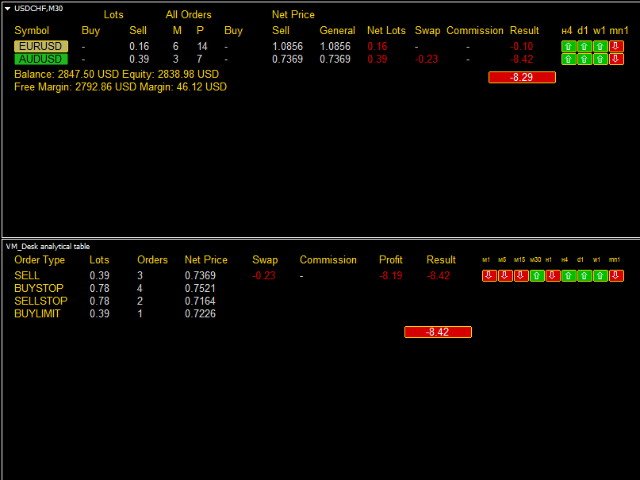
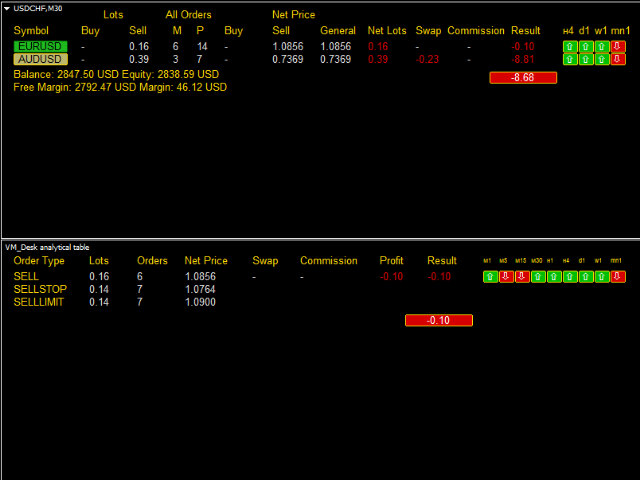
The Desk Analytical Table indicator is a professional tool designed for traders managing multiple financial instruments simultaneously. It consolidates key data on open positions, orders, and market statistics into a single window, ensuring seamless portfolio control even during high-intensity trading sessions.
Key Features:
▪️ Multi-Instrument Analysis
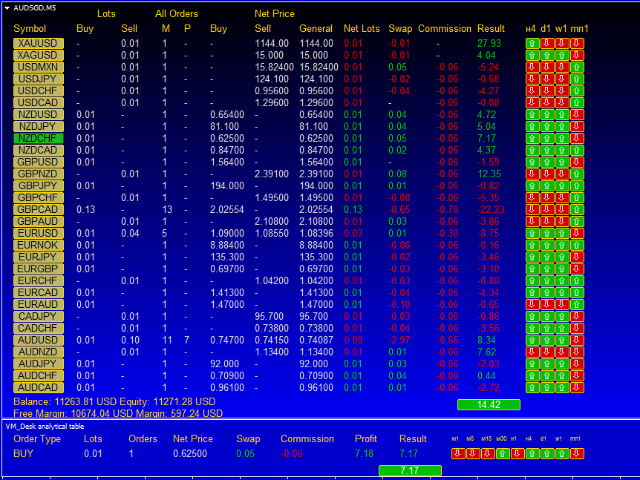
- Monitor up to 30 assets in real time with quick switching between instruments.
- Dynamic Data Display: The number of visible instruments adapts automatically based on the selected font size (8–14).
▪️ Detailed Statistics
- Position Volumes: Total lots for BUY/SELL directions.
- Order Types: Separation of market ("M") and pending ("P") orders.
- Financial Metrics: Swaps, commissions, profit/loss in deposit currency and as a percentage of account balance.
- Net Prices: Average position price and breakeven level.
▪️ Visual Clarity
- Color Indicators:
- Green/Red to highlight price movement direction (Close vs. Open).
- Customizable colors for buttons, text, background, and borders via settings.
- Timeframes: H4, D1, W1, MN1 — Status of the current candle on each timeframe.
Ease of Use:
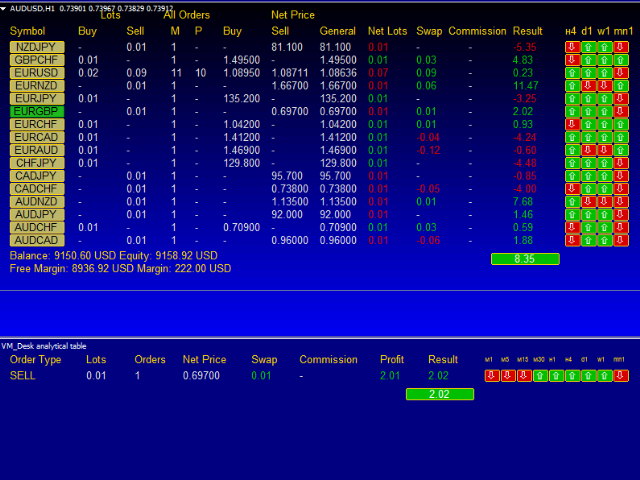
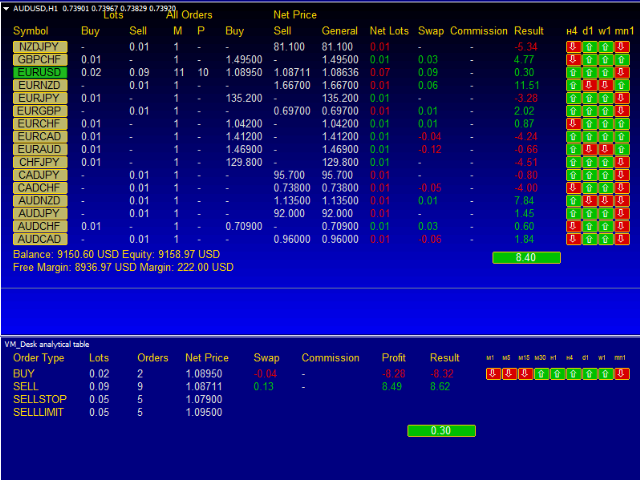
▪️ Two-Tier Interface
- Main Window: List of instruments with summarized data.
- Detailed Window: Click on an asset to view expanded order details, swaps, and profitability metrics.
▪️ Adaptive Design
- Adjust font size (8–14) and element colors to match your workflow.
- Option to modify chart background for improved readability.
Customization Options:
▪️ Appearance
- Font size, header colors, text colors, and button states (active/inactive).
- Table and chart background (including transparency).
▪️ Visual Emphasis
- Custom colors for profit ("Plus") and loss ("Minus").
- Button border highlighting when an instrument is selected.
Who Is It For?
- Portfolio Traders managing diverse positions.
- Arbitrage Strategies requiring correlation monitoring across assets.
- Traders with Accessibility Needs: Interface optimized for voice-controlled software.
Getting Started:
1. Install the indicator on any financial instrument (recommended: select one not actively traded).
2. Customize display settings to match your preferences.
3. Manage your portfolio efficiently in a single window, saving time and minimizing errors.
Your Ideal Trading Assistant — Transparent, Customizable, Efficient.
Desk Analytical Table: Where Market Chaos Meets Clarity.
**Parameters:**
- Include Background Indicator: Enable/disable default background mode (disabled).
- Standard Out Background Indicator: Background placement (top/bottom).
- Replace Main Chart Background: Modify chart background color (disabled by default).
- Screen Background Color: Default chart background color.
- Font Size (8–14): Adjust font size for optimal visibility.
- Header Color: Text color in table headers.
- Header Text Color: Text color in data rows.
- Button Text Color: Text color on buttons.
- ON/OFF Button Colors: Customize active/inactive button states and borders.
- Profit/Loss Colors: Assign colors for "Plus" (profit) and "Minus" (loss).
- Timeframe Label Color: Text color for timeframe indicators.


L'utente non ha lasciato alcun commento sulla valutazione.