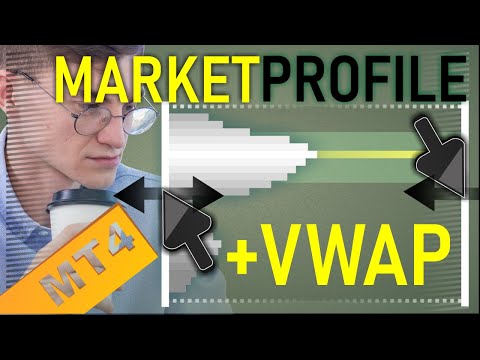
Forex Market Profile and Vwap

4.86

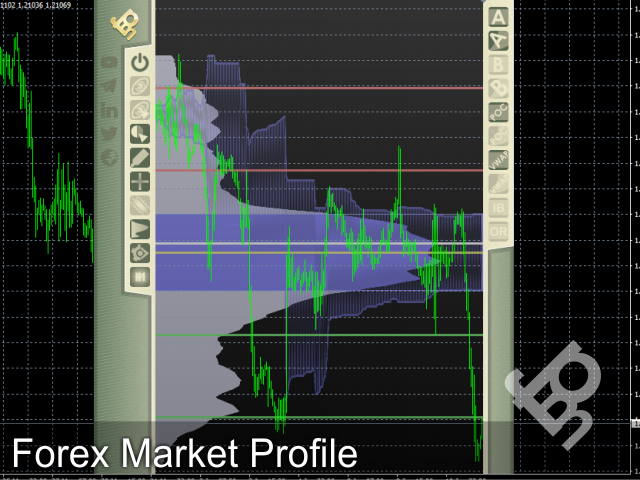
Profilo del mercato Forex (FMP in breve)

Cosa non è:

FMP non è il classico display TPO con codice alfabetico, non mostra il calcolo generale del profilo dati del grafico e non segmenta il grafico in periodi e non li calcola.

Cosa fa :

  1. Soprattutto, l'indicatore FMP elaborerà i dati che risiedono tra il bordo sinistro dello spettro definito dall'utente e il bordo destro dello spettro definito dall'utente.
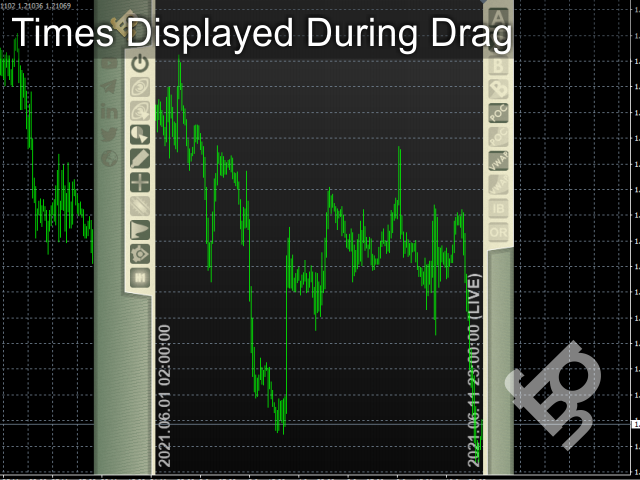
  2. L'utente può definire lo spettro semplicemente tirando ciascuna estremità dell'indicatore con il mouse.
  3. Quando il bordo destro dell'indicatore viene spostato sulla barra live e oltre (verso il futuro), l'indicatore è considerato "live" (si aggiorna con nuove barre)
  4. L'indicatore rilascia un oggetto "ancora" sulla carta a cui è collegato e successivamente associa quell'ancora a un file sul disco rigido.
  5. Ciò ti consente di avere un FMP in corso in esecuzione su un grafico, con le tue impostazioni persistenti durante i riavvii fino alla chiusura del grafico o dell'indicatore.
  6. L'indicatore FMP può eseguire molte istanze di se stesso su un grafico e ti viene data la possibilità di nominarli (il nome appare semitrasparente sui dati dell'indicatore per poterli distinguere)
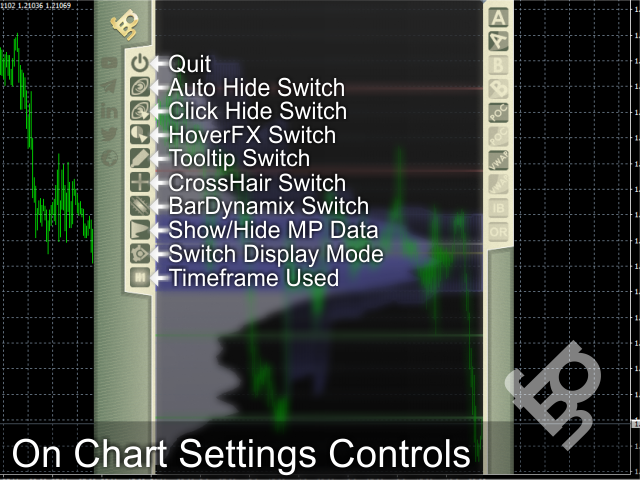
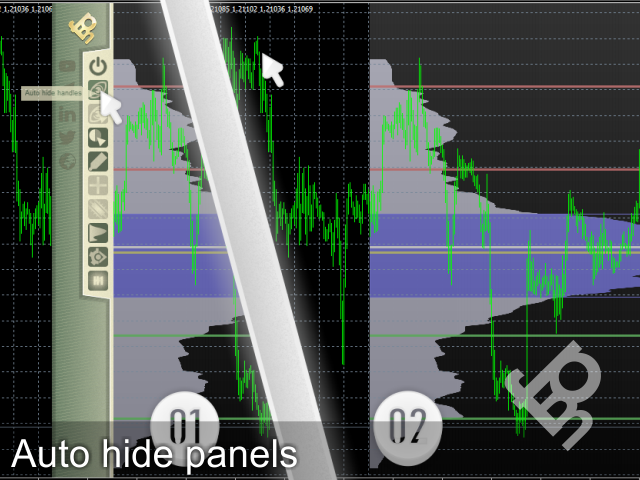
  7. La finestra dei dati dell'indicatore è circondata da controlli di commutazione rapida che aggiornano la "memoria" delle impostazioni per l'indicatore per quel grafico quando il loro stato cambia.
  8. È possibile personalizzare la maniglia sinistra, la maniglia destra e la visualizzazione della finestra dati. Puoi selezionare tra 13 diverse combinazioni di stili o scegliere lo stile individuale di ciascuna parte (tra i 13).
  9. È possibile scegliere di visualizzare i dati del profilo (tpos) allineati a sinistra dello spettro, centrati simmetricamente al centro, allineati a destra dello spettro.
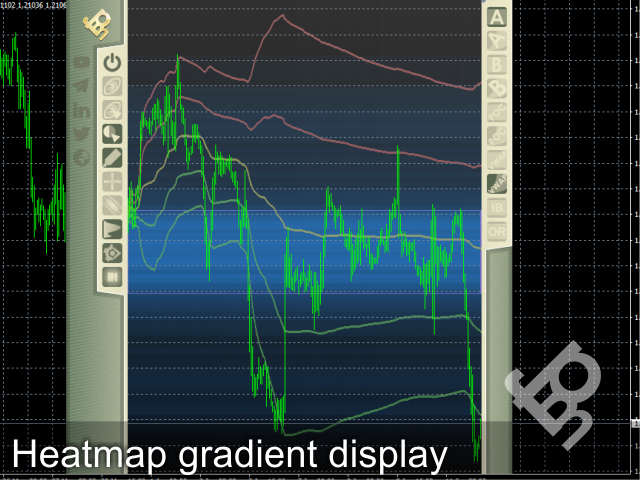
  10. C'è una modalità di visualizzazione aggiuntiva "Heatmap" e una "nessuna visualizzazione" che consente ad altre metriche di essere prominenti nella finestra dei dati.
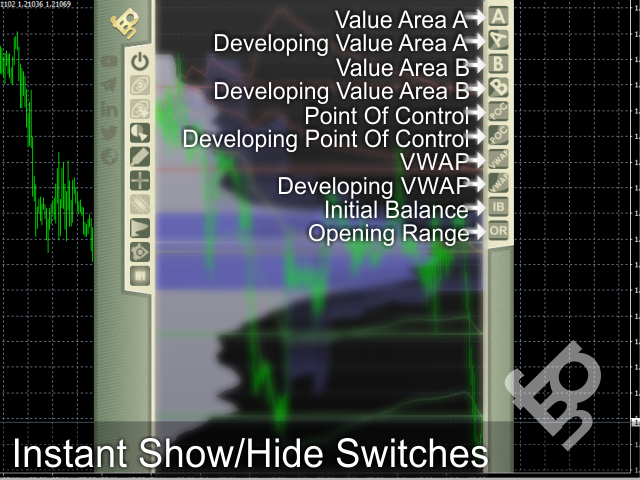
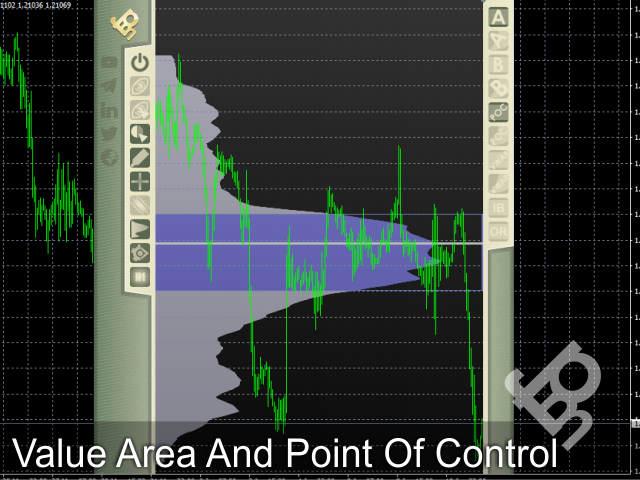
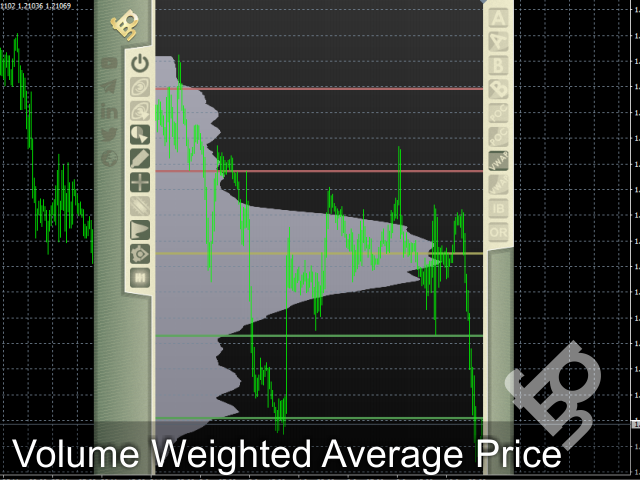
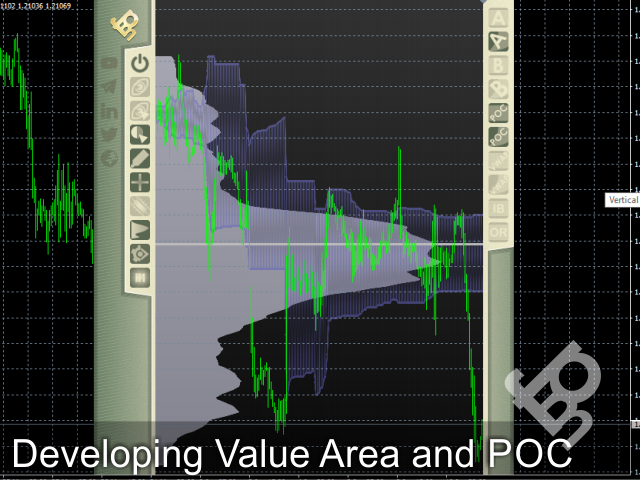
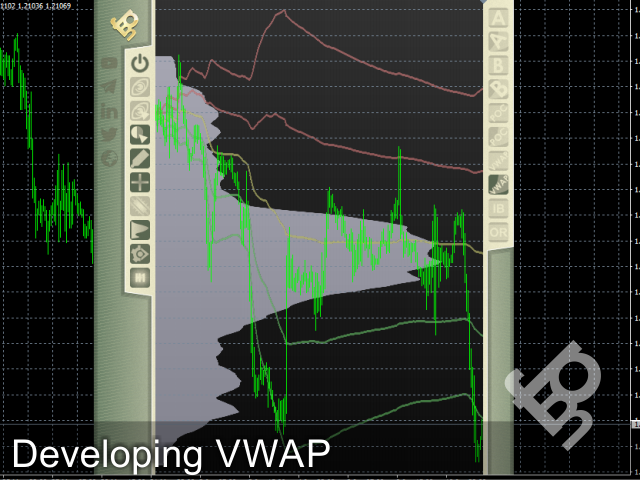
Inoltre offre 2 calcoli dell'area del valore e la possibilità di regolare la percentuale di "attività" che ciascuna rappresenta, un calcolo del punto di controllo, il calcolo del prezzo medio ponderato del volume (VWAP), il saldo iniziale, il range di apertura, il punto di sviluppo di controllo (DevPOC) mentre si evolve attraverso la gamma, nonché le aree di valore in via di sviluppo e il VWAP in via di sviluppo.

*Le metriche di sviluppo tengono traccia di come un punto dati si è evoluto attraverso lo spettro che hai definito nel tempo per arrivare al livello in cui è attualmente*

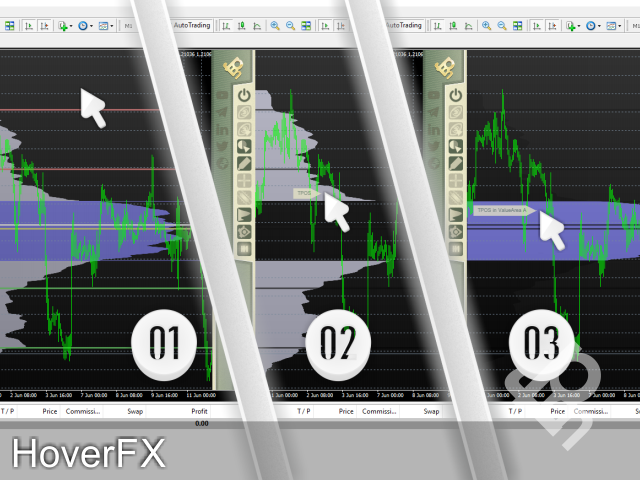
Per evitare disordine, FMP ha una funzionalità al passaggio del mouse che migliora il punto dati su cui sta tracciando il mouse rispetto agli altri punti dati che occupano la finestra di visualizzazione dei dati. (Ci sono interruttori rapidi per attivarlo e disattivarlo)

Per ragioni simili, è stato introdotto un sistema di tooltip (per ora solo in lingua inglese, anche questo può essere attivato e disattivato) e un mirino sopra la finestra di visualizzazione dei dati che mostra il prezzo e l'ora. (È possibile attivare e disattivare questa opzione anche)

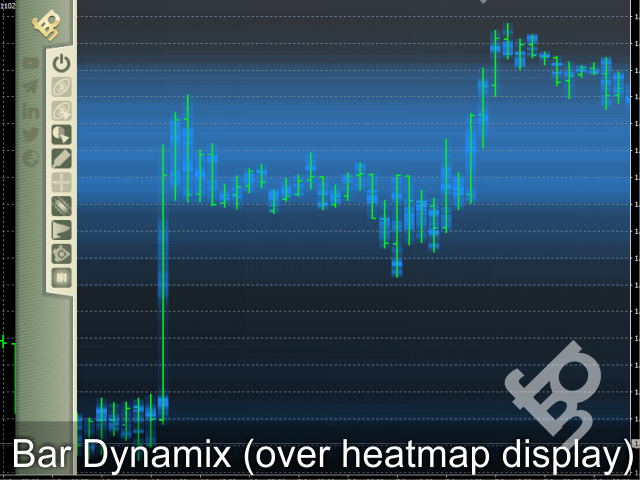
BarDynamix (porzione sperimentale dell'indicatore FMP), essenzialmente è un profilo di mercato all'interno di un profilo di mercato. Eseguirà lo stesso calcolo e traccerà una mappa del gradiente delle aree con più attività per ogni barra (candela) all'interno dell'intervallo che hai specificato .(puoi accendere e spegnere il suo display. È stato ottimizzato per "bruciare" meno risorse possibili quando è acceso)

Puoi leggere un ampio manuale qui

L'indicatore non utilizza:

  • AI, intelligenza artificiale
  • chatGPT, claude, deepseek
  • rete neurale
  • apprendimento rinforzato
  • algoritmo genetico
  • OpenAI
Recensioni 14
raypiscopo
105
raypiscopo 2025.12.12 11:41 
 

This developer is has produced the best free product for vwap and volume profile, I have ever seen. Way better than most paid products. Do yourself and the developer a favor and try it out. No joke, it's awesome!

Stanislav Melnikov
868
Stanislav Melnikov 2025.09.18 17:36 
 

гут

Fakhar Ul Islam
239
Fakhar Ul Islam 2024.09.23 13:42 
 

please tell me why it keep removed from chart

Prodotti consigliati
Market Profile 3
Hussien Abdeltwab Hussien Ryad
3 (2)
Market Profile 3 MetaTrader 4 indicator  — is a classic Market Profile implementation that can show the price density over time, outlining the most important price levels, value area, and control value of a given trading session. This indicator can be attached to timeframes between M1 and D1 and will show the Market Profile for daily, weekly, monthly, or even intraday sessions. Lower timeframes offer higher precision. Higher timeframes are recommended for better visibility. It is also possible t
FREE
SX Supply Demand Zones accurately identifies and draws high-probability Supply and Demand zones using a sophisticated algorithm. Unlike traditional indicators that clutter your chart, this indicator is designed with a focus on performance and a clean user experience. New Unique Feature: Interactive Legend System What truly sets this indicator apart from everything else is the Interactive Control Legend. You have a professional dashboard directly on your chart that allows you to: Show/Hide: Ins
FREE
Enhanced Volume Profile: The Ultimate Order Flow & Liquidity Analysis Tool Overview Enhanced Volume Profile   is an indicator for MetaTrader 5 that displays the traded volume at specific price levels over a defined period. It separates the total volume into buy and sell components, presenting them as a side-by-side histogram on the chart. This allows users to observe the volume distribution and the proportion of buy and sell volumes at each price level. Graphics Rendering The indicator uses t
FREE
PZ Penta O MT4
PZ TRADING SLU
2.33 (3)
The Penta-O is a 6-point retracement harmonacci pattern which usually precedes big market movements. Penta-O patterns can expand and repaint quite a bit. To make things easier this indicator implements a twist: it waits for a donchian breakout in the right direction before signaling the trade. The end result is an otherwise repainting indicator with a very reliable trading signal. The donchian breakout period is entered as an input. [ Installation Guide | Update Guide | Troubleshooting | FAQ | A
FREE
Zig Zag 123
Stephen Reynolds
Zig Zag 123 tells us when a reversal or continuation is more likely by looking at the shift in supply and demand. When this happens a signature pattern appears known as 123 (also known ABC) will often break out in direction of higher low or lower high. Stop loss and take profit levels have been added. There is a panel that shows the overall performance of your trades for if you was to use these stop loss and take profit levels.  We get alerted if a pattern 123 appears and also if the price re
FREE
SMA Indicator
Nitu Brijesh Yadav
Arrow Indicator (Buy/Sell Alerts) – Simple Yet Powerful Tool!             Product Version: 1.01           Indicator Type: Trend Reversal Signals           Timeframes Supported: All (Recommended: H1, H4, D1)           Key Features: Buy Signal: Green upward arrow () appears below the candle  Sell Signal : Red downward arrow () appears above the candle Accurate Trend Reversal Detection – Based on tried and tested SMA strategy. ️ Clean Chart View – Minimalist, non-i
FREE
Rainbow MT4
Jamal El Alama
Rainbow MT4 is a technical indicator based on Moving average with period 34 and very easy to use. When price crosses above MA and MA changes color to green, it’s a signal to buy. When price crosses below MA and MA changes color to red, it’s a signal to sell. The Expert advisor ( Rainbow EA MT4) based on Rainbow MT4 indicator, as you can see in the short video below is now available here .
FREE
Indicatore Smart FVG MT4 – Rilevamento Avanzato del Fair Value Gap per MetaTrader 4 L'indicatore Smart FVG per MetaTrader 4 offre rilevamento, monitoraggio e avvisi professionali dei Fair Value Gap (FVG) direttamente sui tuoi grafici. Combina un filtro basato sull'ATR con una logica sensibile alla struttura per eliminare il rumore, adattarsi alla liquidità e mantenere solo gli squilibri più rilevanti per decisioni operative precise. Vantaggi principali Rilevamento accurato degli FVG: individua
FREE
Trendline indicator
David Muriithi
2 (1)
Are you tired of drawing trendlines every time you're analyzing charts? Or perhaps you would like more consistency in your technical analysis. Then this is for you. This indicator will draw trend lines automatically when dropped on a chart. How it works Works similar to standard deviation channel found on mt4 and mt5. It has 2 parameters: 1. Starting Bar 2. Number of bars for calculation The   starting bar   is the bar which drawing of the trend lines will begin, while the   number of bars for c
FREE
Traditional MACD MT4
Daniel Lewis
4.58 (55)
MACD indicator in MetaTrader 4/5 looks different than MACD does in most other charting software. That is because the MetaTrader 4/5 version of MACD displays the MACD line as a histogram when it is traditionally displayed as a line. Additionally, the MetaTrader 4/5 version computes the Signal line using an SMA, while according to MACD definition it is supposed to be an EMA. The MetaTrader 4/5 version also does not compute a true MACD Histogram (the difference between the MACD/Signal lines). This
FREE
High Low Open Close MT4
Alexandre Borela
4.81 (21)
Se ti piace questo progetto, lascia una recensione a 5 stelle. Questo indicatore disegna i prezzi aperti, alti, bassi e di chiusura per i specificati periodo e può essere regolato per un determinato fuso orario. Questi sono livelli importanti guardati da molti istituzionali e professionali commercianti e può essere utile per voi per conoscere i luoghi dove potrebbero essere più attivo. I periodi disponibili sono: Giorno precedente. Settimana precedente. Mese precedente. Precedente trimestre. A
FREE
Cumulative Delta MT4
Evgeny Shevtsov
4.86 (29)
The indicator analyzes the volume scale and splits it into two components - seller volumes and buyer volumes, and also calculates the delta and cumulative delta. The indicator does not flicker or redraw, its calculation and plotting are performed fairly quickly, while using the data from the smaller (relative to the current) periods. The indicator operation modes can be switched using the Mode input variable: Buy - display only the buyer volumes. Sell - display only the seller volumes. BuySell -
FREE
The indicator allows you to trade binary options. The recommended time frame is М1 and the expiration time is 1,2,3 minutes. The indicator suitable for auto and manual trading. A possible signal is specified as a arrows above/under a candle. You should wait until the candle closes! Arrows are not re-painted Trade sessions: TOKYO section (Half-end) Currency pairs: USD/JPY Working time frame: M1 Expiration time: 1,2,3 minutes. The indicator also shows good results when using the martingale strateg
FREE
Free automatic Fibonacci is an indicator that automatically plots a Fibonacci retracement based on the number of bars you select on the BarsToScan setting in the indicator. The Fibonacci is automatically updated in real time as new highest and lowest values appears amongst the selected bars. You can select which level values to be displayed in the indicator settings. You can also select the color of the levels thus enabling the trader to be able to attach the indicator several times with differe
FREE
This indicator help to mark the high and low of the session Asian,London,Newyork , with custom hour setting This indicator is set to count from minute candle so it will move with the current market and stop at the designated hour and create a accurate line for the day. below is the customization that you can adjust : Input Descriptions EnableAsian Enables or disables the display of Asian session high and low levels. EnableLondon Enables or disables the display of London session high and
FREE
This indicator alerts you when/before new 1 or 5 minute bar candle formed. In other words,this indicator alerts you every 1/5 minutes. This indicator is especially useful for traders who trade when new bars formed. *This indicator don't work propery in strategy tester.Use this in live trading to check functionality. There is more powerful Pro version .In Pro version,you can choose more timeframe and so on. Input Parameters Alert_Or_Sound =Sound ----- Choose alert or sound or both to notify y
FREE
Auto Supply and Demand Oscillator is an indicator for MetaTrader 4 and MetaTrader 5 that detects supply and demand zones automatically and displays them as a single oscillator value at the bottom of the chart, instead of drawing rectangles directly on price. Concept Supply zones are price areas where strong selling created a sharp downward move away from a balance area. Demand zones are price areas where strong buying created a sharp upward move. Traditional implementations draw boxes on the
FREE
BoxInside MT4
Evgeny Shevtsov
4.83 (6)
This indicator calculates the volume profile and places labels that correspond to the VAH, VAL and POC levels, for each candle individually. Indicator operation features The indicator works on the timeframes from M5 to MN, but it uses the history data of smaller periods: M1 - for periods from M5 to H1, M5 - for the H4 period, M30 - for the D1 period, H4 - for the W1 period, D1 - for the MN period. The color and location of the VAL, VAH and POC labels on the current candle are considered to be c
FREE
Discover the power of precision and efficiency in your trading with the " Super Auto Fibonacci " MT4 indicator. This cutting-edge tool is meticulously designed to enhance your technical analysis, providing you with invaluable insights to make informed trading decisions. Key Features: Automated Fibonacci Analysis: Say goodbye to the hassle of manual Fibonacci retracement and extension drawing. "Super Auto Fibonacci" instantly identifies and plots Fibonacci levels on your MT4 chart, saving you tim
FREE
Follow The Line
Oliver Gideon Amofa Appiah
3.94 (16)
FOLLOW THE LINE GET THE FULL VERSION HERE: https://www.mql5.com/en/market/product/36024 This indicator obeys the popular maxim that: "THE TREND IS YOUR FRIEND" It paints a GREEN line for BUY and also paints a RED line for SELL.  It gives alarms and alerts of all kinds. IT DOES NOT REPAINT and can be used for all currency pairs and timeframes. Yes, as easy and simple as that. Even a newbie can use it to make great and reliable trades. NB: For best results, get my other premium indicators for more
FREE
Extremum Reverse Bar
Yurij Izyumov
2.8 (5)
This indicator has been created for finding the probable reversal points of the symbol price. A small candlestick reversal pattern is used it its operation in conjunction with a filter of extremums. The indicator is not redrawn! If the extremum filter is disabled, the indicator shows all points that have a pattern. If the extremum filter is enabled, the condition works – if the history Previous bars 1 candles back contains higher candles and they are farther than the Previous bars 2 candle, such
FREE
Quantum Falcon Signal Free is a smart visual trading indicator for MetaTrader 4 designed for Forex and Gold traders. The indicator combines: • Trend analysis • RSI momentum confirmation • MACD momentum filtering • ATR volatility filtering • Higher timeframe confirmation • Smart exit signal detection Main Features: • Smart Buy and Sell signals • Exit Buy / Exit Sell alerts • Real-time dashboard on chart • Professional candle arrows • Multi-timeframe trend confirmation • ATR market volatility filt
FREE
Highlights trading sessions on the chart The demo version only works on the AUDNZD chart!!! The full version of the product is available at: (*** to be added ***) Trading Session Indicator displays the starts and ends of four trading sessions: Pacific, Asian, European and American. the ability to customize the start/end of sessions; the ability to display only selected sessions; works on M1-H2 timeframes; The following parameters can be configured in the indicator: TIME_CORRECTION = Correct
FREE
MT Supply Demand
Issara Seeboonrueang
4 (4)
We provide indicators tailored to better meet your trading requirements.       >>  MT Magical  << MT Supply Demand : It is an indicator created to find supply and demand, which will be important support and resistance levels for the price.  Supply Zone   is a zone where the price has reached, it is often resisted. In other words, when the price reaches this zone, there will be more selling power to push the price back down. Demand Zone   is a zone where the price has reached, it is ofte
FREE
PZ Pivot Points
PZ TRADING SLU
4.6 (10)
This indicator displays pivot points in the chart, including historical vales, and supports many calculation modes for Pivot Points and S/R levels. [ Installation Guide | Update Guide | Troubleshooting | FAQ | All Products  |  Get Help ] It plots historical levels for backtesting purposes It allows you to select the reference timeframe It implements different Pivot Point calculation modes It implements different SR calculation modes It implements customizable colors and sizes Calculation Mode
FREE
This scanner shows the trend values of the well known indicator SuperTrend for up to 30 instruments and 8 time frames. You can get alerts via MT4, Email and Push-Notification as soon as the direction of the trend changes. This is the FREE version of the indicator: SuperTrend Scanner The free version works only on EURUSD and GBPUSD! Important Information How you can maximize the potential of the scanner, please read here: www.mql5.com/en/blogs/post/718074 With the following FREE indicator you c
FREE
Check my paid tools they work great and I share Ea's based on them for free please r ate The Dual Timeframe RSI (Relative Strength Index) indicator is a novel trading tool that allows traders to monitor RSI readings from two different timeframes on a single chart. This dual perspective enables traders to identify potential trend confirmations and divergences more effectively. For instance, a trader might use a 1-hour RSI alongside a daily RSI to ensure that short-term trades align with the broa
FREE
QualifiedEngulfing
Ashkan Hazegh Nikrou
QualifiedEngulfing è la versione gratuita dell'indicatore ProEngulfing . ProEngulfing è la versione a pagamento dell'indicatore Advance Engulf. Scaricalo qui. Qual è la differenza tra la versione gratuita e la versione a pagamento di ProEngulfing ? La versione gratuita ha un limite di un segnale al giorno. Presentazione di QualifiedEngulfing - Il tuo indicatore professionale per i modelli Engulf su MT4 Sblocca la potenza della precisione con QualifiedEngulfing, un indicatore all'avanguardia pro
FREE
Pivot Point Fibo RSJ è un indicatore che traccia le linee di supporto e resistenza del giorno utilizzando i tassi di Fibonacci. Questo spettacolare indicatore crea fino a 7 livelli di supporto e resistenza tramite Pivot Point utilizzando i tassi di Fibonacci. È fantastico come i prezzi rispettino ogni livello di questo supporto e resistenza, dove è possibile percepire possibili punti di entrata/uscita di un'operazione. Caratteristiche Fino a 7 livelli di supporto e 7 livelli di resistenza Im
FREE
Wise Men Indicator demo
Bohdan Kasyanenko
3 (2)
The indicator displays signals according to the strategy of Bill Williams on the chart. Demo version of the indicator has the same features as the paid, except that it can work only on a demo account . Signal "First Wise Man" is formed when there is a divergent bar with angulation.  Bullish divergent bar - with lower minimum and closing price in the upper half. Bearish divergent bar - higher maximum and the closing price at the bottom half. Angulation is formed when all three lines of Alligator
FREE
Gli utenti di questo prodotto hanno anche acquistato
Neuro Poseidon MT4
Daria Rezueva
4.93 (29)
Neuro Poseidon is a new indicator by Daria Rezueva. It combines precise trading signals with adaptive TP/SL levels - creating best possible trades as a result! Message me and get  Neuro Poseidon Assistant  as a gift to automize your trading process! What makes it stand out? 1. Proven profitability on all assets and timeframes 2. Only confirmed BUY and SELL signals present on the chart 3. Adaptive TP & SL levels generated by the software for each trade 4. Easy to understand - suitable for all
M1 Sniper
Oleg Rodin
5 (23)
M1 SNIPER è un sistema di indicatori di trading facile da usare. Si tratta di un indicatore a freccia progettato per l'intervallo temporale M1. L'indicatore può essere utilizzato come sistema autonomo per lo scalping sull'intervallo temporale M1 e come parte del tuo sistema di trading esistente. Sebbene questo sistema di trading sia stato progettato specificamente per il trading sull'intervallo temporale M1, può comunque essere utilizzato anche con altri intervalli temporali. Inizialmente ho pro
Gann Made Easy
Oleg Rodin
4.84 (164)
Gann Made Easy è un sistema di trading Forex professionale e facile da usare che si basa sui migliori principi del trading utilizzando la teoria di mr. WD Gann. L'indicatore fornisce segnali ACQUISTA e VENDI accurati, inclusi i livelli di Stop Loss e Take Profit. Puoi fare trading anche in movimento utilizzando le notifiche PUSH. CONTATTAMI DOPO L'ACQUISTO PER RICEVERE GRATUITAMENTE LE ISTRUZIONI DI TRADING E OTTIMI INDICATORI EXTRA! Probabilmente hai già sentito parlare molte volte dei metodi d
Dynamic Forex28 Navigator
Bernhard Schweigert
4.43 (7)
Dynamic Forex28 Navigator - Lo strumento di trading Forex di nuova generazione. ATTUALMENTE SCONTATO DEL 49%. Dynamic Forex28 Navigator è l'evoluzione dei nostri indicatori popolari di lunga data, che combinano la potenza di tre in uno: Advanced Currency Strength28 Indicator (695 recensioni) + Advanced Currency IMPULSE con ALERT (520 recensioni) + CS28 Combo Signals (Bonus). Dettagli sull'indicatore https://www.mql5.com/en/blogs/post/758844 Cosa offre l'indicatore di forza di nuova generazione?
Scalper Inside PRO
Alexey Minkov
4.74 (68)
Scalper Inside PRO Scalper Inside PRO is an intraday trend and scalping indicator for MetaTrader 4 that uses an exclusive algorithm to quickly detect market direction and key target levels. It automatically calculates entry, exit and multiple profit targets, and shows detailed performance statistics so you can see how different instruments and strategies performed. This helps you choose the most suitable trading instruments for the current market conditions. Additionally, you can easily integrat
Enigmera
Ivan Stefanov
5 (8)
ENIGMERA: Il cuore del mercato Importante: La demo di MQL5.com funziona nel Strategy Tester e potrebbe non riflettere completamente le funzionalità di Enigmera. Consulta la descrizione, gli screenshot e il video per maggiori dettagli. Non esitare a inviarmi un messaggio se hai domande! Il codice dell'indicatore è stato completamente riscritto. La versione 3.0 aggiunge nuove funzionalità e corregge i bug accumulati dall'inizio dell'indicatore. Introduzione Questo indicatore e sistema di trading
KT Alpha Hunter Arrows MT4
KEENBASE SOFTWARE SOLUTIONS
La maggior parte degli indicatori a frecce ti dà un segnale e poi ti lascia capire da solo tutto il resto. KT Alpha Hunter Arrows ti offre un piano di trading completo. Ogni freccia di segnale viene visualizzata con un piano già tracciato: linea di ingresso, stop loss, quattro livelli di take profit e un verdetto edge in tempo reale che ti indica se quel simbolo e quel timeframe meritano di essere tradati in quel momento. Il pacchetto include un Trade Manager EA che gestisce l’esecuzione dopo il
Trend Catcher ind
Ramil Minniakhmetov
5 (2)
INDICATORE TREND CATCHER L'indicatore Trend Catcher analizza i movimenti dei prezzi di mercato, utilizzando una combinazione di indicatori di analisi del trend proprietari dell'autore e personalizzati. Identifica la vera direzione del mercato filtrando il rumore a breve termine e concentrandosi sulla forza del momentum sottostante, sull'espansione della volatilità e sul comportamento della struttura dei prezzi. Utilizza inoltre una combinazione di indicatori personalizzati di smoothing e filtr
PRO Renko System
Oleg Rodin
5 (30)
PRO Renko System è un sistema di trading altamente accurato appositamente progettato per il trading di grafici RENKO. Questo è un sistema universale che può essere applicato a vari strumenti di trading. Il sistema neutralizza efficacemente il cosiddetto rumore di mercato che consente di accedere a segnali di inversione accurati. L'indicatore è molto facile da usare e ha un solo parametro responsabile della generazione del segnale. Puoi facilmente adattare lo strumento a qualsiasi strumento di
Trend Lines PRO
Roman Podpora
5 (1)
LINEE DI TENDENZA PRO       Aiuta a capire dove il mercato sta realmente cambiando direzione. L'indicatore mostra reali inversioni di tendenza e punti in cui i principali attori rientrano. Vedi  Linee BOS   Cambiamenti di tendenza e livelli chiave su timeframe più ampi, senza impostazioni complesse o rumore inutile. I segnali non vengono ridisegnati e rimangono sul grafico dopo la chiusura della barra. VERSIONE MT 5     -      Svela il suo massimo potenziale se abbinato all'indicatore   RFI LEVE
Genesis Matrix Pro is a professional multi-timeframe trend detection indicator designed to help traders identify high-quality market alignment with clarity and structure. It combines 12 different technical indicators into one visual alignment matrix, allowing traders to quickly see when market conditions are bullish, bearish, or neutral. A signal is generated only when the selected strategies are aligned, helping reduce noise and improve decision-making. PLEASE CONTACT ME AFTER PURCHASE TO GET
Questo prodotto è stato aggiornato per il mercato 2026 e ottimizzato per le ultime build di MT5. AVVISO DI AGGIORNAMENTO PREZZO: Smart Trend Trading System è attualmente disponibile a $99 . Il prezzo aumenterà a $199 dopo i prossimi 30 acquisti . OFFERTA SPECIALE: Dopo aver acquistato Smart Trend Trading System, inviami un messaggio privato per ricevere Smart Universal EA GRATIS e trasformare i tuoi segnali Smart Trend in operazioni automatiche. Smart Trend Trading System è un sistema di tradin
PZ Trend Trading
PZ TRADING SLU
4.8 (5)
Capture every opportunity: your go-to indicator for profitable trend trading Trend Trading is an indicator designed to profit as much as possible from trends taking place in the market, by timing pullbacks and breakouts. It finds trading opportunities by analyzing what the price is doing during established trends. [ Installation Guide | Update Guide | Troubleshooting | FAQ | All Products ] Trade financial markets with confidence and efficiency Profit from established trends without getting whips
Step into the world of Forex trading with confidence, clarity, and precision using   Gold Indicator   a next-generation tool engineered to take your trading performance to the next level. Whether you’re a seasoned professional or just beginning your journey in the currency markets, Gold Indicator equips you with powerful insights and help you trade smarter, not harder. Built on the proven synergy of three advanced indicators, Gold Indicator focuses exclusively on medium and long-term trends eli
PZ Swing Trading
PZ TRADING SLU
5 (3)
Protect against whipsaws: revolutionize your swing trading approach Swing Trading is the first indicator designed to detect swings in the direction of the trend and possible reversal swings. It uses the baseline swing trading approach, widely described in trading literature. The indicator studies several price and time vectors to track the aggregate trend direction and detects situations in which the market is oversold or overbought and ready to correct. [ Installation Guide | Update Guide | Tro
Current event:  https://c.mql5.com/1/326/A2SR2025_NoMusic.gif R. Cos'è l'A2SR ?   * È un indicatore tecnico leader (nessuna riverniciatura, nessun ritardo). -- Guida : -- su https://www.mql5.com/en/blogs/post/734748/page4#comment_16532516 -- e https://www.mql5.com/en/users/yohana/blog A2SR ha una tecnica speciale per determinare i livelli di supporto (domanda) e resistenza (offerta). A differenza del modo ordinario che abbiamo visto in rete, A2SR ha un concetto originale nel determinare i li
BTMM State Engine Pro is a MetaTrader 4 indicator for traders who use the Beat The Market Maker approach: Asian session context, kill zone timing, level progression, peak formation detection, and a multi-pair scanner from a single chart. It combines cycle state logic with a built-in scanner dashboard so you do not need the same tool on many charts at once. What it does Draws the Asian session range; session times can follow broker server offset or be set in inputs. Tracks level progression (L
L'indicatore " Dynamic Scalper System " è progettato per il metodo di scalping, ovvero per il trading all'interno di onde di trend. Testato sulle principali coppie di valute e sull'oro, è compatibile con altri strumenti di trading. Fornisce segnali per l'apertura di posizioni a breve termine lungo il trend, con ulteriore supporto al movimento dei prezzi. Il principio dell'indicatore. Le frecce grandi determinano la direzione del trend. Un algoritmo per generare segnali per lo scalping sotto fo
Neo Wave PRO
Nikolay Raykov
Price & Time Market Structure Indicator A professional market structure tool that analyzes waves through both price and time — not price alone. Main Description NeoWave PRO is a professional market structure indicator for MetaTrader 4 designed for traders who want to move beyond traditional one-dimensional wave tools such as ZigZag, swing indicators, and basic high/low systems. Most wave indicators analyze only one thing: Price. But a real market wave is not only a price movement. A true wave de
MonsterDash Harmonic Indicator is a harmonic pattern dashboard. It recognizes all major patterns. MonsterDash is a dashboard that displays all detected patterns for all symbols and (almost) all timeframes in sortable and scrollable format. Users can add their own user defined patterns . MonsterDash can open and update charts with the pattern found. Settings MonsterDash's default settings are good enough most of the time. Feel free to fine tune them to your needs. The color settings are for thos
Apollo SR Master è un indicatore di Supporto/Resistenza con caratteristiche speciali che rendono il trading con le zone di Supporto/Resistenza più semplice e affidabile. L'indicatore calcola le zone di Supporto/Resistenza in tempo reale senza alcun ritardo, rilevando i massimi e i minimi dei prezzi locali. Quindi, per confermare la nuova area SR formata, l'indicatore mostra un segnale speciale che segnala che la zona SR può essere presa in considerazione e utilizzata come un vero e proprio segna
ATTUALMENTE SCONTATO DEL 40% La soluzione migliore per ogni principiante o trader esperto! Questo indicatore è uno strumento di trading unico, di alta qualità e conveniente perché abbiamo incorporato una serie di caratteristiche proprietarie e una nuova formula. Con un solo grafico è possibile leggere la forza delle valute per 28 coppie Forex! Immaginate come migliorerà il vostro trading perché sarete in grado di individuare l'esatto punto di innesco di una nuova tendenza o di un'opportunità
Auto Optimized Parabolic RSI: Motore di Momentum 3D Avanzato La maggior parte degli indicatori per trader privati fallisce perché si affida a parametri statici che smettono di funzionare nel momento in cui la volatilità del mercato cambia. Auto Optimized Parabolic RSI risolve il problema dell'"obsolescenza dell'indicatore" ricalcolando continuamente il proprio vantaggio matematico, portando un adattamento quantitativo di livello istituzionale direttamente sul tuo terminale MT5. Il Vantaggio Prin
Advanced Supply Demand
Bernhard Schweigert
4.91 (300)
Speciale Trading- SCONTO DEL 40% La soluzione migliore per qualsiasi trader principiante o esperto! Questo indicatore è uno strumento di trading unico, di alta qualità e conveniente, perché abbiamo incorporato una serie di funzionalità proprietarie e una nuova formula. Con questo aggiornamento, potrai visualizzare doppie zone di timeframe. Non solo potrai visualizzare un TF più alto, ma anche entrambi, il TF del grafico e il TF più alto: MOSTRA ZONE ANNIDATE. Tutti i trader che operano con Of
Questo indicatore funziona con la teoria delle onde di Elliott in due modi: Modalità automatica: In questa modalità, l'indicatore rileverà automaticamente le cinque onde motrici sul grafico in conformità alla teoria delle onde di Elliott. Fornirà previsioni e individuerà potenziali zone di inversione. Inoltre, avrà la capacità di generare avvisi e messaggi push per informare i trader sugli sviluppi importanti. Questa funzionalità automatica semplifica il processo di identificazione e analisi dei
Introduction to Fractal Pattern Scanner Fractal Indicator refers to the technical indicator that makes use of the fractal geometry found in the financial market. Fractal Pattern Scanner is the advanced Fractal Indicator that brings the latest trading technology after the extensive research and development work in the fractal geometry in the financial market. The most important feature in Fractal Pattern Scanner is the ability to measure the turning point probability as well as the trend probabi
Bull versus Bear
Mohamed Hassan
4.5 (18)
Send us a message after your purchase to receive more information on how to get your  BONUS  for FREE  that works in great combination with Bull vs Bear ! Bull versus Bear is an easy-to-use Forex indicator that gives traders clear and accurate signals based on clear trend retests . Forget about lagging indicators or staring at charts for hours because  Bull vs Bear provides real-time entries with no lag and no repaint, so you can trade with confidence. Bull vs Bear  helps you enter trades during
Scalper Vault
Oleg Rodin
5 (37)
Scalper Vault è un sistema di scalping professionale che ti fornisce tutto il necessario per scalping di successo. Questo indicatore è un sistema di trading completo che può essere utilizzato dai trader di forex e opzioni binarie. L'intervallo di tempo consigliato è M5. Il sistema fornisce segnali di freccia accurati nella direzione della tendenza. Ti fornisce anche i segnali più alti e più bassi e i livelli di mercato di Gann. Gli indicatori forniscono tutti i tipi di avvisi, comprese le notifi
The Propfolio Master Suite is the ultimate all-in-one analytical workstation for professional traders. Combining the power of the Beat The Market Maker (BTMM) methodology, Smart Money Concepts (SND/Liquidity), and Advanced Volume Profile, this suite replaces multiple different indicators with one optimized engine. Monitor up to 14 pairs simultaneously from a single chart, instantly identify market cycles, and seamlessly map institutional footprints with the click of a button. The Command Center
Introduction Harmonic Patterns are best used to predict potential turning point. Traditionally, Harmonic Pattern was identified manually connecting peaks and troughs points in the chart. Manual harmonic pattern detection is painfully tedious and not suitable for everyone. You are often exposed under subjective pattern identification with manual pattern detection. To avoid these limitations, Harmonic Pattern Plus was designed to automate your harmonic pattern detection process. The functionality
Altri dall’autore
Algoritmo Lux per la media mobile Signal per MT5 Scopri un indicatore di media mobile unico, progettato specificamente per l'utilizzo della linea di segnale nei sistemi di crossover di media mobile. Questo strumento avanzato si differenzia divergendo dal prezzo nei mercati in range, mentre rispecchia fedelmente una media mobile standard nei mercati in trend. Questa caratteristica aiuta i trader a evitare rumore di fondo inutile e potenziale overtrading dovuto alle fluttuazioni del mercato. La
FREE
Chart Projection
Lorentzos Roussos
4.63 (43)
Indicatore di proiezione del grafico La proiezione del grafico è iniziata come un piccolo indicatore che utilizzava l'indicatore tecnico a zig zag integrato per prevedere l'azione futura dei prezzi (puoi trovare il vecchio algoritmo nei commenti) L'idea è semplice, l'azione dei prezzi passata non si traduce nel futuro ma forse se non diventiamo eccessivamente specifici o, eccessivamente generici, possiamo estrarre linee guida su ciò che potrebbe accadere. La "tesi" della proiezione del grafic
FREE
Indicatore di azione dei prezzi simili L'azione dei prezzi simile troverà sequenze passate di modelli di candele il più possibile simili a un'area del grafico che hai selezionato. L'indicatore eseguirà una ricerca a partire da subito prima della prima candela della regione di azione dei prezzi che hai selezionato fino alla prima barra più vecchia del grafico. Ci sono diversi criteri per valutare la somiglianza tra 2 sequenze: Le sequenze devono essere identiche in lunghezza, se la regione sel
Voenix Chart Pattern Scanner MT5
Lorentzos Roussos
4.83 (6)
Modelli armonici EA se preferisci vederlo su un grafico in tempo reale invece di leggere la descrizione,   puoi scaricare immediatamente una demo gratuita qui. Modelli inclusi: Modello ABCD Modello Gartley Modello pipistrello Modello cifrato 3Modello di guida Motivo cigno nero Motivo cigno bianco Motivo Quasimodo o Motivo Over Under Modello alternativo del pipistrello Motivo a farfalla Modello di granchio profondo Modello di granchio Modello di squalo Modello FiveO Modello testa e spalle Model
L'indicatore Flower è uno strumento di analisi tecnica utilizzato principalmente per identificare i trend e supportare le strategie di scalping o di trading intraday. L'indicatore Flower è un indicatore di trend basato sull'analisi tecnica e sulla dinamica dei prezzi. Segnala visivamente i trend utilizzando fiori colorati: i fiori blu indicano un trend rialzista, mentre i fiori rossi indicano un trend ribassista. Ogni livello può fungere da supporto e resistenza (osservare i livelli +/- 200 e
FREE
Voenix
Lorentzos Roussos
4.58 (12)
Modelli armonici ,scanner e trader Modelli inclusi: Modello ABCD Modello Gartley Modello pipistrello Modello cifrato 3Modello di guida Motivo cigno nero Motivo cigno bianco Motivo Quasimodo o Motivo Over Under Modello alternativo del pipistrello Motivo a farfalla Modello di granchio profondo Modello di granchio Modello di squalo Modello FiveO Modello testa e spalle Modello triangolo ascendente Uno due tre modello E 8 modelli personalizzati Voenix è uno scanner di pattern armonici multi timefram
Similar Price Action
Lorentzos Roussos
5 (1)
Indicatore di azione dei prezzi simili L'azione dei prezzi simile troverà sequenze passate di modelli di candele il più possibile simili a un'area del grafico che hai selezionato. L'indicatore eseguirà una ricerca a partire da subito prima della prima candela della regione di azione dei prezzi che hai selezionato fino alla prima barra più vecchia del grafico. Ci sono diversi criteri per valutare la somiglianza tra 2 sequenze: Le sequenze devono essere identiche in lunghezza, se la regione sel
Fibonacci Sonar
Lorentzos Roussos
Fibonacci Sonar Il sonar di Fibonacci ha una libreria interna di modelli di price action raccolti da 28 simboli e 7 timeframe. Ogni pattern è diviso in 2 lati. Il lato prima e il lato dopo. Il sonar di Fibonacci usa il lato prima per riconoscere pattern simili. Il price action più recente (in qualsiasi momento) fino al prezzo di apertura della barra più recente è ciò che viene usato come lato prima per cercare nella libreria. Il lato dopo contiene un aggregato di tutte le attività che ogni pat
Filtro:
MThetoy
162
MThetoy 2025.12.17 01:21 
 

L'utente non ha lasciato alcun commento sulla valutazione.

raypiscopo
105
raypiscopo 2025.12.12 11:41 
 

This developer is has produced the best free product for vwap and volume profile, I have ever seen. Way better than most paid products. Do yourself and the developer a favor and try it out. No joke, it's awesome!

fxpat
540
fxpat 2025.11.13 16:12 
 

L'utente non ha lasciato alcun commento sulla valutazione.

Stanislav Melnikov
868
Stanislav Melnikov 2025.09.18 17:36 
 

гут

5073095
96
5073095 2024.11.11 10:01 
 

ottimo prodotto ...grazie mille

[Eliminato] 2024.11.05 20:43 
 

L'utente non ha lasciato alcun commento sulla valutazione.

Fakhar Ul Islam
239
Fakhar Ul Islam 2024.09.23 13:42 
 

please tell me why it keep removed from chart

Lorentzos Roussos
49160
Risposta dello sviluppatore Lorentzos Roussos 2024.09.23 22:15
does it show any error in the experts tab?
Shane McDonald
393
Shane McDonald 2024.06.11 21:33 
 

Fantastic product!

sunnychow
9043
sunnychow 2024.05.31 09:42 
 

L'utente non ha lasciato alcun commento sulla valutazione.

jenaustria
259
jenaustria 2024.05.18 09:45 
 

L'utente non ha lasciato alcun commento sulla valutazione.

rovinades
430
rovinades 2024.05.17 12:36 
 

L'utente non ha lasciato alcun commento sulla valutazione.

Calix Fujimoto
467
Calix Fujimoto 2024.05.08 09:22 
 

L'utente non ha lasciato alcun commento sulla valutazione.

rene11
69
rene11 2024.01.16 00:56 
 

very good indicator , Lorentzos thank you

Dennis Dms
305
Dennis Dms 2021.11.22 11:35 
 

This is a must have, like Sierra Chart's TPO chart. Great levels.

Lorentzos Roussos
49160
Risposta dello sviluppatore Lorentzos Roussos 2022.01.22 08:02
Appreciated , thank you
Rispondi alla recensione