KT Auto Fibo
- Indicateurs
-
KEENBASE SOFTWARE SOLUTIONS
 Keenbase Trading développe des indicateurs professionnels et des Expert Advisors pour MetaTrader 4 et MetaTrader 5 afin d'aider les traders à prendre des décisions de trading plus éclairées.
 - Version: 1.20
- Mise à jour: 11 octobre 2026
- Activations: 10
Auto Fibonacci indicator that draws the Fibonacci retracement on the swing you are looking at, and redraws it the moment you zoom or scroll the chart.
Zoom in on a pullback and the levels measure that pullback. Zoom out and they measure the whole trend. There are no anchor points to drag and no levels to redraw after every new high.
Key features
- Measures the highest high and the lowest low on your screen, the current candle included.
- Follows zoom, scroll and window size at once, even when the market is closed.
- Reads the direction for you: a rising move when the low came first, a falling move when the high came first.
- Draws the 0%, 23.6%, 38.2%, 50%, 61.8%, 78.6% and 100% levels, each labelled with its price.
- Adds the 127.2% and 161.8% extension levels as dashed lines, as targets when the trend carries on.
- Shades the unretraced area, so you see how deep the pullback went and which part of the move is still untouched.
- Alerts you when the price reaches a Fibonacci level, once per level on each candle (optional).
- Manual mode draws the Fibonacci once and lets you drag its points; your Fibonacci stays through a timeframe change.
How to use it
Frame the last clear move and the pullback after it. In a rising market, a pullback that slows at 38.2%, 50% or 61.8% and turns back up is the classic Fibonacci entry. The 0% level is the first target and the extension levels are the next ones.
A stop loss beyond the next deeper level keeps the risk defined. In a falling market, read the levels the other way round.
Recommendations
It works on every symbol and timeframe in MetaTrader: forex pairs, gold, indices and crypto, from M1 to the monthly chart.
On H1 and H4 one screen usually holds a full impulse and its pullback, which gives the clearest levels. For extra confirmation, add the KT Support and Resistance Indicator and look for a Fibonacci level that lines up with a support or resistance level.
Input parameters
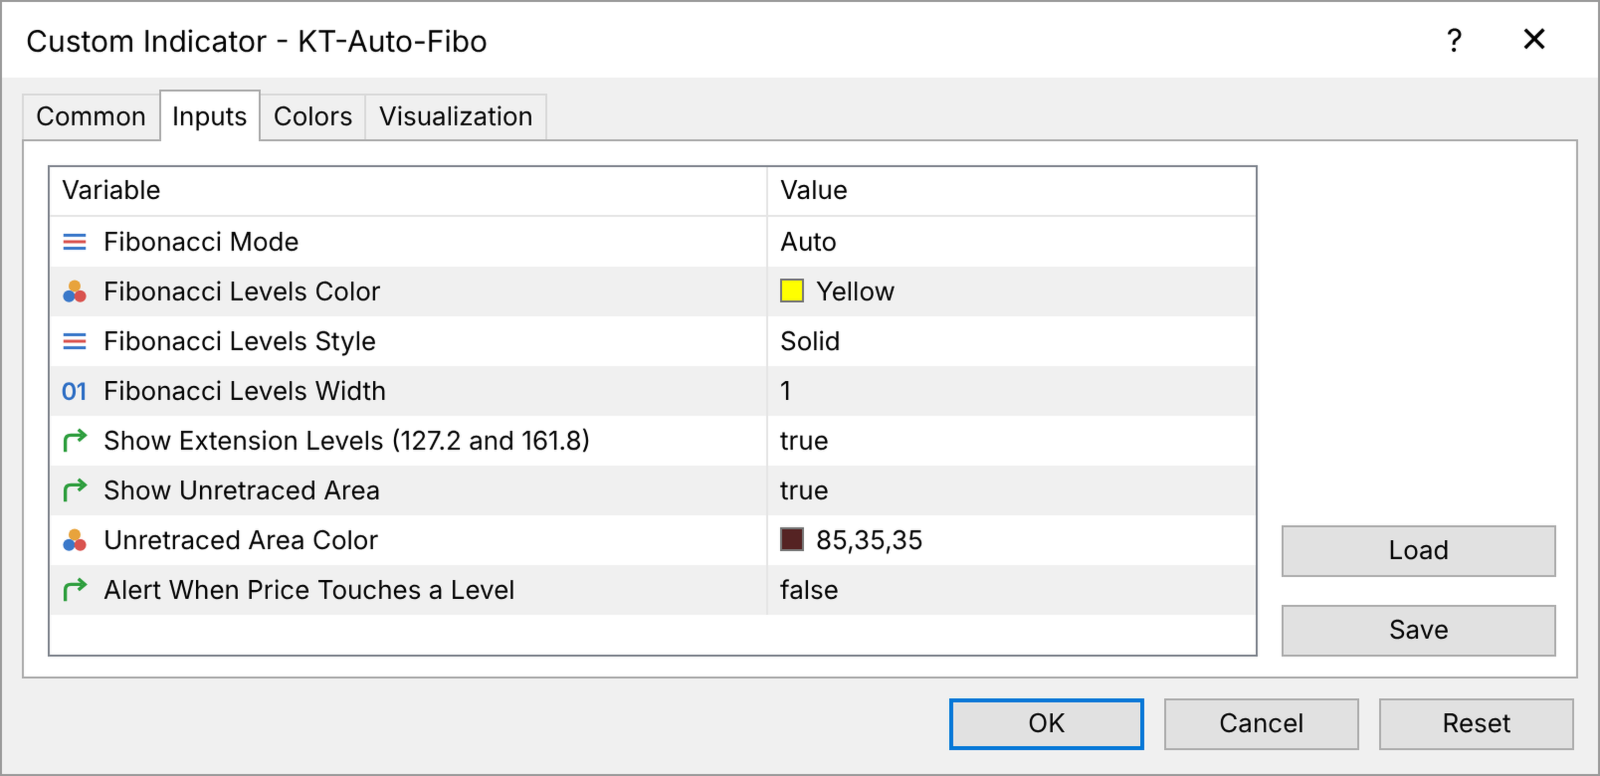
- Fibonacci Mode: Auto follows the visible chart; Manual draws once, then you move the points.
- Fibonacci Levels Color, Style, Width: how the levels look.
- Show Extension Levels (127.2 and 161.8): shows or hides the extension levels.
- Show Unretraced Area: shows or hides the shaded zone in Auto mode.
- Unretraced Area Color: the colour of the shaded zone.
- Alert When Price Touches a Level: an alert window when the price reaches a level.
Ready on every chart
Attach it, zoom to the swing you trade, and the Fibonacci is already measured on that swing, every time you look.