Visual CrossPulse Dynamics Indicator
- Indicateurs
- AL MOOSAWI ABDULLAH JAFFER BAQER
- Version: 1.0
- Activations: 5
Visual CrossPulse Dynamics: Trade with the Market's True Rhythm
Unlock a new level of market insight with Visual CrossPulse Dynamics, a sophisticated trading indicator designed to adapt to ever-changing volatility and reveal the true direction of the trend.
Are you tired of indicators that lag in fast-moving markets or give false signals during consolidation? The Visual CrossPulse Dynamics indicator solves this problem by using an advanced, adaptive algorithm that intelligently adjusts to the market's pulse, providing you with clearer, more reliable signals.
The Core Logic: An Intelligent, Adaptive System
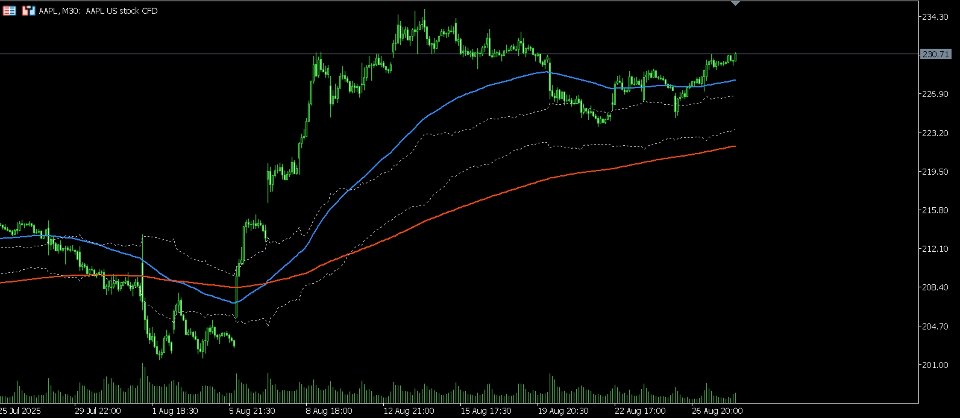
At the heart of the indicator are two dynamic lines—a fast line and a slow line. Unlike standard moving averages that use a fixed calculation period, our lines use a proprietary double-smoothing formula that dynamically adapts to market volatility.
Here is how it works:
-
Adaptive Volatility Factor: The indicator constantly measures market volatility using the Average True Range (ATR). It then calculates an adaptive factor based on changes in this volatility. When volatility increases, the indicator becomes more responsive to price, reducing lag. When the market is quiet, it becomes smoother to filter out insignificant noise.
-
Double Smoothed Calculation: Each dynamic line is calculated using a double exponential smoothing method. This advanced technique provides a much smoother and more reliable line than a simple or even a standard exponential moving average, helping you stay on the right side of the trend and avoid premature exits.
-
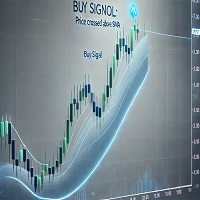
Volatility Bands: To complete the picture, the indicator includes optional Volatility Bands. These bands are calculated based on the ATR and expand or contract with market volatility. They provide an excellent visual guide for identifying potential breakout zones, setting profit targets, or recognizing when the market is overextended.
How to Trade with Visual CrossPulse Dynamics
This indicator is designed to be intuitive, making it suitable for both new and experienced traders.
-
Primary Buy Signal: A buy signal is generated when the fast, more responsive dynamic line (blue by default) crosses above the slow dynamic line (red by default). This indicates that bullish momentum is building.
-
Primary Sell Signal: A sell signal is generated when the fast dynamic line crosses below the slow dynamic line. This suggests that bearish momentum is taking control.
-
Trend Confirmation: When both lines are moving in the same direction and the distance between them is widening, it signals a strong and healthy trend.
-
Using the Volatility Bands:
-
Breakouts: When price breaks and closes outside the upper or lower band, it can signal the start of a strong move.
-
Profit Targets: The bands can act as dynamic price targets. For example, in an uptrend, the upper band can be a potential take-profit level.
-
Range Detection: When the bands contract and move sideways, it indicates a low-volatility environment, warning you to be cautious of ranging markets.
-
Key Benefits
-
Reduces Lag: The adaptive algorithm helps the indicator react more quickly to price changes in volatile markets.
-
Filters Noise: In calm markets, the smoothing increases to prevent false signals from minor price fluctuations.
-
Clear Visual Signals: The crossover of the two dynamic lines provides clean and easy-to-understand entry and exit points.
-
Built-in Volatility Analysis: The optional bands give you an immediate understanding of market volatility, helping you adapt your strategy on the fly.
-
Fully Customizable: Adjust periods, smoothing factors, and the volatility multiplier to perfectly match your trading style and the instrument you are trading.
Take your trading to the next level. Stop relying on static, lagging indicators and start trading in sync with the market's true dynamics.
Get your copy of Visual CrossPulse Dynamics today for just $30 and gain a powerful new edge in your trading.
