Scout Alpha

Spread Arbitrage Line คืออะไร

อินดิเคเตอร์ตัวนี้เป็นเครื่องมือสำหรับดู ส่วนต่างราคา (Spread) ระหว่าง

  • สินทรัพย์ที่เปิดกราฟอยู่
    กับ

  • สินทรัพย์อีกตัวที่เราเลือก

พูดง่าย ๆ คือช่วยให้เห็นว่า
ตอนนี้ราคาของ 2 สินทรัพย์ “ห่างกันมากหรือน้อย” กว่าปกติหรือไม่

เหมาะกับคนที่ดูคู่สัมพันธ์ของราคา เช่น

  • Pair Trading

  • Spread Trading

  • Arbitrage แนวสถิติ

  • การหาจังหวะที่ราคาสองตัวเบี่ยงออกจากกันมากเกินไป

อินดิเคเตอร์นี้ดูอะไรได้บ้าง

ตัวอินดิเคเตอร์จะมี 3 ส่วนหลัก

1) เส้น Spread

เป็นเส้นหลักของอินดิเคเตอร์
แสดงค่าความต่างของราคาสองสินทรัพย์

ถ้าเส้นขึ้นสูง
แปลว่า spread กว้างขึ้น

ถ้าเส้นลงต่ำ
แปลว่า spread แคบลง

2) เส้นช่วยตัดสินใจ

มีเส้นสำคัญที่ใช้ดูจังหวะ

Open Level

เป็นระดับที่ใช้มองว่า
spread กว้างพอสำหรับเริ่มเปิดแผนเทรดหรือยัง

Close Level

เป็นระดับที่ใช้มองว่า
spread กลับเข้ามาแล้วหรือยัง เหมาะสำหรับปิดแผน

Bollinger Band

ช่วยบอกว่า spread ตอนนี้อยู่

  • ใกล้ค่าเฉลี่ย

  • สูงเกินปกติ

  • ต่ำเกินปกติ

เหมาะสำหรับคนที่ใช้แนวคิด mean reversion
คือรอให้ spread เบี่ยงออกไปก่อน แล้วคาดหวังให้กลับเข้าหาค่าเฉลี่ย

Level Lines

เป็นเส้นแนวนอนเพิ่มเติม
ไว้กำหนดโซนสำคัญตามสไตล์ของผู้ใช้เอง

เช่น

  • โซนเบา

  • โซนเริ่มน่าสนใจ

  • โซนเข้ม

  • โซนเสี่ยงสูง

3) กล่องข้อมูลด้านขวา

ช่วยสรุปข้อมูลสำคัญแบบดูเร็ว

เช่น

  • spread ตอนนี้อยู่ที่เท่าไร

  • ค่าเฉลี่ย spread

  • ความผันผวนของ spread

  • spread ตอนนี้อยู่สูงหรือต่ำกว่าปกติมากแค่ไหน

  • ความสัมพันธ์ของสินทรัพย์ 2 ตัว

  • ค่า ATR ของแต่ละตัว

  • ค่าสวอป

  • ต้นทุนโดยประมาณต่อวัน

จุดนี้มีประโยชน์มาก เพราะช่วยให้ไม่ดูแค่ “กราฟสวย” แต่ดูเรื่อง ต้นทุนจริงของการถือ pair ด้วย

ใช้งานยังไงแบบง่าย ๆ

ขั้นตอนที่ 1 เปิดกราฟสินทรัพย์หลัก

เช่นเปิดกราฟ

  • XAUUSD

  • EURUSD

  • US30

  • BTCUSD

ตัวที่เปิดกราฟอยู่จะเป็น ตัวหลัก

ขั้นตอนที่ 2 เลือกสินทรัพย์ตัวที่ 2

ที่แผงด้านซ้ายจะมีช่องให้เลือก Symbol

สามารถเลือกได้ 2 แบบ

  • กดปุ่มซ้าย/ขวา เพื่อเลื่อนไปทีละตัว

  • กด dropdown เพื่อเลือกจากรายการ Market Watch

เมื่อเลือกแล้ว อินดิเคเตอร์จะคำนวณ spread ใหม่ทันที

ขั้นตอนที่ 3 ดูเส้น Spread เทียบกับระดับต่าง ๆ

หลักการใช้งานแบบง่ายคือ

  • ถ้า spread ยังอยู่ใกล้ค่าเฉลี่ยมาก → ยังไม่ค่อยมีระยะ

  • ถ้า spread ขยายออกไปไกล → เริ่มน่าสนใจ

  • ถ้า spread กลับเข้ามา → เป็นจังหวะปิดแผนได้

ปุ่มต่าง ๆ ใช้ทำอะไร

Pair

ใช้เลือกสินทรัพย์ตัวที่ 2 ที่จะเอามาเทียบกับกราฟหลัก

Open/Close ON-OFF

เปิดหรือปิดการแสดงเส้น

  • Open Level

  • Close Level

เหมาะสำหรับคนที่อยากดูเฉพาะ spread อย่างเดียว หรืออยากดูพร้อมระดับตัดสินใจ

BB Band ON-OFF

เปิดหรือปิด Bollinger Band ของ spread

ถ้าเปิด จะช่วยเห็นว่า spread กำลังอยู่ในโซนปกติหรือเริ่มสุดขอบ

Levels ON-OFF

เปิดหรือปิดเส้นระดับเพิ่มเติมที่ตั้งไว้

เหมาะกับคนที่ชอบแบ่งโซนการตัดสินใจหลายชั้น

ข้อมูลในกล่องด้านขวาหมายถึงอะไร

SPREAD STATISTICS

เป็นสถิติพื้นฐานของ spread

Current

ค่า spread ปัจจุบัน

Mean

ค่าเฉลี่ยของ spread ในช่วงที่คำนวณ

SD

ระดับการกระจายตัวของ spread
ยิ่งมาก แปลว่า spread แกว่งกว้าง

%Rank

บอกว่า spread ตอนนี้อยู่ในระดับสูงหรือต่ำเมื่อเทียบกับอดีต

ตัวอย่าง:

  • %Rank สูงมาก = spread อยู่โซนสูงเมื่อเทียบกับอดีต

  • %Rank ต่ำมาก = spread อยู่โซนต่ำ

Min / Max

จุดต่ำสุดและสูงสุดของ spread ในช่วงที่ใช้วิเคราะห์

ZONE / TIMING

เป็นส่วนช่วยดูจังหวะ

Z-Score

บอกว่า spread ตอนนี้ห่างจากค่าเฉลี่ยมากแค่ไหน

ยิ่งค่าเยอะ
ยิ่งแปลว่า spread เบี่ยงออกจากภาวะปกติมาก

BB %B

บอกตำแหน่ง spread ภายใน Bollinger Band

  • ใกล้กลาง = ปกติ

  • ใกล้ขอบ = เริ่มตึง

  • เกินขอบ = เบี่ยงมาก

Velocity

ความเร็วของ spread ในช่วงล่าสุด
ช่วยดูว่า spread กำลังเร่งตัวหรือเริ่มชะลอ

MR Duration

ค่าเฉลี่ยคร่าว ๆ ว่า spread ใช้เวลากี่แท่งในการกลับเข้าหาค่าเฉลี่ย

Correlation

ดูว่าราคาของสองสินทรัพย์สัมพันธ์กันมากแค่ไหน

ถ้าค่าสูง
มักเหมาะกับการจับ spread มากกว่า

Session

บอกช่วงตลาดปัจจุบัน เช่น Asia / London / New York
ช่วยให้รู้ว่าตอนนี้อยู่ในช่วงตลาดไหน

SYMBOL 1 / SYMBOL 2

เป็นข้อมูลของสินทรัพย์ทั้งสองฝั่ง

มีข้อมูลเช่น

  • Bid

  • Ask

  • Broker Spread

  • ATR

  • Swap Long

  • Swap Short

ช่วยให้ลูกค้าดูได้ว่าแต่ละตัว

  • สเปรดโบรกเกอร์กว้างไหม

  • ผันผวนแค่ไหน

  • ถือข้ามวันต้นทุนดีหรือไม่ดี

DAILY COST

ส่วนนี้สำคัญมากสำหรับสาย pair trade

Spread Cost

ต้นทุนจาก bid/ask ของทั้งสองฝั่งรวมกัน

Swap/Day

ต้นทุนหรือผลตอบแทนจากการถือข้ามวัน

Commission

ค่าคอมมิชชั่นรวมของคู่เทรด

TOTAL/Day

ต้นทุนรวมต่อวันโดยประมาณต่อ 1 lot pair

ส่วนนี้ช่วยให้ลูกค้ารู้ว่า
แม้ spread ดูสวย แต่ถ้าต้นทุนถือแพงเกิน ก็อาจไม่คุ้ม

ใช้อ่านสัญญาณแบบง่ายอย่างไร

แนวคิดง่าย ๆ สำหรับลูกค้า

กรณีที่ 1: Spread ขยายออกไปมาก

ถ้าเส้น spread วิ่งออกห่างจากค่าเฉลี่ยมาก
และไปอยู่ใกล้หรือเกิน BB ด้านบน/ล่าง

อาจตีความว่า

  • spread เริ่มเบี่ยงออกมากผิดปกติ

  • มีโอกาสกลับเข้า mean ได้ในอนาคต

เหมาะกับคนที่ใช้แนว mean reversion

กรณีที่ 2: Spread กลับเข้ามาใกล้ค่าเฉลี่ย

ถ้า spread เริ่มย่อกลับเข้ามา
อาจใช้เป็นโซนพิจารณาปิดแผน

กรณีที่ 3: Correlation ต่ำเกินไป

ถ้าสินทรัพย์สองตัวไม่ค่อยสัมพันธ์กัน
spread ที่เห็นอาจไม่นิ่งและตีความยาก

ดังนั้นคู่ที่ correlation สูงกว่ามักใช้งานได้เป็นธรรมชาติกว่า

กรณีที่ 4: ต้นทุนต่อวันสูง

แม้ spread จะดูดี
แต่ถ้า total/day สูงมาก

แปลว่า

  • ถือต่อมีภาระ

  • กลยุทธ์ต้องการการกลับตัวเร็วขึ้น

  • ถ้ากลับช้า อาจโดนต้นทุนกินกำไร

เหมาะกับใคร

อินดิเคเตอร์นี้เหมาะกับ

  • คนที่เทรดคู่สัมพันธ์ของราคา

  • คนที่ชอบหา spread ที่เบี่ยงจากค่าเฉลี่ย

  • คนที่ต้องการดูทั้ง “สัญญาณ” และ “ต้นทุน”

  • คนที่ต้องการเปรียบเทียบสินทรัพย์ 2 ตัวแบบรวดเร็วบนหน้าจอเดียว

จุดเด่นที่ลูกค้าควรรู้
  • เลือกคู่เทียบได้จากหน้าจอทันที

  • เห็น spread แบบเรียลไทม์

  • มีเส้น open / close ช่วยตัดสินใจ

  • มี Bollinger Band ช่วยดูความสุดโต่งของ spread

  • มีข้อมูล correlation, ATR, swap, cost ครบ

  • เหมาะกับการคัดคู่และวางแผน pair trading

ข้อควรเข้าใจ

อินดิเคเตอร์นี้ ไม่ใช่ระบบส่งคำสั่งอัตโนมัติ
แต่เป็นเครื่องมือช่วยวิเคราะห์

ดังนั้นลูกค้าควรใช้ร่วมกับ

  • แผนการเข้าออกที่ชัดเจน

  • การบริหาร lot

  • การดูต้นทุนจริงของโบรกเกอร์

  • การเลือกคู่ที่มีความสัมพันธ์เหมาะสม

What is Spread Arbitrage Line?

Spread Arbitrage Line is an indicator designed to display the price difference (spread) between:

  • the symbol on your current chart
    and
  • another symbol that you choose

In simple terms, it helps you see whether the relationship between two instruments is currently:

  • wider than usual
  • narrower than usual
  • returning back toward normal levels

This makes it useful for traders who work with:

  • Pair Trading
  • Spread Trading
  • Statistical Arbitrage
  • Mean Reversion setups
What does this indicator show?

The indicator has 3 main parts:

1) The Spread Line

This is the main line of the indicator.

It plots the difference between the current chart symbol and the second selected symbol.

When the line rises, it means the spread is expanding.
When the line falls, it means the spread is narrowing.

This helps traders quickly see when two instruments are moving away from each other or coming back together.

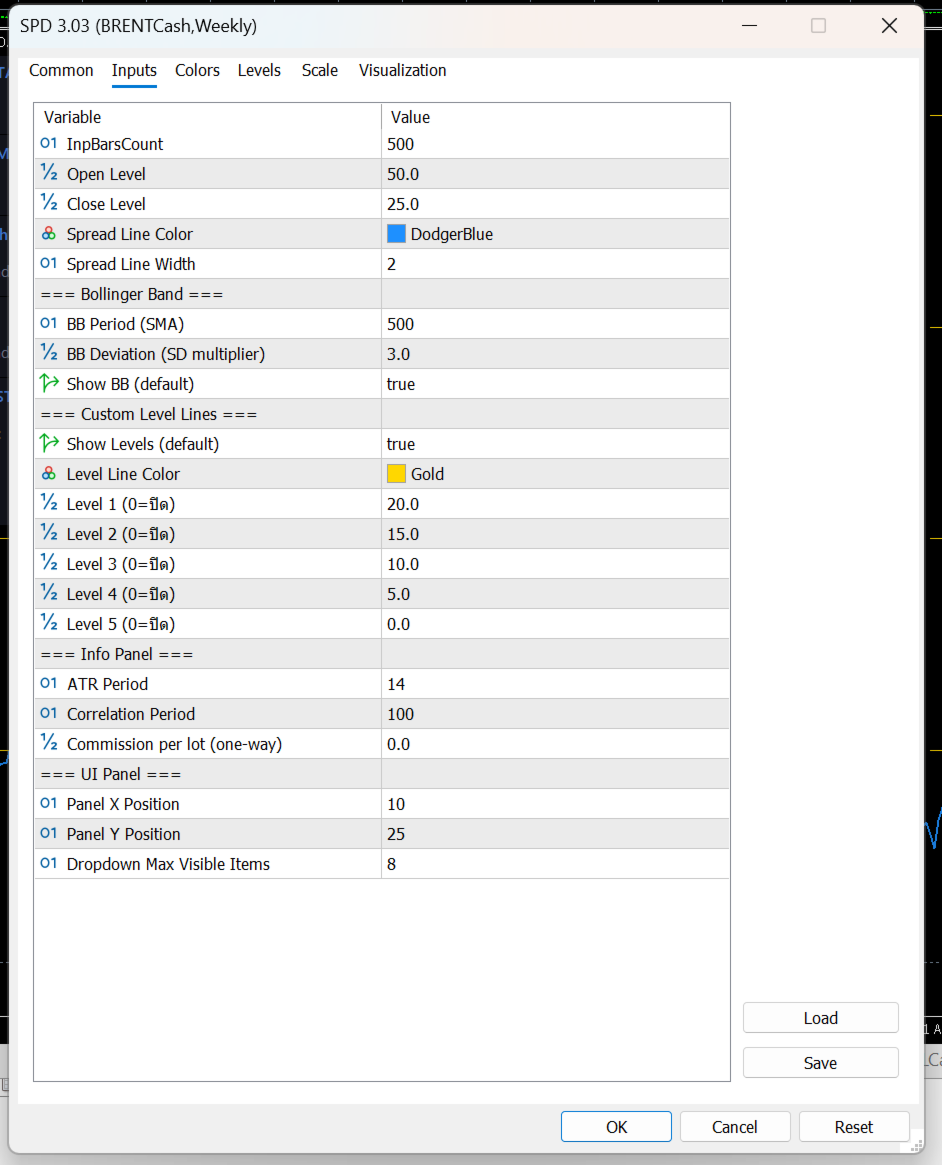
2) Decision Support Levels

The indicator also includes important reference lines to help with trade planning.

Open Level

This is the level used to identify when the spread has moved far enough to consider opening a spread or pair trade setup.

Close Level

This is the level used to identify when the spread has reverted enough to consider closing the setup.

Bollinger Bands

The Bollinger Bands help show whether the spread is:

  • near its normal range
  • stretched higher than usual
  • stretched lower than usual

This is especially useful for traders using a mean reversion approach, where the idea is to wait for the spread to move away from normal and then look for it to return.

Custom Level Lines

These are additional horizontal levels that can be used as personal reference zones.

For example, they can help define:

  • mild deviation
  • moderate deviation
  • strong deviation
  • extreme zones

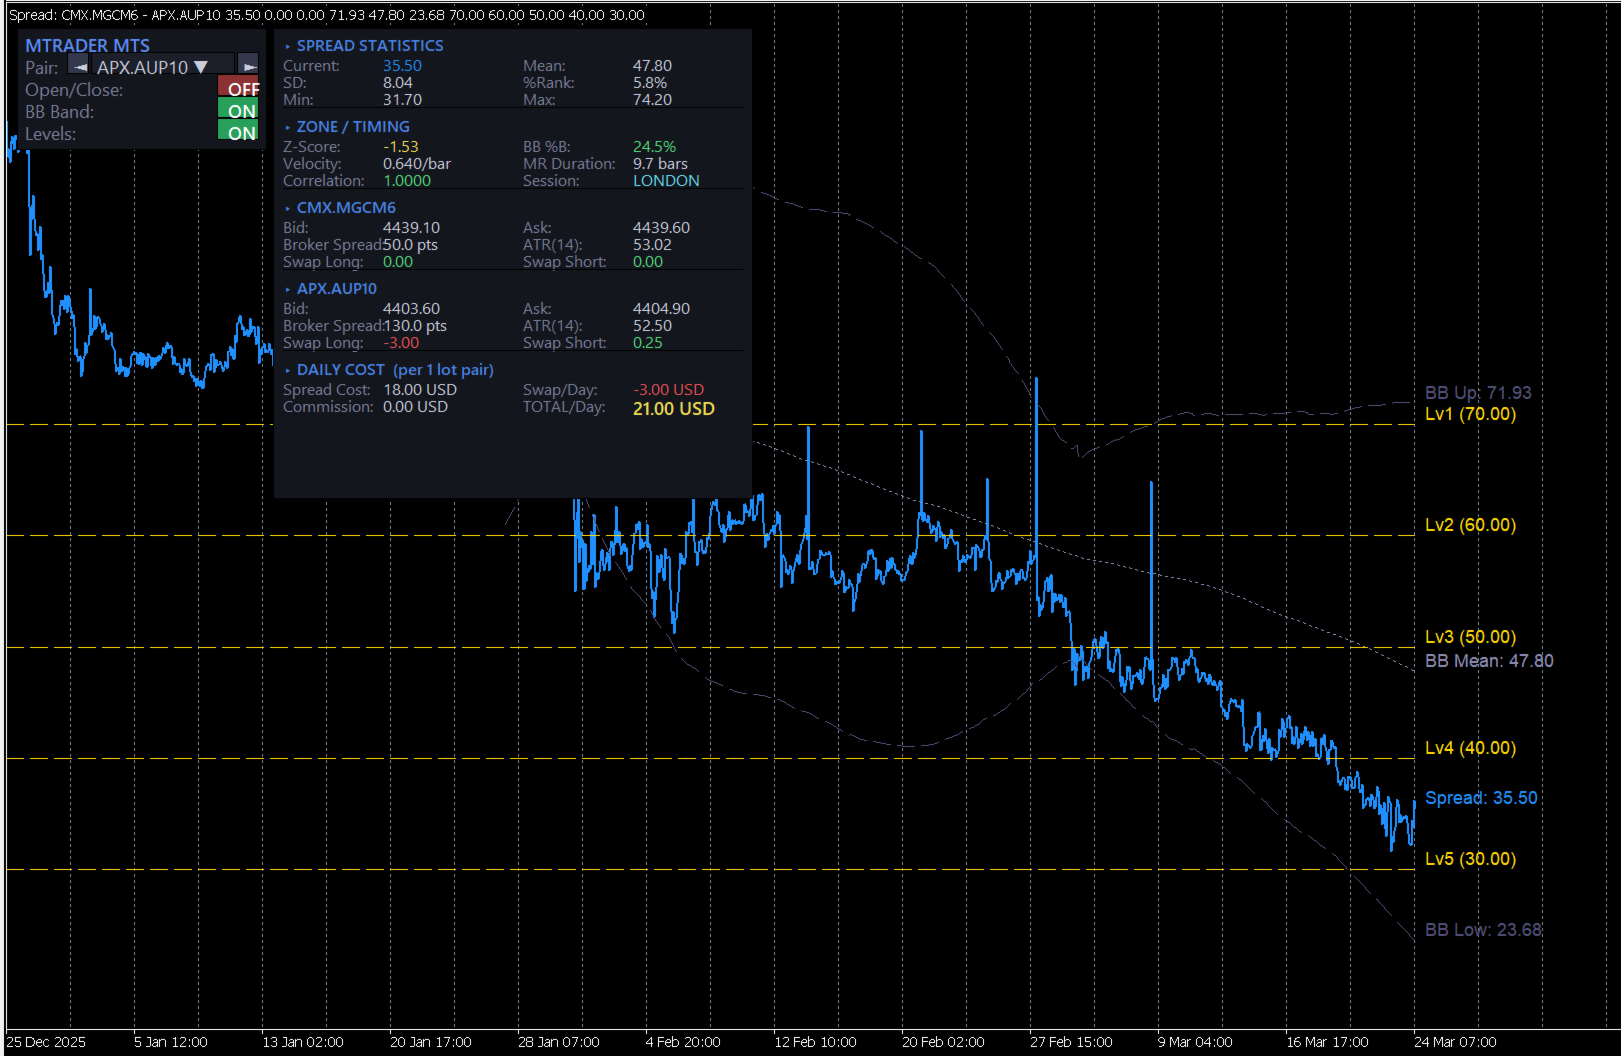
3) The Information Panel

On the right side, the indicator displays a full information panel with key trading statistics.

This includes:

  • current spread value
  • average spread
  • spread volatility
  • how far the current spread is from its usual range
  • correlation between the two symbols
  • ATR of both symbols
  • swap values
  • estimated daily holding cost

This is very helpful because it allows the trader to evaluate not only the setup itself, but also the real cost of holding the pair.

How to use it

Step 1: Open the main chart

Open the chart of the instrument you want to use as the main symbol.

Examples:

  • XAUUSD
  • EURUSD
  • BTCUSD
  • US30

The chart you open becomes Symbol 1.

Step 2: Choose the second symbol

On the left control panel, you can choose another symbol to compare against.

You can do this by:

  • clicking the left/right buttons
    or
  • opening the dropdown list and selecting from Market Watch

Once selected, the indicator recalculates the spread automatically.

Step 3: Watch the spread relative to the levels

The basic idea is simple:

  • if the spread is near its average, there may be less opportunity
  • if the spread moves far away from normal, it may become interesting
  • if the spread starts returning, it may be a possible exit zone
What do the buttons do?

Pair

This allows you to select the second symbol used for comparison.

Open/Close ON-OFF

This turns the Open Level and Close Level lines on or off.

Useful for traders who either want:

  • a clean spread-only view
    or
  • full entry/exit guidance on the chart

BB Band ON-OFF

This turns Bollinger Bands on or off.

When enabled, it helps show whether the spread is inside its normal range or moving into an extreme zone.

Levels ON-OFF

This turns the custom reference levels on or off.

Useful for traders who want multiple decision zones on the indicator.

What does the information panel mean?

SPREAD STATISTICS

This section shows the main statistics of the spread.

Current

The current spread value.

Mean

The average spread over the calculation period.

SD

The standard deviation of the spread.

A higher value means the spread has been moving more widely.

%Rank

This shows where the current spread stands compared to its historical range.

For example:

  • a high %Rank means the spread is relatively high versus recent history
  • a low %Rank means the spread is relatively low

Min / Max

The lowest and highest spread values within the selected lookback period.

ZONE / TIMING

This section helps evaluate timing.

Z-Score

Shows how far the current spread is from its average.

The larger the absolute value, the more unusual the spread currently is.

BB %B

Shows where the current spread sits inside the Bollinger Band structure.

  • near the middle = normal
  • near the edge = stretched
  • beyond the band = extreme

Velocity

Shows how fast the spread is moving over recent bars.

This helps identify whether the spread is accelerating or slowing down.

MR Duration

This is an estimate of how many bars the spread usually takes to revert around its mean.

Correlation

Shows how strongly the two instruments move in relation to each other.

Higher correlation is generally more suitable for spread-style analysis.

Session

Displays the current market session, such as:

  • Asia
  • London
  • New York

This helps traders understand which trading period they are currently in.

SYMBOL 1 / SYMBOL 2

These sections show real-time information for both instruments.

They include:

  • Bid
  • Ask
  • Broker Spread
  • ATR
  • Swap Long
  • Swap Short

This helps traders evaluate each symbol individually in terms of:

  • trading cost
  • volatility
  • overnight holding conditions

DAILY COST

This section is very important for pair traders.

Spread Cost

The estimated transaction cost from the bid/ask spread of both symbols combined.

Swap/Day

The overnight swap impact of holding the pair.

Commission

The commission cost for both sides of the pair.

TOTAL/Day

The estimated total daily holding cost for a 1-lot pair position.

This is useful because even if a spread setup looks attractive, the daily holding cost may still make it less practical.

How to read it in a simple way

Case 1: The spread moves far away from normal

If the spread line moves strongly away from its average and approaches or exceeds the Bollinger Band edges, it may suggest that the spread is unusually stretched.

For mean reversion traders, this may be a zone worth monitoring.

Case 2: The spread comes back toward the mean

If the spread starts moving back toward normal levels, this may be considered a possible exit area.

Case 3: Correlation is too low

If the two symbols are not closely related, the spread may be less stable and harder to interpret.

Pairs with stronger correlation are usually more natural candidates for this kind of analysis.

Case 4: Daily cost is too high

Even if the spread setup looks good, high daily cost can reduce the attractiveness of the trade.

This means the setup may require faster mean reversion, otherwise costs may eat into the result.

Who is this indicator for?

This indicator is suitable for traders who:

  • compare two correlated markets
  • trade spread or pair opportunities
  • look for mean reversion setups
  • want both visual signals and cost analysis in one place
Main advantages
  • Easy symbol selection directly from the chart
  • Real-time spread visualization
  • Open and Close reference levels
  • Bollinger Bands for spread extremes
  • Correlation, ATR, swap, and cost information included
  • Useful for pair selection and spread trade planning
Important note

This indicator is not an automatic trading system.

It is a decision-support tool designed to help analyze spread opportunities.

It works best when used together with:

  • a clear entry and exit plan
  • position sizing rules
  • broker cost awareness
  • proper pair selection


Produits recommandés
Multi Symbol Trailing
Vladimir Karputov
5 (1)
L'utilitaire "   Multi Symbol Trailing   " déplace le Stop Loss pour toutes les positions actuellement ouvertes (multi-symbol trailing). Il est principalement destiné à aider au trading manuel. Il n'y a aucune restriction pour l'utilitaire, que ce soit par le nom de la paire de devises ou par l'identifiant individuel (numéro magique) - l'utilitaire traite absolument toutes les positions actuellement ouvertes. L'unité de mesure des paramètres «   Trailing Stop   » et «   Trailing Step   » est le
Divergent Stochastic Filter II Catch Reversals Early, Filter Noise, Trade with Confidence The Edge: Why This Stochastic is Different  Every trader knows the Stochastic oscillator. But knowing when to trust its signals, that's the real challenge. The Divergent Stochastic Filter II transforms this classic indicator into a precision reversal detection system by adding critical elements: divergence intelligence, signal filtering and exhaustion detection.  While standard Stochastic oscillators fire s
Quantum Channel Pro est un outil révolutionnaire d'analyse de volatilité multicanal conçu pour identifier les tendances, les points de retournement et le bruit du marché. Grâce à des canaux d'écart-type adaptatifs, il trace trois niveaux (interne, moyen et externe) pour aider les traders à prendre des décisions plus précises. Fonctionnalités clés: Trois canaux intelligents (1σ, 2σ, 3σ) Statistiques de probabilité en temps réel Filtrage adaptatif du bruit Compatible avec tous les horizons tempore
Visual Silver Turn Indicator
AL MOOSAWI ABDULLAH JAFFER BAQER
Empower Your Trading with the Visual Silver Turn Indicator! The Visual Silver Turn Indicator is designed to identify pivotal market turning points with precision. By analyzing price action dynamics and trend shifts, this indicator provides traders with an intuitive tool to locate potential reversal zones and opportunities. Perfect for traders looking to gain insights into market behavior, the Visual Silver Turn Indicator is an essential addition to your trading arsenal. Logic Behind the Strateg
DominoSync DoubleSix
Andres Felipe Carvajal Rodriguez
DominoSync DoubleSix : Un Indicateur Avancé pour des Signaux de Trading Fiables DominoSync DoubleSix est un indicateur avancé qui aide les traders à identifier des signaux d'entrée plus fiables en analysant plusieurs temporalités et en filtrant les bougies à faible volume ou à la fourchette atypique. Les signaux d'entrée sont affichés dans l' histogramme de l'indicateur , ce qui permet une analyse plus claire et moins intrusive sur le graphique des prix. Ce Qui Rend DominoSync DoubleSix Unique A
POC Delta Order Blocks is a rule-based order block and volume-delta indicator designed to help traders clearly understand where real trading activity happened and how price reacts around those zones . Instead of drawing generic candle-based blocks, this indicator uses a Point of Control (POC) approach to identify the most actively traded price level between a swing high/low and a confirmed Break of Structure (BOS). The order block is then anchored to the earliest valid candle that interacted wit
Indicator shows balance curves based on magic number for portfolio analysis. It allows to visually estimate different strategies performance on a single symbol. Any of magic number can be hidden by clicking on the value in legend. Parameters: HideAllOnStart - all magics are hidden and can be activated by clicking on its value; MAMode - shows average profit from trades; MAPeriod - Moving average period; Magics - a string with magic numbers separated by comma like "1,2,123". If this field is empty
TradePilotmt5
Hossein Khalil Alishir
TradePilot Expert Advisor (EA) for MetaTrader 5 TradePilot is a professional and user-friendly Expert Advisor (EA) for MetaTrader 5 (MT5) . It simplifies automated trading , risk management , and trade execution with a smart trading panel . Perfect for beginners and experienced traders looking for a reliable trade manager EA with automated lot size calculation and smart position management. Key Advantages User-Friendly Trading Panel: Customizable panel with buttons and hotkeys for fast ex
The Techno Deity — Dominance Numérique sur XAUUSD Promo : Recevez l'expert Cryon X-9000 en cadeau. Contactez-moi pour les conditions. The Techno Deity est un écosystème de trading haute technologie pour le marché de l'or. Son algorithme identifie les zones d'intérêt institutionnel pour des entrées précises avec un drawdown minimal. Avantages Intelligence de Liquidité : Détecte les zones explosives. Filtre de Tendance Neural : Élimine le bruit du marché. Zéro Grille : Pas de martingale ni de gril
PROMO: ONLY 10 LEFT AT $90! Next price:        $199 Price will be kept high to limit number of users for this strategy. This EA starts trading at the open of   London (UK) Session . It is based on analysis of advanced statistical distributions combined with short to medium term reversal patterns which have mean-reversion attributes. The EA includes several smart features and allows you to trade with a fixed or automatic lot size. The EA is not sensitive to spreads but can be backtested on both
RBreaker
Zhong Long Wu
RBreaker Gold Indicators est une stratégie de trading intraday à court terme pour les contrats à terme sur l'or, qui combine deux approches : le suivi de tendance et le retournement intraday. Elle permet non seulement de capturer les profits dans les marchés en tendance, mais aussi de prendre des bénéfices en temps opportun lors des retournements de marché et d'ouvrir une position en sens inverse. Cette stratégie a été classée pendant 15 années consécutives parmi les dix stratégies de trading l
Bober Real MT5
Arnold Bobrinskii
4.76 (17)
Bober Real MT5 is a fully automatic Forex trading Expert Advisor. This robot was made in 2014 year and did a lot of profitbale trades during this period. So far over 7000% growth on my personal account. There was many updates but 2019 update is the best one. The robot can run on any instrument, but the results are better with EURGBP, GBPUSD, on the M5 timeframe. Robot doesn't show good results in tester or live account if you run incorrect sets. Set files for Live accounts availible only for cu
PipFinite Trend PRO MT5
Karlo Wilson Vendiola
4.84 (558)
Breakthrough Solution For Trend Trading And Filtering With All Important Features Built Inside One Tool! Trend PRO's smart algorithm detects the trend, filters out market noise and gives entry signals with exit levels. The new features with enhanced rules for statistical calculation improved the overall performance of this indicator. Important Information Revealed Maximize the potential of Trend Pro, please visit www.mql5.com/en/blogs/post/713938 The Powerful Expert Advisor Version Automatin
Laguerre SuperTrend Clouds   adds an Adaptive Laguerre averaging algorithm and alerts to the widely popular SuperTrend indicator. As the name suggests,   Laguerre SuperTrend Clouds (LSC)   is a trending indicator which works best in trendy (not choppy) markets. The SuperTrend is an extremely popular indicator for intraday and daily trading, and can be used on any timeframe. Incorporating Laguerre's equation to this can facilitate more robust trend detection and smoother filters. The LSC uses the
Rainbow EA MT5
Jamal El Alama
Description : Rainbow EA MT5 is a simple Expert advisor based on   Rainbow MT5 indicator witch is based on Moving average with period 34. The indicator is incorporated in the EA, therefore, it is not required for the EA to operate, but if you wish, you can download it from   my product page . The Expert Advisor settings are as follows : Suitable for Timeframes up to H1 The parameters below can be set according to your trading rules. StopLoss ( Stop Loss in pips) TakeProfit ( Take Profit in pips
# Equity Monitor Pro  ## Short Description Equity Monitor Pro is a professional equity p**Equity Monitor Pro** is a powerful risk management tool that automatically protects your trading account by monitoring equity levels and enforcing prop firm style rules. Whether you're taking an FTMO challenge, trading a funded account, or just want to protect your capital, this EA runs silently alongside your trading strategy and takes action when it matters most. Protection tool designed for prop firm
RED ZONE Monitor Loss-Cut & Break-Even Risk Monitor for Averaging Traders (MT5) RED ZONE Monitor is a risk management indicator for traders who use averaging, scaling-in, or multiple open positions . It visually displays: The loss-cut (liquidation) risk zone The break-even price Based on current open positions, lots, and margin conditions This indicator does not provide entry signals. It does not promise profits. It shows where your account actually fails if price moves against you. What RED ZO
Achetez cet indicateur et vous pourriez obtenir ICT Concept MT5 ou n'importe quel autre indicateur gratuitement ! Demandez en privé pour plus de détails ! Indicateur : Currency Strength Meter Pro Visualisation de la profondeur du marché Avantages : Remplace les graphiques encombrés par un "Tableau de bord" clair. Identifiez instantanément les paires fortes et faibles. Bénéfices : Gain de temps et prise de décision plus rapide. Classement et tri automatique Avantages : Trie automatiquement les
Visual CrossPulse Dynamics Indicator
AL MOOSAWI ABDULLAH JAFFER BAQER
Visual CrossPulse Dynamics: Trade with the Market's True Rhythm Unlock a new level of market insight with Visual CrossPulse Dynamics, a sophisticated trading indicator designed to adapt to ever-changing volatility and reveal the true direction of the trend. Are you tired of indicators that lag in fast-moving markets or give false signals during consolidation? The Visual CrossPulse Dynamics indicator solves this problem by using an advanced, adaptive algorithm that intelligently adjusts to the m
Advanced Trading Chaos  The main purpose of the indicator is to help the trader detect the signals described by Bill Williams in his books to make a quick and correct trading decision. 1)Bullish/Bearish Reversal Bar(BDB) 2) Divergent Bar(DB) 3) Second Sage Signal — the third consecutive Awesome Oscillator bar  4) Working fractals (Fractals that worked above/below the red forehead  5) Three bar coloring modes 5.1) Coloring of bars according to the AO indicator (Including the squatting bar) 5.2
Trend Lines Scalper
Magdalena Estefania Colonna
TREND LINES Scalper Professional Indicator OVERVIEW Trend Lines Scalper is a highly accurate, advanced indicator designed specifically for professional traders looking to maximize their scalping opportunities by automatically detecting trend lines and high-probability signals. This powerful algorithm combines classic technical analysis with modern technology, automatically identifying price patterns and generating accurate, real-time signals for successful scalping trades. MAIN FEATURES
Visual River Flow Divergence Indicator
AL MOOSAWI ABDULLAH JAFFER BAQER
Introducing the River Flow Divergence Indicator Are you ready to unlock your trading potential? Meet the River Flow Divergence Indicator, a powerful tool designed to help you navigate market trends and reversals with precision. This indicator is tailored for traders who are eager to fine-tune their strategies and take control of their success. Note: This indicator is not optimized out of the box. It’s crafted for you to customize and optimize according to your unique trading style and goals. Ho
STRICTLY FOR BOOM INDEX ONLY!!!!! Here I bring the Maximum Trend Arrows OT1.0 MT5 indicator. This indicator is made up of a combination of different trend indicators for entries and exits, for entries an orange arrow will paint on the chart below the current market and a red flag for closing of trades and it produces buy arrows only. When the orange arrow appears, it will appear along with it's sound to notify you. The 1H timeframe is recommended, don't use it anywhere else than on the 1H timefr
SolarTrade Suite Financial Robot: LaunchPad Market Expert - conçu pour ouvrir des transactions ! Il s'agit d'un robot de trading qui utilise des algorithmes spéciaux innovants et avancés pour calculer ses valeurs, votre assistant dans le monde des marchés financiers. Utilisez notre ensemble d'indicateurs de la série SolarTrade Suite pour mieux choisir le moment de lancer ce robot. Découvrez nos autres produits de la série SolarTrade Suite en bas de la description. Vous souhaitez naviguer en
Net Exposure & Net Average Price is a lightweight utility Expert Advisor for MetaTrader 5 hedge accounts . This tool helps traders instantly understand their true market exposure when multiple Buy and Sell positions are open on the same symbol. What the EA Does The EA displays a clear on-chart panel showing: Total Buy Trades Total Buy Lots Total Sell Trades Total Sell Lots Net Lots (Net Exposure) Net Average Price (hedge-adjusted breakeven) The Net Average Price represents the true breakeven
Step into the world of Forex trading with confidence, clarity, and precision using Gold Indicator a next-generation tool engineered to take your trading performance to the next level. Whether you’re a seasoned professional or just beginning your journey in the currency markets, Gold Indicator equips you with powerful insights and help you trade smarter, not harder. Built on the proven synergy of three advanced indicators, Gold Indicator focuses exclusively on medium and long-term trends elimina
>>> MEGA SALE: -40% OFF!  - Promo price: $99 / Regular price $169 <<< - The promotion will end soon! Forex Trend Hunter Live Results: https://www.mql5.com/en/signals/2302404 Forex Trend Hunter is an entirely automated trading system for the MetaTrader 4 trading terminal, developed especially for the needs of ordinary forex traders, yet also used successfully by many professional traders. Forex Trend Hunter is perhaps the best trend-following and long-term profitable Forex robot on the market.
Gold Trade Manager PRO – Trade Management Panel for MetaTrader 5 Gold Trade Manager PRO is a trade management utility for MetaTrader 5 that allows traders to open and manage positions directly from the chart using a trading panel. The tool is designed to simplify manual trading by providing faster order execution, risk-based position sizing and position management functions in a single interface. Instead of manually calculating lot sizes and adjusting trade parameters through multiple terminal
Super Trend Trading View 5
Mohammad Taher Halimi Tabrizi
The SuperTrend indicator is a popular technical analysis tool used by traders and investors to identify trends in the price of a financial instrument, such as a stock, currency pair, or commodity. It is primarily used in chart analysis to help traders make decisions about entering or exiting positions in the market. this version of super trend indicator is exactly converted from trading view to be used in MT5
Overview: Elevate your trading strategy with the Advanced SuperTrend Buy Sell Signals Indicator! Designed for both novice and professional traders, this indicator provides clear and accurate buy/sell signals based on the popular SuperTrend algorithm, enhanced with customizable parameters and visual alerts. Features: Clear Trend Visualization: Identifies UpTrends (green line) and DownTrends (red line) with precision. Customizable Parameters: Adjust ATR period and multiplier to fit your trading s
Les acheteurs de ce produit ont également acheté
ARICoins
Temirlan Kdyrkhan
ARICoin is a powerful trading companion designed to generate high-probability entry signals with dynamic TP/SL/DP levels based on volatility. Built-in performance tracking shows win/loss stats, PP1/PP2 hits, and success rates all updated live. Key Features: Buy/Sell signals with adaptive volatility bands Real-time TP/SL/DP levels based on ATR Built-in MA Filter with optional ATR/StdDev volatility Performance stats panel (Success, Profit/Loss, PP1/PP2) Alerts via popup, sound, push, or email Cust
CGE Trading Suite
Carl Gustav Johan Ekstrom
5 (1)
CGE Trading Suite delivers the analytical edge typically reserved for professional trading desks. The platform integrates a full suite of analytical tools into one seamless workflow: dynamic grid mapping, liquidity behavior analysis, ECM, trend lines, MIDAS, trade cycles, and directional channel projections. Together, these provide a unified view of market structure and momentum. Directional clarity is further enhanced by the capital flow index, which measures currency basket strength to identif
AriX
Temirlan Kdyrkhan
1 (4)
AriX Indicator for MT5 A powerful trend-following and signal-evaluation tool AriX is a custom MT5 indicator that combines Moving Averages and ATR-based risk/reward logic to generate clear buy/sell signals. It visualizes dynamic SL/TP levels, evaluates past trade outcomes, and displays win/loss statistics in a clean on-chart panel. Key features include: Buy/Sell signals based on MA crossovers ATR-based SL/TP1/TP2/TP3 levels with visual lines and labels Signal outcome tracking with real-time stat
Outil des market makers. Meravith va : Analyser toutes les unités de temps et afficher la tendance actuellement en vigueur. Mettre en évidence les zones de liquidité (équilibre des volumes) où le volume haussier et baissier est égal. Afficher tous les niveaux de liquidité provenant de différentes unités de temps directement sur votre graphique. Générer et présenter une analyse de marché sous forme de texte pour votre référence. Calculer les objectifs, les niveaux de support et les points de stop
OmniSync Projection
Antonio-alin Teculescu
5 (1)
Chronos Fractal Engine is an innovative price projection indicator for MetaTrader 5, designed to transform your technical analysis by intelligently identifying and projecting historical price patterns. Built upon an advanced correlation algorithm and the fractal principles of the market, this powerful tool visualizes potential future price movements, giving you a unique edge in your trading decisions. What is Chronos Fractal Engine? At its core, the Chronos Fractal Engine employs a sophisticat
ARIPoint
Temirlan Kdyrkhan
ARIPoint is a powerful trading companion designed to generate high-probability entry signals with dynamic TP/SL/DP levels based on volatility. Built-in performance tracking shows win/loss stats, PP1/PP2 hits, and success rates all updated live. Key Features: Buy/Sell signals with adaptive volatility bands Real-time TP/SL/DP levels based on ATR Built-in MA Filter with optional ATR/StdDev volatility Performance stats panel (Success, Profit/Loss, PP1/PP2) Alerts via popup, sound, push, or email Cu
L'indicateur « Dynamic Scalper System MT5 » est conçu pour la méthode de scalping, permettant de trader au sein des vagues de tendance. Testé sur les principales paires de devises et l'or, il est compatible avec d'autres instruments de trading. Fournit des signaux pour l'ouverture de positions à court terme le long de la tendance, avec un support supplémentaire pour les fluctuations de prix. Principe de l'indicateur : De grandes flèches déterminent la direction de la tendance. Un algorithme de
SunSignal ML — AI Gold Signals with Multi-Timeframe Confluence SunSignal ML is an advanced AI-powered signal indicator purpose-built for XAUUSD gold trading. It combines a proprietary adaptive trend algorithm with six machine learning models trained on confirmed price pivots to produce high-confidence entry signals with multi-timeframe validation. The indicator runs efficiently on M1, M5 and M15 timeframes and is designed for traders who want precision entries guided by data rather than guesswor
ARIScalping
Temirlan Kdyrkhan
ARIScalp is a powerful trading companion designed to generate high-probability entry signals with dynamic TP/SL/DP levels based on volatility. Built-in performance tracking shows win/loss stats, PP1/PP2 hits, and success rates all updated live. Key Features: Buy/Sell signals with adaptive volatility bands Real-time TP/SL/DP levels based on ATR Built-in MA Filter with optional ATR/StdDev volatility Performance stats panel (Success, Profit/Loss, PP1/PP2) Alerts via popup, sound, push, or email Cus
L’indicateur met en évidence les zones où un intérêt est déclaré sur le marché , puis montre la zone d’accumulation des ordres . Il fonctionne comme un carnet d’ordres à grande échelle . C’est l’indicateur destiné aux grands capitaux . Ses performances sont exceptionnelles. Quel que soit l’intérêt présent sur le marché, vous le verrez clairement . (Il s’agit d’une version entièrement réécrite et automatisée – l’analyse manuelle n’est plus nécessaire.) La vitesse de transaction est un indicateur
TrendMaestro5
Stefano Frisetti
note: this indicator is for METATRADER4, if you want the version for METATRADER5 this is the link:  https://www.mql5.com/it/market/product/108106 TRENDMAESTRO ver 2.5 TRENDMAESTRO recognizes a new TREND from the start, he never makes mistakes. The certainty of identifying a new TREND is priceless. DESCRIPTION TRENDMAESTRO identifies a new TREND in the bud, this indicator examines the volatility, volumes and momentum to identify the moment in which there is an explosion of one or more of these da
Weis Wave with Alert MT5
Trade The Volume Waves Single Member P.C.
4.94 (17)
Rental/Lifetime Package Options and Privileges  Rent Monthly Six Months   Yearly/Lifetime Weis Wave with Speed with Alert+Speed Index x x x Manual  x x x Quick Set up Video x x x Blog x x x Lifetime Updates x x x Setup and Training Material x x Discord Access Channel "The SI traders"          x Rectangle Break Alert Tool      x How to trade with it:    http://www.tradethevolumewaves.com   ** If you purchase please contact me to setup your  : Training Room and  complete manual access.  Wei
Rtc ML Ai Predictor
Muhammad Faisal Sagala
Rtc ML Ai | Predictor CORE MACHINE LEARNING ENGINE Adaptive ML Market Predictor – Multi-Bar Trend & Candle Forecast What This Indicator Does This indicator is a  real-time market prediction engine  designed to analyze price behavior and estimate  future market tendencies . Unlike conventional indicators, this system  does not rely on static parameters or historical curve-fitting , but adapts its internal state dynamically during live market operation. Instead of using static rules, the indic
Max Ribbon Mt5
Stefano Frisetti
WARNING: This indicator is distributed EXCLUSIVELY on MQL5.com MT4 version:   https://www.mql5.com/it/market/product/160363 MT5 version:   https://www.mql5.com/it/market/product/160410 ============================================================================================= MAX RIBBON ver 1.00 The indicator that shows you the TREND clearly and unambiguously! ============================================================================================= DESCRIPTION MAX RIBBON is an advanced tre
Big Player Range
Thalles Nascimento De Carvalho
5 (3)
BigPlayerRange – Meilleur indicateur pour MT5 BigPlayerRange est considéré comme le meilleur indicateur pour le Mini Indice et le Mini Dollar sur MetaTrader 5. Cet outil met en évidence les zones stratégiques d’action des gros acteurs du marché, offrant une analyse technique institutionnelle d’une grande précision. Comment utiliser BigPlayerRange : Cet indicateur trace des zones d’achat (ligne verte) et de vente (ligne rouge). Lorsque le prix clôture en dehors de ces zones, une tendance
IVISTscalp5
Vadym Zhukovskyi
5 (6)
iVISTscalp5 — Système de prévision du marché basé sur le temps iVISTscalp5 n’est pas un indicateur classique. C’est un système basé sur le timing pour MetaTrader 5, qui identifie quand le marché est le plus susceptible de bouger. ⸻ Fonctionnalités  • Timing précis  • Signaux BUY / SELL  • Potentiel de profit moyen  • Prévisions hebdomadaires  • 120+ instruments ⸻ Idée clé Le marché est influencé par le temps, pas seulement par le prix ⸻ iVISTscalp5 — Votre avantage temporel Nous vous
+++++++++++++++++++++++++++++++++++++++++++++++++++++++++++++++++++++++++++++++++++++++++++++++++ +++ Link to EURUSD Only Free Version -->  https://www.mql5.com/en/market/product/156904?source=Unknown +++++++++++++++++++++++++++++++++++++++++++++++++++++++++++++++++++++++++++++++++++++++++++++++++ Hallo Trader, This is a traditional GANN & FIBONACCI strategy based on detection of an impulsive move in the opposite direction. This is called a Breakout. At the moment of Breakout, the indicator draw
Frontier Pivots
Nestor Jose Mendez Boza
FRONTIER PIVOTS - Geometric Levels Indicator This indicator plots support and resistance levels/ranges on the chart using mathematical calculations. It helps traders identify potential price reaction zones based on geometric patterns. Main Features: Automatically calculates and displays key price levels Plots both support and resistance lines Uses daily price data for level calculation Clean visual presentation with different colors for different level types No repainting - levels remain static
Jita Indicator Pro MT5 | All Timeframes Professional Trend Agreement System – Premium Edition ($500) What Is Jita Indicator Pro? Jita Indicator Pro is a structured trend-confirmation system designed for serious traders who value precision, alignment, and controlled signal behavior. It combines: Advanced band-based trend direction logic ATR-driven structural trigger engine Dual-confirmation agreement system Locked history update design This indicator prints signals only when multiple conditions
VTrende Pro
Andrii Diachenko
5 (1)
VTrende Pro - MTF indicator for trend trading with a display panel for MT5 *** Videos can be translated into any language using subtitles (video language - Russian) Although the signals of the VTrende Pro indicator can be used as signals of a full-fledged trading system, it is recommended to use them in conjunction with the Bill Williams TS. VTrende Pro is an extended version of the VTrende indicator. Difference between Pro version and VTrende: - Time zones - Signal V - signal 1-2 waves -    S
Recommended TimeFrame >= H1. 100% Non Repainted at any moment.  Use it carefully, only with Trend Direction. Trading Usage: 2 Variants: as Range System or as BreakOut System (Both Only With Trend Direction)::: (Always use StopLoss for minimise Risk); [1] as Range System: (Recommended) in UP TREND:  - BUY in Blue Line , then if price goes down by 50 points (on H1) open Second BUY.   Close in any Profit you wish: TrailingStop(45 points) or Close when Price touches upper Gold Line. in DOWN TREND
FXLAND Smart Reversal Indicator (MT5) FXLAND Smart Reversal Indicator is a professional technical analysis tool designed to help traders identify potential price reversal zones and key market turning points with clarity and precision. The best reversal indicator and price return by choosing only one ceiling or floor in each time frame A masterpiece of combining mathematics and Gann, fractal matrix, Fibonacci, movement angle and time. Completely intelligent Key Features Detects potenti
Pantera Indicator
Temirlan Kdyrkhan
5 (1)
A tool for on-chart strategy backtesting and performance analysis. A utility for developing, debugging, and testing custom trading ideas and indicator functions. An indicator designed to quickly test trading concepts and visualize the effectiveness of different input parameters. An all-in-one sandbox for testing everything from simple crossovers to complex, multi-condition trading systems.
AlgoEAs Trend Dashboard V1 Indicator for MT5 Introduction: This is a Dashboard Indicator based on 7 built in Multi Timeframe indicators. This strategy gives Buy/Sell Ideas based on 9 trend states. Easy to view gas guage to view current trend. Has as optional Alerts to enable with 9 messages. Run on M15 chart, with M15, H1, and H4 indicator time frames. Great tool! Features: Non-Repainting Dashboard For Desktop MT5 Only, Works On Any Mt5 Pair Great for Intraday and Swing Trading Easy view gas
WanaScalper
Isaac Wanasolo
1 (1)
A scalping indicator based on mathematical patterns, which on average gives signals with relatively small SL, and also occasionally helps to catch big moves in the markets (more information in the video) This indicator has three main types of notifications: The first type warns of a possible/upcoming signal on the next bar The second type indicates the presence of a ready signal to enter the market/open a position The third type is for SL and TP levels - you will be notified every time price re
Historical Similarity Matcher Indicator (HI.SI.MA) Try it free today — demo version now available!   https://www.mql5.com/en/market/product/167114 Overview The Historical Similarity Matcher is a technical analysis indicator for MetaTrader 5. It scans historical price data to find segments that show statistical similarity to a user-selected reference period on the chart.
XCalper TFO
Aecio de Feo Flora Neto
This oscillator was developed exclusively by xCalper in 2015 based on moving averages calculations to indicate and try predicting oversold and overbought levels. The fast line (white, by default) oscillates basically between values -0.5 (oversold) and +0.5 (overbought). Whenever this line crosses upward value -0.5, it means an oversold price level. When it crosses downward value +0.5, it means an overbought price level. When fast line crosses value 0.0 and returns, it is a strong pull-back indic
The Expert Advisor and the video are attached in the Discussion tab . The robot applies only one order and strictly follows the signals to evaluate the indicator efficiency. Pan PrizMA CD Phase is an option based on the Pan PrizMA indicator. Details (in Russian). Averaging by a quadric-quartic polynomial increases the smoothness of lines, adds momentum and rhythm. Extrapolation by the sinusoid function near a constant allows adjusting the delay or lead of signals. The value of the phase - wave s
Классификатор силы тренда. Показания на истории не меняет. Изменяется классификация только незакрытого бара. По идее подобен полной системе ASCTrend, сигнальный модуль которой, точнее его аппроксимация в несколько "урезанном" виде, есть в свободном доступе, а также в терминале как сигнальный индикатор SilverTrend . Точной копией системы ASCTrend не является. Работает на всех инструментах и всех временных диапазонах. Индикатор использует несколько некоррелируемых между собой алгоритмов для класси
FFx Universal Strength Meter PRO is more than a basic strength meter. Instead of limiting the calculation to price, it can be based on any of the 19 integrated strength modes + 9 timeframes. With the FFx USM, you are able to define any period for any combination of timeframes. For example, you can set the dashboard for the last 10 candles for M15-H1-H4… Full flexibility! Very easy to interpret... It gives a great idea about which currency is weak and which is strong, so you can find the best pai
Plus de l'auteur
MAcapitalzone
Mr Nisit Noijeam
OIL Product setting  Define maximum allowed slippage as an input parameter (กำหนดค่า Slippage สูงสุดที่ยอมรับได้) ค่าที่ตั้งไว้: 50 อธิบาย: กำหนดความแตกต่างสูงสุดระหว่างราคาที่คาดว่าจะได้ซื้อขายกับราคาจริงที่เกิดขึ้นเพื่อป้องกันการซื้อขายที่เกิดขึ้นในราคาที่ไม่ต้องการ Enable buy orders (เปิดให้รับคำสั่งซื้อ) ค่าที่ตั้งไว้: true อธิบาย: กำหนดว่าจะเปิดใช้งานการซื้อ (Buy Orders) หรือไม่ ถ้า true แสดงว่าเปิดการซื้อขาย Initial price for red line (ราคาเริ่มต้นสำหรับเส้นแดง) ค่าที่ตั้งไว้: 85.0 อธิบ
CapitalGrid
Mr Nisit Noijeam
Code Components and Functionality Basic Information #property : Used to define the EA properties like copyright, link, version, and description. input : Parameters that users can customize in the EA, such as enabling/disabling buy/sell orders, price levels, take profit points, lot sizes, etc. Main Functions OnInit() : Executes when the EA is initialized. It creates a label on the chart and draws red lines at specified price levels (Red Line). OnDeinit(const int reason) : Executes when the EA is
CapitalTrendline
Mr Nisit Noijeam
EnJoy  trend line It is a basic tool in technical analysis which is used to track and predict the direction of price movements. It is created by connecting the lowest or highest points of prices on the chart. To create a straight line that helps in interpreting market direction. For example: Uptrend Line: Connects multiple low points on the chart. It indicates a continuous increase in prices. Downtrend Line: Connects multiple highs. It indicates a continuous decrease in prices. เส้นเทรนด์ไลน์
CapitalMAGL
Mr Nisit Noijeam
GRID MA TRADING Trading Strategy Overview Moving Average (MA) Based Decisions : The EA uses a Moving Average (MA) as a key indicator for its trading decisions. The type (Simple, Exponential, Smooth, Linear Weighted), period, and shift of the MA are configurable. It decides whether to buy or sell based on the position of the price relative to the MA. For example, it may stop buying if the price is below the MA or stop selling if the price is above the MA. Grid Trading System : The EA appears to i
การดำเนินงานพื้นฐาน : EA ทำงานโดยใช้หลักการของการเทรดแบบกริด ซึ่งหมายถึงการวางคำสั่งซื้อและขายเป็นระยะๆ (กำหนดเป็นเปอร์เซ็นต์ของราคา) ภายในโซนที่กำหนดไว้ พารามิเตอร์ป้อนข้อมูล : EA ใช้พารามิเตอร์หลายอย่าง เช่น ขนาดกริด, กำไรที่คาดหวัง, การหยุดขาดทุน (ทั้งหมดเป็นเปอร์เซ็นต์), โซนสำหรับการซื้อและขาย, ขนาดล็อต, และจำนวนคำสั่งสูงสุดที่อนุญาต พารามิเตอร์เหล่านี้มีความสำคัญในการกำหนดวิธีการทำงานของ EA การเริ่มต้น (OnInit) : เมื่อ EA เริ่มทำงาน, มันจะทำการเริ่มต้นโดยสร้างป้ายบนกราฟ (ชื่อ "MTRADER_Labe
Expert Advisor (EA),  MA Following  commonly known as a trading bot. It implements a grid trading strategy with the following characteristics: Moving Average and Standard Deviation : The EA uses a Moving Average (MA) as the core of its trading strategy, combined with Standard Deviation (SD) for trade entry and exit decisions. There are four types of MAs available: Simple, Exponential, Smoothed, and Linear Weighted. Users can select the MA type and set its period, as well as the period and facto
CapitalAsgard
Mr Nisit Noijeam
This EA, named "MTRADER," is designed for the MT4 (MetaTrader 4) trading platform. It operates based on a grid trading strategy and includes functionality for both buy and sell orders. Here's an overview of its key features and functionalities: Trading Zones: The EA operates within specified price zones for buying and selling. BuyZoneStart and BuyZoneEnd define the range within which the EA will consider placing buy orders, while SellZoneStart and SellZoneEnd define the range for sell orders. Or
CapitalCraft
Mr Nisit Noijeam
A Grid EA (Grid Expert Advisor) is an automated trading system used in the financial markets that employs a grid trading strategy. Grid trading involves opening buy and sell orders at predetermined price levels, with a specified price interval, known as the price grid. This trading strategy is similar to placing Buy Limit and Sell Limit orders at pre-defined price and time intervals. The EA operates automatically based on predefined rules and typically includes the following features: Price Gr
CapitalRoyal
Mr Nisit Noijeam
MA trend following 1sd signal  The EA appears to use a combination of moving averages and standard deviation to make trading decisions, with the option to increase lot sizes after consecutive losses, potentially aiming for a martingale-like strategy. It's important to note that while EAs can automate trading, they come with risks, especially when using strategies like lot size increase on loss. Users should thoroughly backtest and understand the EA's strategy and risks before using it in live tr
Capital ATR
Mr Nisit Noijeam
Expert Advisor (EA) for MetaTrader 4 (MT4) platform, named MTRADER. Its primary strategy appears to be a grid trading strategy based on moving averages and average true range (ATR) volatility. Here's a breakdown of its key components and functionalities: Initialization Parameters : It defines various input parameters such as Moving Average Type (Simple, Exponential, Smoothed, or Linear Weighted), Moving Average Period, ATR Period, ATR Factor, Initial Lot Size, etc. These parameters can be adjust
Capitalgrid01
Mr Nisit Noijeam
A grid trading strategy is a method used in financial markets, particularly in forex trading, that involves placing buy and sell orders at regular intervals above and below a set price level. This creates a grid-like pattern of orders on the chart, hence the name "grid trading." Here’s a detailed explanation: Grid Trading Strategy Basic Concept : Grid trading is designed to capitalize on market volatility. The strategy works best in ranging or sideways markets, where prices fluctuate within a c
Capitalformular
Mr Nisit Noijeam
กลยุทธ์ HFT Hedging แบบปรับลอตเพิ่ม ตั้งต้นด้วยสถานะสองฝั่ง (Long และ Short) ในการ Hedging คุณจะเปิดสถานะทั้งฝั่ง Long และ Short พร้อมกันในตราสารเดียวกันเพื่อป้องกันความเสี่ยงจากการเคลื่อนไหวในทิศทางใดทิศทางหนึ่ง คุณจะเริ่มเปิดสถานะโดยใช้ลอตต่ำที่สุด เพื่อทดสอบทิศทางการเคลื่อนไหวของตลาด ใช้เงื่อนไขในการเปิดสถานะเพิ่มเติม (ปรับลอตเพิ่ม) เมื่อสถานะหนึ่งขยับเข้าใกล้เป้าหมายกำไร (Take Profit หรือ TP) หรือเริ่มเข้าเขตทำกำไร (เช่น เมื่อ ATR หรือ ค่า Technical Indicator อื่นๆ บอกถึงความผันผวนที่เพิ่มขึ
Capitalrecover
Mr Nisit Noijeam
HFT  ZONE MOMENTUM RECOVERY EA_Name ค่า: HFT MTRADER ใช้สำหรับระบุชื่อของ EA เพื่อให้ง่ายต่อการจัดการหรือตรวจสอบในประวัติการเทรด (History) Lot_fix ค่า: 0.02 ใช้กำหนดขนาดของล็อตคงที่ (Fixed Lot Size) ที่ EA จะเปิดในแต่ละคำสั่งเทรด โดยไม่ขึ้นอยู่กับเงื่อนไขอื่น ๆ Lots_X ค่า: 1.5 ตัวคูณล็อต (Lot Multiplier) ซึ่งมักใช้ในการเพิ่มขนาดล็อตในลักษณะการ Martingale หรือ Hedging โดยเมื่อขาดทุนหรือเปิดคำสั่งถัดไป ระบบจะเพิ่มล็อตตามค่าที่กำหนดไว้ High_Low_end_candle ค่า: 10 จำนวนแท่งเทียนที่ใช้ในการคำนวณระ
CapitalTrendline2
Mr Nisit Noijeam
EnJoy  trend line It is a basic tool in technical analysis which is used to track and predict the direction of price movements. It is created by connecting the lowest or highest points of prices on the chart. To create a straight line that helps in interpreting market direction. For example: Uptrend Line: Connects multiple low points on the chart. It indicates a continuous increase in prices. Downtrend Line: Connects multiple highs. It indicates a continuous decrease in prices. เส้นเทรนด์ไลน์ เป
Capitalrecover2
Mr Nisit Noijeam
HFT  ZONE MOMENTUM RECOVERY EA_Name ค่า: HFT MTRADER ใช้สำหรับระบุชื่อของ EA เพื่อให้ง่ายต่อการจัดการหรือตรวจสอบในประวัติการเทรด (History) Lot_fix ค่า: 0.02 ใช้กำหนดขนาดของล็อตคงที่ (Fixed Lot Size) ที่ EA จะเปิดในแต่ละคำสั่งเทรด โดยไม่ขึ้นอยู่กับเงื่อนไขอื่น ๆ Lots_X ค่า: 1.5 ตัวคูณล็อต (Lot Multiplier) ซึ่งมักใช้ในการเพิ่มขนาดล็อตในลักษณะการ Martingale หรือ Hedging โดยเมื่อขาดทุนหรือเปิดคำสั่งถัดไป ระบบจะเพิ่มล็อตตามค่าที่กำหนดไว้ High_Low_end_candle ค่า: 10 จำนวนแท่งเทียนที่ใช้ในการคำนวณระ
Capitalallweather
Mr Nisit Noijeam
BB-Trader Pro: ปลดล็อกพลังการเทรดทำกำไรในทุกสภาวะตลาด! เบื่อไหม? กับ EA ที่ใช้ได้ดีแค่ในตลาดบางช่วง... พอตลาดเปลี่ยนจากมีเทรนด์เป็น Sideways สัญญาณก็เริ่มพลาด ล้างพอร์ตโดยไม่รู้ตัว ถึงเวลาแล้วที่จะปฏิวัติการเทรดของคุณด้วย BB-Trader Pro EA อัจฉริยะที่ถูกออกแบบมาให้ "คิดและปรับตัว" ได้เหมือนเทรดเดอร์มืออาชีพ! "สมองกลสองโหมด" กลยุทธ์ที่ไม่เคยหยุดนิ่ง หัวใจหลักของ BB-Trader Pro คือความสามารถในการวิเคราะห์ความผันผวนของตลาดจาก Bollinger Bands และปรับเปลี่ยนกลยุทธ์การเทรดโดยอัตโนมัติ โหมดเทรดปกติ (N
Doncapital
Mr Nisit Noijeam
https://youtu.be/j_LyNuxNmpc?si=8gKkEP8Mx11TAoqJ อีเอตัวนี้คือ "Grid Trading EA แบบ 2 ทาง (Buy/Sell ทำงานอิสระ)" ที่เสริมระบบป้องกันความเสี่ยงขั้นสูง กลยุทธ์หลัก (Independent Grid): วางตาข่าย Buy และ Sell แยกกัน ถ้าราคาขยับไปชนเส้น Grid ที่ตั้งไว้ บอทก็จะเปิดออเดอร์ฝั่งนั้นๆ สะสมไปเรื่อยๆ ตัวกรองเทรนด์ (Donchian Channel): ใช้ประเมินกรอบราคา สามารถสั่งให้บอท "หยุด" เปิดออเดอร์สวนเทรนด์ (เช่น ห้าม Buy ถ้าราคาอยู่ครึ่งล่าง) และใช้เส้น Donchian เป็นจุดเลื่อน Stop Loss อัตโนมัติได้ ระบบรวบกำไร (Auto
Filtrer:
Aucun avis
Répondre à l'avis